
Key Insights
The Floating Solar Panels market is experiencing robust growth, driven by increasing demand for renewable energy sources and the limitations of land-based solar installations. The period from 2019 to 2024 witnessed significant market expansion, laying a solid foundation for continued growth. While precise market size figures for past years are unavailable, industry reports suggest a substantial increase, fueled by factors like government incentives for clean energy adoption, technological advancements leading to improved efficiency and cost reductions, and the growing awareness of the environmental benefits of solar power. The market's compound annual growth rate (CAGR) from 2019-2033 projects sustained expansion, indicating a strong future outlook. This positive trajectory is further strengthened by the increasing deployment of floating solar farms in water bodies, particularly in regions facing land scarcity and water resource management challenges. This innovative approach optimizes land use and offers a unique solution for harnessing solar energy in diverse geographical locations.
The forecast period (2025-2033) promises further substantial growth driven by several key factors. These include ongoing technological innovations enhancing panel efficiency and durability, decreasing production costs, and increasing government support through subsidies and favorable regulatory frameworks. The burgeoning demand for clean energy, coupled with concerns surrounding climate change, will also continue to bolster market expansion. Furthermore, the development of hybrid projects integrating floating solar with other renewable energy sources, such as hydropower, will further accelerate market penetration and diversification. The market is expected to witness increased geographic diversification as more countries explore the potential of floating solar technologies. This expansion will be driven by factors such as favorable climatic conditions, conducive government policies, and the availability of suitable water bodies for installation.
Floating Solar Panels Market: A Comprehensive Report (2019-2033)
This comprehensive report provides a detailed analysis of the global Floating Solar Panels market, encompassing market dynamics, growth trends, regional insights, product landscape, key players, and future outlook. The study period covers 2019-2033, with 2025 as the base year and a forecast period of 2025-2033. The report segments the market by source (Renewable and Non-Renewable (Wind)) and offers valuable insights for industry professionals, investors, and stakeholders. The total market size is projected to reach xx Million units by 2033.
Floating Solar Panels Market Dynamics & Structure
This section analyzes the competitive landscape, technological advancements, regulatory influences, and market trends shaping the floating solar panels industry. The market exhibits a moderately concentrated structure, with several key players vying for market share. The analysis incorporates quantitative data, such as market share percentages and M&A deal volumes (xx deals in the past 5 years), alongside qualitative insights on innovation barriers and the impact of evolving regulations.
- Market Concentration: Moderately concentrated, with key players holding xx% of market share.
- Technological Innovation: Focus on enhanced efficiency, durability, and reduced costs driving innovation. Significant R&D investments are observed across the value chain.
- Regulatory Frameworks: Government incentives and supportive policies are crucial drivers, particularly in regions prioritizing renewable energy adoption. Varied regulatory landscapes across different countries impact market growth.
- Competitive Product Substitutes: Traditional land-based solar and other renewable energy sources pose competitive pressures.
- End-User Demographics: Utilities, industrial facilities, and residential sectors are primary end-users, with diverse adoption rates based on regional energy needs and economic conditions.
- M&A Trends: Consolidation is expected as larger players seek to expand their market reach and technological capabilities, with xx M&A deals anticipated by 2033.
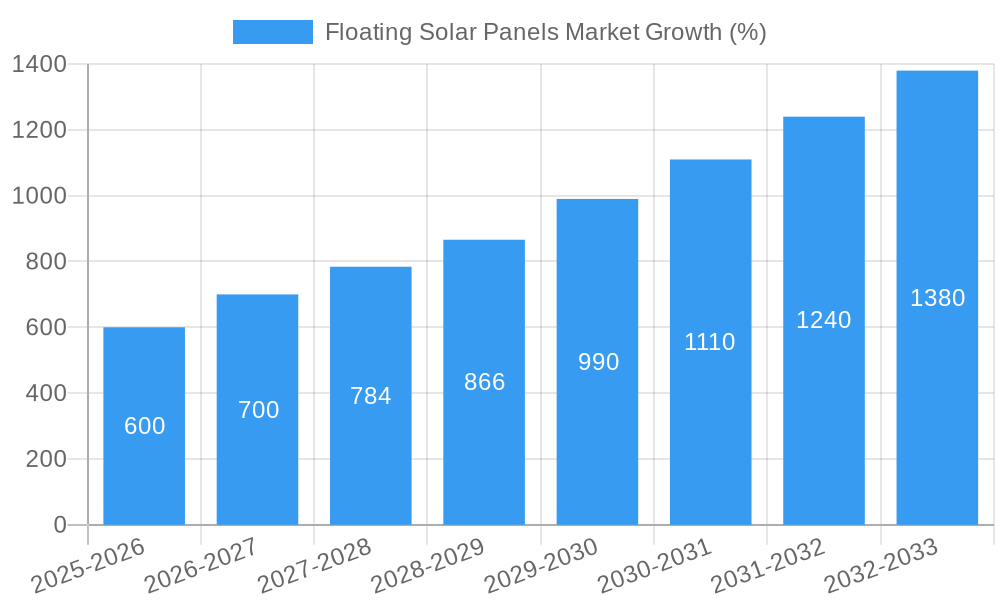
Floating Solar Panels Market Growth Trends & Insights
This section provides a detailed analysis of the market size evolution, adoption rates, technological disruptions, and consumer behavior shifts in the floating solar panels market using XXX data analysis methodologies. The market is experiencing robust growth, driven by the increasing demand for renewable energy and the advantages of floating solar systems. Key metrics, such as CAGR (xx%) and market penetration rates, are included for enhanced insight. The report thoroughly examines the factors influencing market growth, including technological breakthroughs and evolving consumer preferences towards sustainable energy solutions.
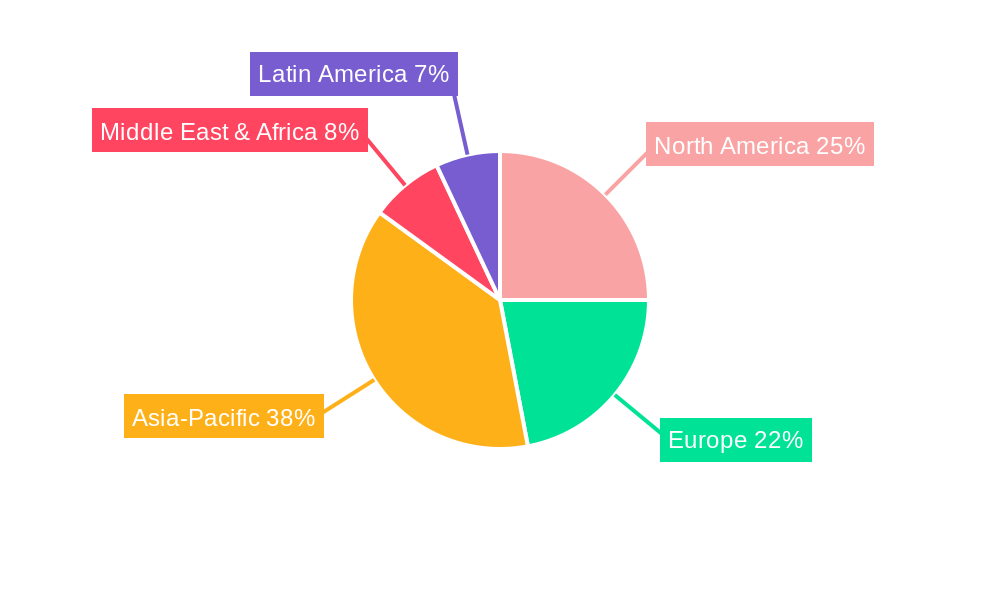
Dominant Regions, Countries, or Segments in Floating Solar Panels Market
This section identifies the leading regions, countries, and segments within the floating solar panels market, focusing on the Renewable and Non-Renewable(Wind) segments. Analysis highlights key market drivers (e.g., favorable government policies, supportive infrastructure) and dominance factors (market share, growth potential). The Renewable segment is expected to maintain its dominance throughout the forecast period due to growing environmental concerns and increasing government support for renewable energy initiatives. Specific countries showing significant potential in the Renewable segment include [List specific countries and reasons], whereas in the Non-Renewable (Wind) segment, [List specific countries and reasons].
- Key Drivers (Renewable Segment): Supportive government policies, increasing environmental awareness, land scarcity, and decreasing installation costs.
- Key Drivers (Non-Renewable(Wind) Segment): Integration with existing offshore wind infrastructure, technological advancements, and governmental incentives.
Floating Solar Panels Market Product Landscape
This section details the product innovations, applications, and performance metrics of floating solar panel systems. The market showcases a variety of designs and technologies aimed at optimizing energy generation, durability, and cost-effectiveness. Recent advancements include improved panel efficiency, advanced mounting systems, and integrated monitoring technologies. These innovations address challenges related to water exposure, harsh weather conditions, and maintenance requirements, contributing to the enhanced performance and widespread adoption of floating solar solutions.
Key Drivers, Barriers & Challenges in Floating Solar Panels Market
Key Drivers:
- Increasing demand for renewable energy sources.
- Growing concerns about climate change and environmental sustainability.
- Land scarcity and the availability of water bodies for large-scale solar installations.
- Government incentives and supportive policies for renewable energy projects.
- Technological advancements leading to increased efficiency and reduced costs.
Key Challenges and Restraints:
- High initial investment costs.
- Technological complexities and challenges associated with water-based installations.
- Potential environmental impacts on aquatic ecosystems.
- Regulatory uncertainties and permitting processes in different regions.
- Supply chain disruptions and material availability constraints.
Emerging Opportunities in Floating Solar Panels Market
Emerging opportunities include expansion into untapped markets (e.g., developing countries with abundant water resources), integration with other renewable energy technologies (e.g., hybrid systems), and the development of innovative applications (e.g., agrivoltaics, floating solar farms integrated with aquaculture). Furthermore, advancements in storage technologies are creating opportunities for enhanced grid stability and improved energy management in floating solar installations.
Growth Accelerators in the Floating Solar Panels Market Industry
Long-term growth will be fueled by technological breakthroughs in panel efficiency, advanced materials, and improved system designs. Strategic partnerships between technology providers, EPC contractors, and energy developers will play a critical role in driving market expansion. Furthermore, the growing focus on decarbonization, energy security, and the increasing affordability of floating solar systems will create significant growth opportunities across various regions.
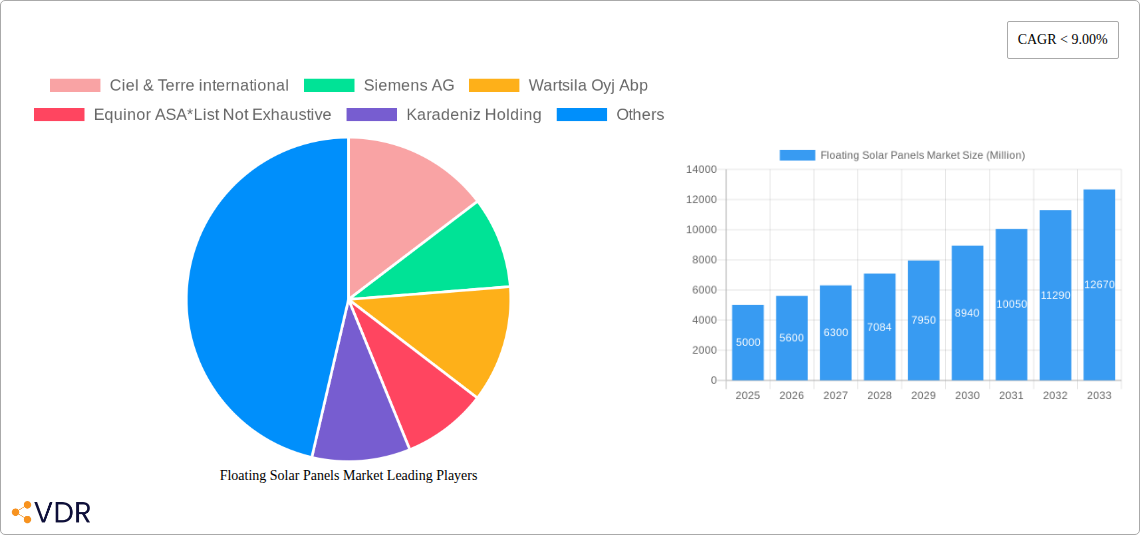
Key Players Shaping the Floating Solar Panels Market Market
- Ciel & Terre international
- Siemens AG
- Wartsila Oyj Abp
- Equinor ASA
- Karadeniz Holding
- General Electric Company
- Kawasaki Heavy Industries Ltd
- SunPower Corporation
- First Solar, Inc.
- Trina Solar Limited
- JA Solar Technology Co., Ltd.
- Sunseap Group
Notable Milestones in Floating Solar Panels Market Sector
- 2021 (June): SunPower Corporation announces the launch of its Helix™ Floating Solar Power Plant.
- 2022 (March): Equinor ASA commissions the world's largest floating solar farm in the Netherlands (230 MW).
- 2023 (May): Siemens Energy unveils its latest generation of floating solar solutions.
In-Depth Floating Solar Panels Market Market Outlook
The floating solar panels market is poised for significant growth in the coming years, driven by a confluence of factors, including increasing demand for renewable energy, supportive government policies, technological advancements, and cost reductions. Strategic investments in R&D, expansion into new markets, and collaborations among industry players will be critical in realizing the market's full potential. The focus will be on developing more efficient, cost-effective, and environmentally friendly floating solar solutions to meet the growing global energy demands.
Floating Solar Panels Market Segmentation
-
1. Source
-
1.1. Renewable
- 1.1.1. Solar
- 1.1.2. Wind
-
1.2. Non-Renewable
- 1.2.1. Gas Engines
- 1.2.2. IC Engines
-
1.1. Renewable
Floating Solar Panels Market Segmentation By Geography
- 1. North America
- 2. Europe
- 3. Asia Pacific
- 4. South America
- 5. Middle East and Africa
Floating Solar Panels Market REPORT HIGHLIGHTS
| Aspects | Details |
|---|---|
| Study Period | 2019-2033 |
| Base Year | 2024 |
| Estimated Year | 2025 |
| Forecast Period | 2025-2033 |
| Historical Period | 2019-2024 |
| Growth Rate | CAGR of < 9.00% from 2019-2033 |
| Segmentation |
|
Table of Contents
- 1. Introduction
- 1.1. Research Scope
- 1.2. Market Segmentation
- 1.3. Research Methodology
- 1.4. Definitions and Assumptions
- 2. Executive Summary
- 2.1. Introduction
- 3. Market Dynamics
- 3.1. Introduction
- 3.2. Market Drivers
- 3.2.1. 4.; Growing Uses of Natural Gas in Various Sectors
- 3.3. Market Restrains
- 3.3.1. 4.; Volatile Natural Gas Prices
- 3.4. Market Trends
- 3.4.1. Renewable Segment Expected to Dominate the Market
- 4. Market Factor Analysis
- 4.1. Porters Five Forces
- 4.2. Supply/Value Chain
- 4.3. PESTEL analysis
- 4.4. Market Entropy
- 4.5. Patent/Trademark Analysis
- 5. Global Floating Solar Panels Market Analysis, Insights and Forecast, 2019-2031
- 5.1. Market Analysis, Insights and Forecast - by Source
- 5.1.1. Renewable
- 5.1.1.1. Solar
- 5.1.1.2. Wind
- 5.1.2. Non-Renewable
- 5.1.2.1. Gas Engines
- 5.1.2.2. IC Engines
- 5.1.1. Renewable
- 5.2. Market Analysis, Insights and Forecast - by Region
- 5.2.1. North America
- 5.2.2. Europe
- 5.2.3. Asia Pacific
- 5.2.4. South America
- 5.2.5. Middle East and Africa
- 5.1. Market Analysis, Insights and Forecast - by Source
- 6. North America Floating Solar Panels Market Analysis, Insights and Forecast, 2019-2031
- 6.1. Market Analysis, Insights and Forecast - by Source
- 6.1.1. Renewable
- 6.1.1.1. Solar
- 6.1.1.2. Wind
- 6.1.2. Non-Renewable
- 6.1.2.1. Gas Engines
- 6.1.2.2. IC Engines
- 6.1.1. Renewable
- 6.1. Market Analysis, Insights and Forecast - by Source
- 7. Europe Floating Solar Panels Market Analysis, Insights and Forecast, 2019-2031
- 7.1. Market Analysis, Insights and Forecast - by Source
- 7.1.1. Renewable
- 7.1.1.1. Solar
- 7.1.1.2. Wind
- 7.1.2. Non-Renewable
- 7.1.2.1. Gas Engines
- 7.1.2.2. IC Engines
- 7.1.1. Renewable
- 7.1. Market Analysis, Insights and Forecast - by Source
- 8. Asia Pacific Floating Solar Panels Market Analysis, Insights and Forecast, 2019-2031
- 8.1. Market Analysis, Insights and Forecast - by Source
- 8.1.1. Renewable
- 8.1.1.1. Solar
- 8.1.1.2. Wind
- 8.1.2. Non-Renewable
- 8.1.2.1. Gas Engines
- 8.1.2.2. IC Engines
- 8.1.1. Renewable
- 8.1. Market Analysis, Insights and Forecast - by Source
- 9. South America Floating Solar Panels Market Analysis, Insights and Forecast, 2019-2031
- 9.1. Market Analysis, Insights and Forecast - by Source
- 9.1.1. Renewable
- 9.1.1.1. Solar
- 9.1.1.2. Wind
- 9.1.2. Non-Renewable
- 9.1.2.1. Gas Engines
- 9.1.2.2. IC Engines
- 9.1.1. Renewable
- 9.1. Market Analysis, Insights and Forecast - by Source
- 10. Middle East and Africa Floating Solar Panels Market Analysis, Insights and Forecast, 2019-2031
- 10.1. Market Analysis, Insights and Forecast - by Source
- 10.1.1. Renewable
- 10.1.1.1. Solar
- 10.1.1.2. Wind
- 10.1.2. Non-Renewable
- 10.1.2.1. Gas Engines
- 10.1.2.2. IC Engines
- 10.1.1. Renewable
- 10.1. Market Analysis, Insights and Forecast - by Source
- 11. North America Floating Solar Panels Market Analysis, Insights and Forecast, 2019-2031
- 11.1. Market Analysis, Insights and Forecast - By Country/Sub-region
- 11.1.1 United States
- 11.1.2 Canada
- 11.1.3 Mexico
- 12. Europe Floating Solar Panels Market Analysis, Insights and Forecast, 2019-2031
- 12.1. Market Analysis, Insights and Forecast - By Country/Sub-region
- 12.1.1 Germany
- 12.1.2 United Kingdom
- 12.1.3 France
- 12.1.4 Spain
- 12.1.5 Italy
- 12.1.6 Spain
- 12.1.7 Belgium
- 12.1.8 Netherland
- 12.1.9 Nordics
- 12.1.10 Rest of Europe
- 13. Asia Pacific Floating Solar Panels Market Analysis, Insights and Forecast, 2019-2031
- 13.1. Market Analysis, Insights and Forecast - By Country/Sub-region
- 13.1.1 China
- 13.1.2 Japan
- 13.1.3 India
- 13.1.4 South Korea
- 13.1.5 Southeast Asia
- 13.1.6 Australia
- 13.1.7 Indonesia
- 13.1.8 Phillipes
- 13.1.9 Singapore
- 13.1.10 Thailandc
- 13.1.11 Rest of Asia Pacific
- 14. South America Floating Solar Panels Market Analysis, Insights and Forecast, 2019-2031
- 14.1. Market Analysis, Insights and Forecast - By Country/Sub-region
- 14.1.1 Brazil
- 14.1.2 Argentina
- 14.1.3 Peru
- 14.1.4 Chile
- 14.1.5 Colombia
- 14.1.6 Ecuador
- 14.1.7 Venezuela
- 14.1.8 Rest of South America
- 15. North America Floating Solar Panels Market Analysis, Insights and Forecast, 2019-2031
- 15.1. Market Analysis, Insights and Forecast - By Country/Sub-region
- 15.1.1 United States
- 15.1.2 Canada
- 15.1.3 Mexico
- 16. MEA Floating Solar Panels Market Analysis, Insights and Forecast, 2019-2031
- 16.1. Market Analysis, Insights and Forecast - By Country/Sub-region
- 16.1.1 United Arab Emirates
- 16.1.2 Saudi Arabia
- 16.1.3 South Africa
- 16.1.4 Rest of Middle East and Africa
- 17. Competitive Analysis
- 17.1. Global Market Share Analysis 2024
- 17.2. Company Profiles
- 17.2.1 Ciel & Terre international
- 17.2.1.1. Overview
- 17.2.1.2. Products
- 17.2.1.3. SWOT Analysis
- 17.2.1.4. Recent Developments
- 17.2.1.5. Financials (Based on Availability)
- 17.2.2 Siemens AG
- 17.2.2.1. Overview
- 17.2.2.2. Products
- 17.2.2.3. SWOT Analysis
- 17.2.2.4. Recent Developments
- 17.2.2.5. Financials (Based on Availability)
- 17.2.3 Wartsila Oyj Abp
- 17.2.3.1. Overview
- 17.2.3.2. Products
- 17.2.3.3. SWOT Analysis
- 17.2.3.4. Recent Developments
- 17.2.3.5. Financials (Based on Availability)
- 17.2.4 Equinor ASA*List Not Exhaustive
- 17.2.4.1. Overview
- 17.2.4.2. Products
- 17.2.4.3. SWOT Analysis
- 17.2.4.4. Recent Developments
- 17.2.4.5. Financials (Based on Availability)
- 17.2.5 Karadeniz Holding
- 17.2.5.1. Overview
- 17.2.5.2. Products
- 17.2.5.3. SWOT Analysis
- 17.2.5.4. Recent Developments
- 17.2.5.5. Financials (Based on Availability)
- 17.2.6 General Electric Company
- 17.2.6.1. Overview
- 17.2.6.2. Products
- 17.2.6.3. SWOT Analysis
- 17.2.6.4. Recent Developments
- 17.2.6.5. Financials (Based on Availability)
- 17.2.7 Kawasaki Heavy Industries Ltd
- 17.2.7.1. Overview
- 17.2.7.2. Products
- 17.2.7.3. SWOT Analysis
- 17.2.7.4. Recent Developments
- 17.2.7.5. Financials (Based on Availability)
- 17.2.8 SunPower Corporation
- 17.2.8.1. Overview
- 17.2.8.2. Products
- 17.2.8.3. SWOT Analysis
- 17.2.8.4. Recent Developments
- 17.2.8.5. Financials (Based on Availability)
- 17.2.9 First Solar Inc.
- 17.2.9.1. Overview
- 17.2.9.2. Products
- 17.2.9.3. SWOT Analysis
- 17.2.9.4. Recent Developments
- 17.2.9.5. Financials (Based on Availability)
- 17.2.10 Trina Solar Limited
- 17.2.10.1. Overview
- 17.2.10.2. Products
- 17.2.10.3. SWOT Analysis
- 17.2.10.4. Recent Developments
- 17.2.10.5. Financials (Based on Availability)
- 17.2.11 JA Solar Technology Co. Ltd.
- 17.2.11.1. Overview
- 17.2.11.2. Products
- 17.2.11.3. SWOT Analysis
- 17.2.11.4. Recent Developments
- 17.2.11.5. Financials (Based on Availability)
- 17.2.12 Sunseap Group
- 17.2.12.1. Overview
- 17.2.12.2. Products
- 17.2.12.3. SWOT Analysis
- 17.2.12.4. Recent Developments
- 17.2.12.5. Financials (Based on Availability)
- 17.2.1 Ciel & Terre international
List of Figures
- Figure 1: Global Floating Solar Panels Market Revenue Breakdown (Million, %) by Region 2024 & 2032
- Figure 2: Global Floating Solar Panels Market Volume Breakdown (K Tons, %) by Region 2024 & 2032
- Figure 3: North America Floating Solar Panels Market Revenue (Million), by Country 2024 & 2032
- Figure 4: North America Floating Solar Panels Market Volume (K Tons), by Country 2024 & 2032
- Figure 5: North America Floating Solar Panels Market Revenue Share (%), by Country 2024 & 2032
- Figure 6: North America Floating Solar Panels Market Volume Share (%), by Country 2024 & 2032
- Figure 7: Europe Floating Solar Panels Market Revenue (Million), by Country 2024 & 2032
- Figure 8: Europe Floating Solar Panels Market Volume (K Tons), by Country 2024 & 2032
- Figure 9: Europe Floating Solar Panels Market Revenue Share (%), by Country 2024 & 2032
- Figure 10: Europe Floating Solar Panels Market Volume Share (%), by Country 2024 & 2032
- Figure 11: Asia Pacific Floating Solar Panels Market Revenue (Million), by Country 2024 & 2032
- Figure 12: Asia Pacific Floating Solar Panels Market Volume (K Tons), by Country 2024 & 2032
- Figure 13: Asia Pacific Floating Solar Panels Market Revenue Share (%), by Country 2024 & 2032
- Figure 14: Asia Pacific Floating Solar Panels Market Volume Share (%), by Country 2024 & 2032
- Figure 15: South America Floating Solar Panels Market Revenue (Million), by Country 2024 & 2032
- Figure 16: South America Floating Solar Panels Market Volume (K Tons), by Country 2024 & 2032
- Figure 17: South America Floating Solar Panels Market Revenue Share (%), by Country 2024 & 2032
- Figure 18: South America Floating Solar Panels Market Volume Share (%), by Country 2024 & 2032
- Figure 19: North America Floating Solar Panels Market Revenue (Million), by Country 2024 & 2032
- Figure 20: North America Floating Solar Panels Market Volume (K Tons), by Country 2024 & 2032
- Figure 21: North America Floating Solar Panels Market Revenue Share (%), by Country 2024 & 2032
- Figure 22: North America Floating Solar Panels Market Volume Share (%), by Country 2024 & 2032
- Figure 23: MEA Floating Solar Panels Market Revenue (Million), by Country 2024 & 2032
- Figure 24: MEA Floating Solar Panels Market Volume (K Tons), by Country 2024 & 2032
- Figure 25: MEA Floating Solar Panels Market Revenue Share (%), by Country 2024 & 2032
- Figure 26: MEA Floating Solar Panels Market Volume Share (%), by Country 2024 & 2032
- Figure 27: North America Floating Solar Panels Market Revenue (Million), by Source 2024 & 2032
- Figure 28: North America Floating Solar Panels Market Volume (K Tons), by Source 2024 & 2032
- Figure 29: North America Floating Solar Panels Market Revenue Share (%), by Source 2024 & 2032
- Figure 30: North America Floating Solar Panels Market Volume Share (%), by Source 2024 & 2032
- Figure 31: North America Floating Solar Panels Market Revenue (Million), by Country 2024 & 2032
- Figure 32: North America Floating Solar Panels Market Volume (K Tons), by Country 2024 & 2032
- Figure 33: North America Floating Solar Panels Market Revenue Share (%), by Country 2024 & 2032
- Figure 34: North America Floating Solar Panels Market Volume Share (%), by Country 2024 & 2032
- Figure 35: Europe Floating Solar Panels Market Revenue (Million), by Source 2024 & 2032
- Figure 36: Europe Floating Solar Panels Market Volume (K Tons), by Source 2024 & 2032
- Figure 37: Europe Floating Solar Panels Market Revenue Share (%), by Source 2024 & 2032
- Figure 38: Europe Floating Solar Panels Market Volume Share (%), by Source 2024 & 2032
- Figure 39: Europe Floating Solar Panels Market Revenue (Million), by Country 2024 & 2032
- Figure 40: Europe Floating Solar Panels Market Volume (K Tons), by Country 2024 & 2032
- Figure 41: Europe Floating Solar Panels Market Revenue Share (%), by Country 2024 & 2032
- Figure 42: Europe Floating Solar Panels Market Volume Share (%), by Country 2024 & 2032
- Figure 43: Asia Pacific Floating Solar Panels Market Revenue (Million), by Source 2024 & 2032
- Figure 44: Asia Pacific Floating Solar Panels Market Volume (K Tons), by Source 2024 & 2032
- Figure 45: Asia Pacific Floating Solar Panels Market Revenue Share (%), by Source 2024 & 2032
- Figure 46: Asia Pacific Floating Solar Panels Market Volume Share (%), by Source 2024 & 2032
- Figure 47: Asia Pacific Floating Solar Panels Market Revenue (Million), by Country 2024 & 2032
- Figure 48: Asia Pacific Floating Solar Panels Market Volume (K Tons), by Country 2024 & 2032
- Figure 49: Asia Pacific Floating Solar Panels Market Revenue Share (%), by Country 2024 & 2032
- Figure 50: Asia Pacific Floating Solar Panels Market Volume Share (%), by Country 2024 & 2032
- Figure 51: South America Floating Solar Panels Market Revenue (Million), by Source 2024 & 2032
- Figure 52: South America Floating Solar Panels Market Volume (K Tons), by Source 2024 & 2032
- Figure 53: South America Floating Solar Panels Market Revenue Share (%), by Source 2024 & 2032
- Figure 54: South America Floating Solar Panels Market Volume Share (%), by Source 2024 & 2032
- Figure 55: South America Floating Solar Panels Market Revenue (Million), by Country 2024 & 2032
- Figure 56: South America Floating Solar Panels Market Volume (K Tons), by Country 2024 & 2032
- Figure 57: South America Floating Solar Panels Market Revenue Share (%), by Country 2024 & 2032
- Figure 58: South America Floating Solar Panels Market Volume Share (%), by Country 2024 & 2032
- Figure 59: Middle East and Africa Floating Solar Panels Market Revenue (Million), by Source 2024 & 2032
- Figure 60: Middle East and Africa Floating Solar Panels Market Volume (K Tons), by Source 2024 & 2032
- Figure 61: Middle East and Africa Floating Solar Panels Market Revenue Share (%), by Source 2024 & 2032
- Figure 62: Middle East and Africa Floating Solar Panels Market Volume Share (%), by Source 2024 & 2032
- Figure 63: Middle East and Africa Floating Solar Panels Market Revenue (Million), by Country 2024 & 2032
- Figure 64: Middle East and Africa Floating Solar Panels Market Volume (K Tons), by Country 2024 & 2032
- Figure 65: Middle East and Africa Floating Solar Panels Market Revenue Share (%), by Country 2024 & 2032
- Figure 66: Middle East and Africa Floating Solar Panels Market Volume Share (%), by Country 2024 & 2032
List of Tables
- Table 1: Global Floating Solar Panels Market Revenue Million Forecast, by Region 2019 & 2032
- Table 2: Global Floating Solar Panels Market Volume K Tons Forecast, by Region 2019 & 2032
- Table 3: Global Floating Solar Panels Market Revenue Million Forecast, by Source 2019 & 2032
- Table 4: Global Floating Solar Panels Market Volume K Tons Forecast, by Source 2019 & 2032
- Table 5: Global Floating Solar Panels Market Revenue Million Forecast, by Region 2019 & 2032
- Table 6: Global Floating Solar Panels Market Volume K Tons Forecast, by Region 2019 & 2032
- Table 7: Global Floating Solar Panels Market Revenue Million Forecast, by Country 2019 & 2032
- Table 8: Global Floating Solar Panels Market Volume K Tons Forecast, by Country 2019 & 2032
- Table 9: United States Floating Solar Panels Market Revenue (Million) Forecast, by Application 2019 & 2032
- Table 10: United States Floating Solar Panels Market Volume (K Tons) Forecast, by Application 2019 & 2032
- Table 11: Canada Floating Solar Panels Market Revenue (Million) Forecast, by Application 2019 & 2032
- Table 12: Canada Floating Solar Panels Market Volume (K Tons) Forecast, by Application 2019 & 2032
- Table 13: Mexico Floating Solar Panels Market Revenue (Million) Forecast, by Application 2019 & 2032
- Table 14: Mexico Floating Solar Panels Market Volume (K Tons) Forecast, by Application 2019 & 2032
- Table 15: Global Floating Solar Panels Market Revenue Million Forecast, by Country 2019 & 2032
- Table 16: Global Floating Solar Panels Market Volume K Tons Forecast, by Country 2019 & 2032
- Table 17: Germany Floating Solar Panels Market Revenue (Million) Forecast, by Application 2019 & 2032
- Table 18: Germany Floating Solar Panels Market Volume (K Tons) Forecast, by Application 2019 & 2032
- Table 19: United Kingdom Floating Solar Panels Market Revenue (Million) Forecast, by Application 2019 & 2032
- Table 20: United Kingdom Floating Solar Panels Market Volume (K Tons) Forecast, by Application 2019 & 2032
- Table 21: France Floating Solar Panels Market Revenue (Million) Forecast, by Application 2019 & 2032
- Table 22: France Floating Solar Panels Market Volume (K Tons) Forecast, by Application 2019 & 2032
- Table 23: Spain Floating Solar Panels Market Revenue (Million) Forecast, by Application 2019 & 2032
- Table 24: Spain Floating Solar Panels Market Volume (K Tons) Forecast, by Application 2019 & 2032
- Table 25: Italy Floating Solar Panels Market Revenue (Million) Forecast, by Application 2019 & 2032
- Table 26: Italy Floating Solar Panels Market Volume (K Tons) Forecast, by Application 2019 & 2032
- Table 27: Spain Floating Solar Panels Market Revenue (Million) Forecast, by Application 2019 & 2032
- Table 28: Spain Floating Solar Panels Market Volume (K Tons) Forecast, by Application 2019 & 2032
- Table 29: Belgium Floating Solar Panels Market Revenue (Million) Forecast, by Application 2019 & 2032
- Table 30: Belgium Floating Solar Panels Market Volume (K Tons) Forecast, by Application 2019 & 2032
- Table 31: Netherland Floating Solar Panels Market Revenue (Million) Forecast, by Application 2019 & 2032
- Table 32: Netherland Floating Solar Panels Market Volume (K Tons) Forecast, by Application 2019 & 2032
- Table 33: Nordics Floating Solar Panels Market Revenue (Million) Forecast, by Application 2019 & 2032
- Table 34: Nordics Floating Solar Panels Market Volume (K Tons) Forecast, by Application 2019 & 2032
- Table 35: Rest of Europe Floating Solar Panels Market Revenue (Million) Forecast, by Application 2019 & 2032
- Table 36: Rest of Europe Floating Solar Panels Market Volume (K Tons) Forecast, by Application 2019 & 2032
- Table 37: Global Floating Solar Panels Market Revenue Million Forecast, by Country 2019 & 2032
- Table 38: Global Floating Solar Panels Market Volume K Tons Forecast, by Country 2019 & 2032
- Table 39: China Floating Solar Panels Market Revenue (Million) Forecast, by Application 2019 & 2032
- Table 40: China Floating Solar Panels Market Volume (K Tons) Forecast, by Application 2019 & 2032
- Table 41: Japan Floating Solar Panels Market Revenue (Million) Forecast, by Application 2019 & 2032
- Table 42: Japan Floating Solar Panels Market Volume (K Tons) Forecast, by Application 2019 & 2032
- Table 43: India Floating Solar Panels Market Revenue (Million) Forecast, by Application 2019 & 2032
- Table 44: India Floating Solar Panels Market Volume (K Tons) Forecast, by Application 2019 & 2032
- Table 45: South Korea Floating Solar Panels Market Revenue (Million) Forecast, by Application 2019 & 2032
- Table 46: South Korea Floating Solar Panels Market Volume (K Tons) Forecast, by Application 2019 & 2032
- Table 47: Southeast Asia Floating Solar Panels Market Revenue (Million) Forecast, by Application 2019 & 2032
- Table 48: Southeast Asia Floating Solar Panels Market Volume (K Tons) Forecast, by Application 2019 & 2032
- Table 49: Australia Floating Solar Panels Market Revenue (Million) Forecast, by Application 2019 & 2032
- Table 50: Australia Floating Solar Panels Market Volume (K Tons) Forecast, by Application 2019 & 2032
- Table 51: Indonesia Floating Solar Panels Market Revenue (Million) Forecast, by Application 2019 & 2032
- Table 52: Indonesia Floating Solar Panels Market Volume (K Tons) Forecast, by Application 2019 & 2032
- Table 53: Phillipes Floating Solar Panels Market Revenue (Million) Forecast, by Application 2019 & 2032
- Table 54: Phillipes Floating Solar Panels Market Volume (K Tons) Forecast, by Application 2019 & 2032
- Table 55: Singapore Floating Solar Panels Market Revenue (Million) Forecast, by Application 2019 & 2032
- Table 56: Singapore Floating Solar Panels Market Volume (K Tons) Forecast, by Application 2019 & 2032
- Table 57: Thailandc Floating Solar Panels Market Revenue (Million) Forecast, by Application 2019 & 2032
- Table 58: Thailandc Floating Solar Panels Market Volume (K Tons) Forecast, by Application 2019 & 2032
- Table 59: Rest of Asia Pacific Floating Solar Panels Market Revenue (Million) Forecast, by Application 2019 & 2032
- Table 60: Rest of Asia Pacific Floating Solar Panels Market Volume (K Tons) Forecast, by Application 2019 & 2032
- Table 61: Global Floating Solar Panels Market Revenue Million Forecast, by Country 2019 & 2032
- Table 62: Global Floating Solar Panels Market Volume K Tons Forecast, by Country 2019 & 2032
- Table 63: Brazil Floating Solar Panels Market Revenue (Million) Forecast, by Application 2019 & 2032
- Table 64: Brazil Floating Solar Panels Market Volume (K Tons) Forecast, by Application 2019 & 2032
- Table 65: Argentina Floating Solar Panels Market Revenue (Million) Forecast, by Application 2019 & 2032
- Table 66: Argentina Floating Solar Panels Market Volume (K Tons) Forecast, by Application 2019 & 2032
- Table 67: Peru Floating Solar Panels Market Revenue (Million) Forecast, by Application 2019 & 2032
- Table 68: Peru Floating Solar Panels Market Volume (K Tons) Forecast, by Application 2019 & 2032
- Table 69: Chile Floating Solar Panels Market Revenue (Million) Forecast, by Application 2019 & 2032
- Table 70: Chile Floating Solar Panels Market Volume (K Tons) Forecast, by Application 2019 & 2032
- Table 71: Colombia Floating Solar Panels Market Revenue (Million) Forecast, by Application 2019 & 2032
- Table 72: Colombia Floating Solar Panels Market Volume (K Tons) Forecast, by Application 2019 & 2032
- Table 73: Ecuador Floating Solar Panels Market Revenue (Million) Forecast, by Application 2019 & 2032
- Table 74: Ecuador Floating Solar Panels Market Volume (K Tons) Forecast, by Application 2019 & 2032
- Table 75: Venezuela Floating Solar Panels Market Revenue (Million) Forecast, by Application 2019 & 2032
- Table 76: Venezuela Floating Solar Panels Market Volume (K Tons) Forecast, by Application 2019 & 2032
- Table 77: Rest of South America Floating Solar Panels Market Revenue (Million) Forecast, by Application 2019 & 2032
- Table 78: Rest of South America Floating Solar Panels Market Volume (K Tons) Forecast, by Application 2019 & 2032
- Table 79: Global Floating Solar Panels Market Revenue Million Forecast, by Country 2019 & 2032
- Table 80: Global Floating Solar Panels Market Volume K Tons Forecast, by Country 2019 & 2032
- Table 81: United States Floating Solar Panels Market Revenue (Million) Forecast, by Application 2019 & 2032
- Table 82: United States Floating Solar Panels Market Volume (K Tons) Forecast, by Application 2019 & 2032
- Table 83: Canada Floating Solar Panels Market Revenue (Million) Forecast, by Application 2019 & 2032
- Table 84: Canada Floating Solar Panels Market Volume (K Tons) Forecast, by Application 2019 & 2032
- Table 85: Mexico Floating Solar Panels Market Revenue (Million) Forecast, by Application 2019 & 2032
- Table 86: Mexico Floating Solar Panels Market Volume (K Tons) Forecast, by Application 2019 & 2032
- Table 87: Global Floating Solar Panels Market Revenue Million Forecast, by Country 2019 & 2032
- Table 88: Global Floating Solar Panels Market Volume K Tons Forecast, by Country 2019 & 2032
- Table 89: United Arab Emirates Floating Solar Panels Market Revenue (Million) Forecast, by Application 2019 & 2032
- Table 90: United Arab Emirates Floating Solar Panels Market Volume (K Tons) Forecast, by Application 2019 & 2032
- Table 91: Saudi Arabia Floating Solar Panels Market Revenue (Million) Forecast, by Application 2019 & 2032
- Table 92: Saudi Arabia Floating Solar Panels Market Volume (K Tons) Forecast, by Application 2019 & 2032
- Table 93: South Africa Floating Solar Panels Market Revenue (Million) Forecast, by Application 2019 & 2032
- Table 94: South Africa Floating Solar Panels Market Volume (K Tons) Forecast, by Application 2019 & 2032
- Table 95: Rest of Middle East and Africa Floating Solar Panels Market Revenue (Million) Forecast, by Application 2019 & 2032
- Table 96: Rest of Middle East and Africa Floating Solar Panels Market Volume (K Tons) Forecast, by Application 2019 & 2032
- Table 97: Global Floating Solar Panels Market Revenue Million Forecast, by Source 2019 & 2032
- Table 98: Global Floating Solar Panels Market Volume K Tons Forecast, by Source 2019 & 2032
- Table 99: Global Floating Solar Panels Market Revenue Million Forecast, by Country 2019 & 2032
- Table 100: Global Floating Solar Panels Market Volume K Tons Forecast, by Country 2019 & 2032
- Table 101: Global Floating Solar Panels Market Revenue Million Forecast, by Source 2019 & 2032
- Table 102: Global Floating Solar Panels Market Volume K Tons Forecast, by Source 2019 & 2032
- Table 103: Global Floating Solar Panels Market Revenue Million Forecast, by Country 2019 & 2032
- Table 104: Global Floating Solar Panels Market Volume K Tons Forecast, by Country 2019 & 2032
- Table 105: Global Floating Solar Panels Market Revenue Million Forecast, by Source 2019 & 2032
- Table 106: Global Floating Solar Panels Market Volume K Tons Forecast, by Source 2019 & 2032
- Table 107: Global Floating Solar Panels Market Revenue Million Forecast, by Country 2019 & 2032
- Table 108: Global Floating Solar Panels Market Volume K Tons Forecast, by Country 2019 & 2032
- Table 109: Global Floating Solar Panels Market Revenue Million Forecast, by Source 2019 & 2032
- Table 110: Global Floating Solar Panels Market Volume K Tons Forecast, by Source 2019 & 2032
- Table 111: Global Floating Solar Panels Market Revenue Million Forecast, by Country 2019 & 2032
- Table 112: Global Floating Solar Panels Market Volume K Tons Forecast, by Country 2019 & 2032
- Table 113: Global Floating Solar Panels Market Revenue Million Forecast, by Source 2019 & 2032
- Table 114: Global Floating Solar Panels Market Volume K Tons Forecast, by Source 2019 & 2032
- Table 115: Global Floating Solar Panels Market Revenue Million Forecast, by Country 2019 & 2032
- Table 116: Global Floating Solar Panels Market Volume K Tons Forecast, by Country 2019 & 2032
Frequently Asked Questions
1. What is the projected Compound Annual Growth Rate (CAGR) of the Floating Solar Panels Market?
The projected CAGR is approximately < 9.00%.
2. Which companies are prominent players in the Floating Solar Panels Market?
Key companies in the market include Ciel & Terre international, Siemens AG, Wartsila Oyj Abp, Equinor ASA*List Not Exhaustive, Karadeniz Holding, General Electric Company, Kawasaki Heavy Industries Ltd, SunPower Corporation , First Solar, Inc. , Trina Solar Limited , JA Solar Technology Co., Ltd. , Sunseap Group.
3. What are the main segments of the Floating Solar Panels Market?
The market segments include Source.
4. Can you provide details about the market size?
The market size is estimated to be USD XX Million as of 2022.
5. What are some drivers contributing to market growth?
4.; Growing Uses of Natural Gas in Various Sectors.
6. What are the notable trends driving market growth?
Renewable Segment Expected to Dominate the Market.
7. Are there any restraints impacting market growth?
4.; Volatile Natural Gas Prices.
8. Can you provide examples of recent developments in the market?
2021: SunPower Corporation announces the launch of its Helix™ Floating Solar Power Plant, designed for large-scale water-based solar installations.
9. What pricing options are available for accessing the report?
Pricing options include single-user, multi-user, and enterprise licenses priced at USD 4750, USD 5250, and USD 8750 respectively.
10. Is the market size provided in terms of value or volume?
The market size is provided in terms of value, measured in Million and volume, measured in K Tons.
11. Are there any specific market keywords associated with the report?
Yes, the market keyword associated with the report is "Floating Solar Panels Market," which aids in identifying and referencing the specific market segment covered.
12. How do I determine which pricing option suits my needs best?
The pricing options vary based on user requirements and access needs. Individual users may opt for single-user licenses, while businesses requiring broader access may choose multi-user or enterprise licenses for cost-effective access to the report.
13. Are there any additional resources or data provided in the Floating Solar Panels Market report?
While the report offers comprehensive insights, it's advisable to review the specific contents or supplementary materials provided to ascertain if additional resources or data are available.
14. How can I stay updated on further developments or reports in the Floating Solar Panels Market?
To stay informed about further developments, trends, and reports in the Floating Solar Panels Market, consider subscribing to industry newsletters, following relevant companies and organizations, or regularly checking reputable industry news sources and publications.
Methodology
Step 1 - Identification of Relevant Samples Size from Population Database


Step 2 - Approaches for Defining Global Market Size (Value, Volume* & Price*)

Note*: In applicable scenarios
Step 3 - Data Sources
Primary Research
- Web Analytics
- Survey Reports
- Research Institute
- Latest Research Reports
- Opinion Leaders
Secondary Research
- Annual Reports
- White Paper
- Latest Press Release
- Industry Association
- Paid Database
- Investor Presentations

Step 4 - Data Triangulation
Involves using different sources of information in order to increase the validity of a study
These sources are likely to be stakeholders in a program - participants, other researchers, program staff, other community members, and so on.
Then we put all data in single framework & apply various statistical tools to find out the dynamic on the market.
During the analysis stage, feedback from the stakeholder groups would be compared to determine areas of agreement as well as areas of divergence


