
Key Insights
The flexible OLED market is experiencing robust growth, driven by increasing demand for foldable smartphones, flexible displays in wearables, and advancements in display technology. The market's compound annual growth rate (CAGR) of 39.40% from 2019 to 2024 suggests a significant expansion, projecting continued strong performance through 2033. Key drivers include the rising popularity of foldable devices, the growing adoption of flexible displays in various applications like automotive dashboards and medical devices, and continuous improvements in OLED technology leading to higher resolution, better contrast ratios, and enhanced flexibility. Technological advancements in AMOLED and PMOLED technologies are further fueling market growth, with AMOLED dominating due to its superior performance characteristics. The segmentation by application reveals that mobiles and tablets currently hold the largest market share, although the wearables and other applications segments are showing the fastest growth rates, driven by innovation in smartwatches, e-readers, and other emerging flexible display applications. While manufacturing complexities and relatively high production costs present some restraints, ongoing technological innovation and economies of scale are mitigating these challenges. Major players like Samsung, LG Display, BOE Technology, and Universal Display Corporation are actively investing in research and development to maintain their competitive edge, further fueling market expansion.
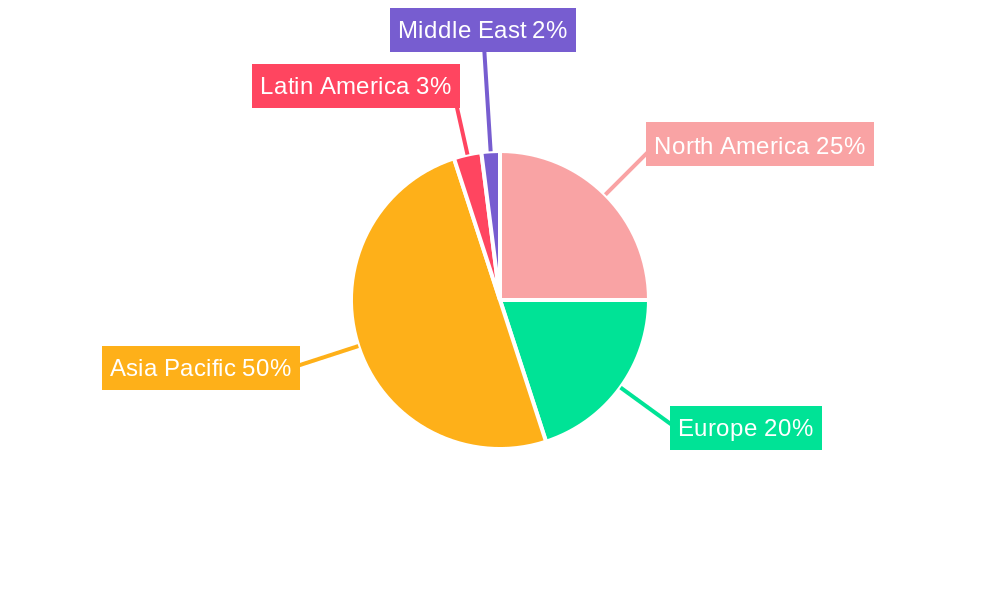
Geographic analysis reveals a significant concentration of market share in the Asia-Pacific region, driven by high consumer demand and a strong manufacturing base. North America and Europe represent substantial markets as well, with increasing demand for high-quality flexible displays across consumer electronics and other industries. The forecast period (2025-2033) anticipates continued expansion, with the market likely exceeding several billion dollars by 2033. The market is expected to continue to consolidate, with larger players acquiring smaller companies and increasing their market share. Future growth will hinge on technological innovation, the development of cost-effective manufacturing processes, and the expansion of applications beyond consumer electronics. The rising adoption of foldable and rollable displays across diverse applications will remain a major driver for this sustained growth.
Flexible OLED Industry Market Report: 2019-2033
This comprehensive report provides an in-depth analysis of the Flexible OLED industry, encompassing market dynamics, growth trends, regional dominance, product landscapes, key players, and future outlook. The report covers the period 2019-2033, with a focus on the base year 2025 and forecast period 2025-2033. This analysis will be invaluable for industry professionals, investors, and strategic decision-makers seeking to navigate this rapidly evolving sector. The parent market is the broader display market, and the child market is flexible displays, specifically focusing on OLED technology.
Flexible OLED Industry Market Dynamics & Structure
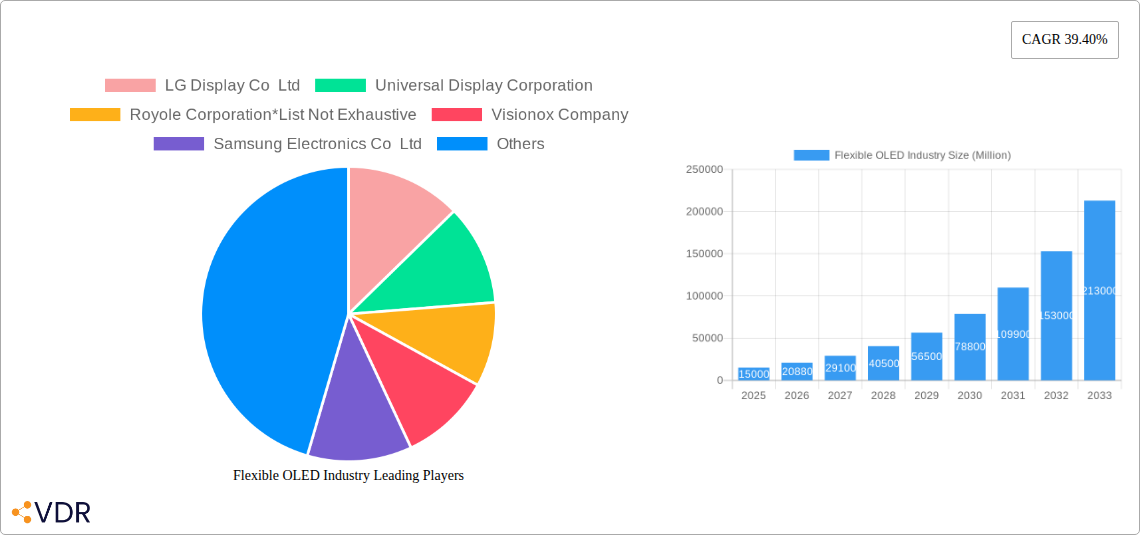
The Flexible OLED market is characterized by moderate concentration, with key players like LG Display, Samsung, and BOE Technology holding significant market share. However, the emergence of companies like Visionox and Royole Corporation signifies increasing competition. Technological innovation, particularly in areas like AMOLED and PMOLED technologies, is a crucial driver. Regulatory frameworks regarding materials and manufacturing processes influence market dynamics. Competitive substitutes, such as flexible LCDs, exert pressure, though OLED's superior image quality offers a competitive edge. End-user demographics skew towards tech-savvy consumers and industries requiring high-quality displays. M&A activity within the sector has been moderate, with xx deals recorded between 2019-2024, representing a xx% increase compared to the previous period.
- Market Concentration: Moderately concentrated, with top 5 players holding approximately xx% market share in 2024.
- Technological Innovation: Focus on improving efficiency, flexibility, and resolution in AMOLED and PMOLED technologies.
- Regulatory Landscape: Stringent environmental regulations impacting material sourcing and manufacturing processes.
- Competitive Substitutes: Flexible LCDs remain a competitive alternative, though OLED's superior quality provides a differentiation.
- End-User Demographics: Primarily driven by consumers in high-income countries and industries demanding high-quality displays.
- M&A Trends: xx deals completed between 2019 and 2024, with an average deal size of xx Million USD.
Flexible OLED Industry Growth Trends & Insights
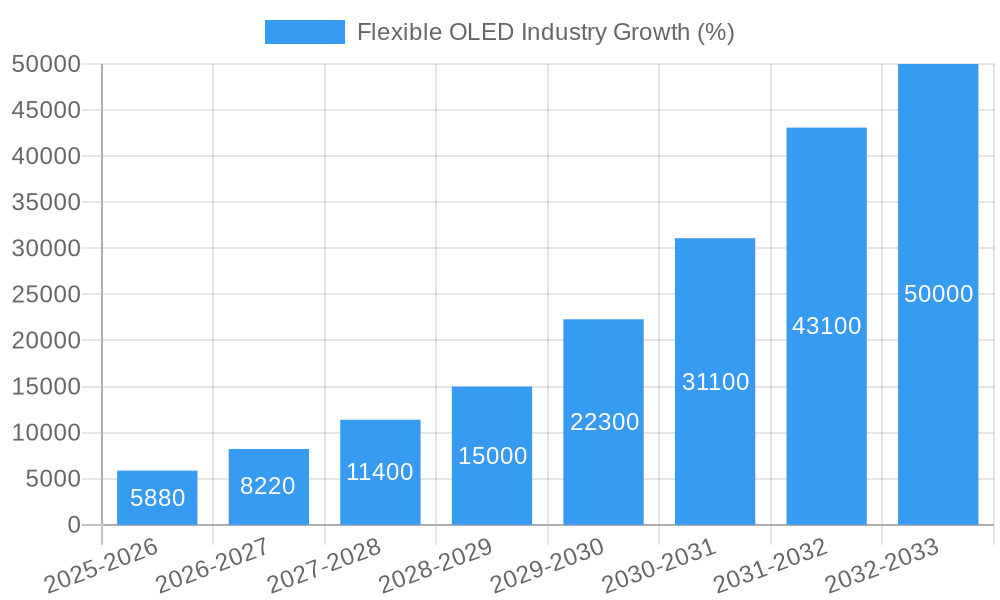
The Flexible OLED market exhibits strong growth, driven by increasing demand for high-quality, flexible displays across various applications. The market size reached xx Million units in 2024 and is projected to reach xx Million units by 2033, exhibiting a CAGR of xx% during the forecast period (2025-2033). Technological disruptions, such as the introduction of Hybrid-TFT technology by Visionox, are significantly impacting adoption rates. Consumer behavior shifts towards foldable smartphones and flexible displays in wearable technology further fuel market growth. Market penetration in the smartphone segment is expected to reach xx% by 2033.
Dominant Regions, Countries, or Segments in Flexible OLED Industry
Asia, particularly South Korea, China, and Taiwan, dominates the Flexible OLED market, driven by a robust manufacturing base, substantial investments in R&D, and strong consumer demand. Within the technology segments, AMOLED holds a significantly larger market share (xx%) compared to PMOLED (xx%). The mobile and tablet segment accounts for the largest application share (xx%), followed by wearable devices (xx%) and monitors and TVs (xx%).
Key Drivers:
- Asia's dominance: Strong manufacturing capabilities, significant investments in R&D, high consumer demand, and supportive government policies.
- AMOLED Technology: Superior image quality, higher efficiency, and suitability for flexible applications.
- Mobile and Tablet Segment: High growth trajectory driven by the increasing demand for foldable smartphones and tablets.
Dominance Factors:
- Manufacturing Hubs: Significant presence of manufacturing facilities in South Korea, China, and Taiwan.
- Technological Advancement: Continuous innovation in AMOLED and related technologies fuels market leadership.
- Market Share: South Korea holds the largest market share, followed by China and Taiwan.
Flexible OLED Industry Product Landscape
Flexible OLED displays are characterized by their thin, lightweight, and flexible nature, enabling seamless integration into various devices. AMOLED and PMOLED technologies offer varying resolutions, color gamut, and power consumption levels, catering to diverse application needs. Key performance metrics include pixel density, response time, brightness, and power efficiency. Unique selling propositions include superior picture quality, energy efficiency, and design flexibility, setting them apart from traditional displays. Recent advancements focus on enhancing brightness and reducing power consumption.
Key Drivers, Barriers & Challenges in Flexible OLED Industry
Key Drivers:
- Increasing demand for high-quality, flexible displays in smartphones, wearables, and other applications.
- Technological advancements in AMOLED and PMOLED technologies improving efficiency and cost-effectiveness.
- Government support and incentives for the development of flexible display technologies.
Key Challenges:
- High production costs associated with manufacturing flexible OLED displays. The impact on profitability is estimated at xx% reduction.
- Supply chain vulnerabilities impacting the availability of raw materials and components.
- Stringent environmental regulations increasing manufacturing complexities.
Emerging Opportunities in Flexible OLED Industry
Emerging opportunities exist in expanding into new applications, such as automotive displays, augmented reality (AR) and virtual reality (VR) headsets, and large-format displays for entertainment. Untapped markets in developing economies with rising disposable income present significant growth potential. Consumer preference for foldable and rollable displays continues to drive innovation and create new market segments.
Growth Accelerators in the Flexible OLED Industry
Technological advancements, including improvements in material science, manufacturing processes, and energy efficiency, are major growth catalysts. Strategic partnerships between display manufacturers and device manufacturers accelerate market adoption. Expansion into new applications and geographic markets will further propel growth.
Key Players Shaping the Flexible OLED Industry Market
- LG Display Co Ltd
- Universal Display Corporation
- Royole Corporation
- Visionox Company
- Samsung Electronics Co Ltd
- BOE Technology UK Limited
- Ritdisplay Corporation
- AUO Corporation
- WiseChip Semiconductor Inc
Notable Milestones in Flexible OLED Industry Sector
- June 2022: LG Display launches upgraded G2 and C2 OLED televisions with improved brightness and clarity, introducing new screen sizes.
- February 2022: Visionox releases China's first 1Hz low-power AMOLED display using Hybrid-TFT technology, significantly reducing power consumption.
In-Depth Flexible OLED Industry Market Outlook
The future of the Flexible OLED market is bright, with significant growth potential driven by technological innovation, increasing consumer demand, and expansion into new applications. Strategic partnerships and investments in R&D will further shape the market landscape. The market is poised for continued expansion, particularly in the mobile, wearable, and automotive sectors, presenting lucrative opportunities for companies in the value chain.
Flexible OLED Industry Segmentation
-
1. Technology
- 1.1. AMOLED
- 1.2. PMOLED
-
2. Application
- 2.1. Mobiles and Tablets
- 2.2. Monitors and TVs
- 2.3. Wearables
- 2.4. Other Applications
Flexible OLED Industry Segmentation By Geography
- 1. North America
- 2. Europe
- 3. Asia Pacific
- 4. Latin America
- 5. Middle East
Flexible OLED Industry REPORT HIGHLIGHTS
| Aspects | Details |
|---|---|
| Study Period | 2019-2033 |
| Base Year | 2024 |
| Estimated Year | 2025 |
| Forecast Period | 2025-2033 |
| Historical Period | 2019-2024 |
| Growth Rate | CAGR of 39.40% from 2019-2033 |
| Segmentation |
|
Table of Contents
- 1. Introduction
- 1.1. Research Scope
- 1.2. Market Segmentation
- 1.3. Research Methodology
- 1.4. Definitions and Assumptions
- 2. Executive Summary
- 2.1. Introduction
- 3. Market Dynamics
- 3.1. Introduction
- 3.2. Market Drivers
- 3.2.1. Increasing Demand for OLED in Smartphone Panels; Technological Advancements in Display Market
- 3.3. Market Restrains
- 3.3.1. ; Competition with Existing Display Technologies
- 3.4. Market Trends
- 3.4.1. Mobiles and Televisions to Witness Significant Growth
- 4. Market Factor Analysis
- 4.1. Porters Five Forces
- 4.2. Supply/Value Chain
- 4.3. PESTEL analysis
- 4.4. Market Entropy
- 4.5. Patent/Trademark Analysis
- 5. Global Flexible OLED Industry Analysis, Insights and Forecast, 2019-2031
- 5.1. Market Analysis, Insights and Forecast - by Technology
- 5.1.1. AMOLED
- 5.1.2. PMOLED
- 5.2. Market Analysis, Insights and Forecast - by Application
- 5.2.1. Mobiles and Tablets
- 5.2.2. Monitors and TVs
- 5.2.3. Wearables
- 5.2.4. Other Applications
- 5.3. Market Analysis, Insights and Forecast - by Region
- 5.3.1. North America
- 5.3.2. Europe
- 5.3.3. Asia Pacific
- 5.3.4. Latin America
- 5.3.5. Middle East
- 5.1. Market Analysis, Insights and Forecast - by Technology
- 6. North America Flexible OLED Industry Analysis, Insights and Forecast, 2019-2031
- 6.1. Market Analysis, Insights and Forecast - by Technology
- 6.1.1. AMOLED
- 6.1.2. PMOLED
- 6.2. Market Analysis, Insights and Forecast - by Application
- 6.2.1. Mobiles and Tablets
- 6.2.2. Monitors and TVs
- 6.2.3. Wearables
- 6.2.4. Other Applications
- 6.1. Market Analysis, Insights and Forecast - by Technology
- 7. Europe Flexible OLED Industry Analysis, Insights and Forecast, 2019-2031
- 7.1. Market Analysis, Insights and Forecast - by Technology
- 7.1.1. AMOLED
- 7.1.2. PMOLED
- 7.2. Market Analysis, Insights and Forecast - by Application
- 7.2.1. Mobiles and Tablets
- 7.2.2. Monitors and TVs
- 7.2.3. Wearables
- 7.2.4. Other Applications
- 7.1. Market Analysis, Insights and Forecast - by Technology
- 8. Asia Pacific Flexible OLED Industry Analysis, Insights and Forecast, 2019-2031
- 8.1. Market Analysis, Insights and Forecast - by Technology
- 8.1.1. AMOLED
- 8.1.2. PMOLED
- 8.2. Market Analysis, Insights and Forecast - by Application
- 8.2.1. Mobiles and Tablets
- 8.2.2. Monitors and TVs
- 8.2.3. Wearables
- 8.2.4. Other Applications
- 8.1. Market Analysis, Insights and Forecast - by Technology
- 9. Latin America Flexible OLED Industry Analysis, Insights and Forecast, 2019-2031
- 9.1. Market Analysis, Insights and Forecast - by Technology
- 9.1.1. AMOLED
- 9.1.2. PMOLED
- 9.2. Market Analysis, Insights and Forecast - by Application
- 9.2.1. Mobiles and Tablets
- 9.2.2. Monitors and TVs
- 9.2.3. Wearables
- 9.2.4. Other Applications
- 9.1. Market Analysis, Insights and Forecast - by Technology
- 10. Middle East Flexible OLED Industry Analysis, Insights and Forecast, 2019-2031
- 10.1. Market Analysis, Insights and Forecast - by Technology
- 10.1.1. AMOLED
- 10.1.2. PMOLED
- 10.2. Market Analysis, Insights and Forecast - by Application
- 10.2.1. Mobiles and Tablets
- 10.2.2. Monitors and TVs
- 10.2.3. Wearables
- 10.2.4. Other Applications
- 10.1. Market Analysis, Insights and Forecast - by Technology
- 11. North America Flexible OLED Industry Analysis, Insights and Forecast, 2019-2031
- 11.1. Market Analysis, Insights and Forecast - By Country/Sub-region
- 11.1.1.
- 12. Europe Flexible OLED Industry Analysis, Insights and Forecast, 2019-2031
- 12.1. Market Analysis, Insights and Forecast - By Country/Sub-region
- 12.1.1.
- 13. Asia Pacific Flexible OLED Industry Analysis, Insights and Forecast, 2019-2031
- 13.1. Market Analysis, Insights and Forecast - By Country/Sub-region
- 13.1.1.
- 14. Latin America Flexible OLED Industry Analysis, Insights and Forecast, 2019-2031
- 14.1. Market Analysis, Insights and Forecast - By Country/Sub-region
- 14.1.1.
- 15. Middle East Flexible OLED Industry Analysis, Insights and Forecast, 2019-2031
- 15.1. Market Analysis, Insights and Forecast - By Country/Sub-region
- 15.1.1.
- 16. Competitive Analysis
- 16.1. Global Market Share Analysis 2024
- 16.2. Company Profiles
- 16.2.1 LG Display Co Ltd
- 16.2.1.1. Overview
- 16.2.1.2. Products
- 16.2.1.3. SWOT Analysis
- 16.2.1.4. Recent Developments
- 16.2.1.5. Financials (Based on Availability)
- 16.2.2 Universal Display Corporation
- 16.2.2.1. Overview
- 16.2.2.2. Products
- 16.2.2.3. SWOT Analysis
- 16.2.2.4. Recent Developments
- 16.2.2.5. Financials (Based on Availability)
- 16.2.3 Royole Corporation*List Not Exhaustive
- 16.2.3.1. Overview
- 16.2.3.2. Products
- 16.2.3.3. SWOT Analysis
- 16.2.3.4. Recent Developments
- 16.2.3.5. Financials (Based on Availability)
- 16.2.4 Visionox Company
- 16.2.4.1. Overview
- 16.2.4.2. Products
- 16.2.4.3. SWOT Analysis
- 16.2.4.4. Recent Developments
- 16.2.4.5. Financials (Based on Availability)
- 16.2.5 Samsung Electronics Co Ltd
- 16.2.5.1. Overview
- 16.2.5.2. Products
- 16.2.5.3. SWOT Analysis
- 16.2.5.4. Recent Developments
- 16.2.5.5. Financials (Based on Availability)
- 16.2.6 BOE Technology UK Limited
- 16.2.6.1. Overview
- 16.2.6.2. Products
- 16.2.6.3. SWOT Analysis
- 16.2.6.4. Recent Developments
- 16.2.6.5. Financials (Based on Availability)
- 16.2.7 Ritdisplay Corporation
- 16.2.7.1. Overview
- 16.2.7.2. Products
- 16.2.7.3. SWOT Analysis
- 16.2.7.4. Recent Developments
- 16.2.7.5. Financials (Based on Availability)
- 16.2.8 AUO Corporation
- 16.2.8.1. Overview
- 16.2.8.2. Products
- 16.2.8.3. SWOT Analysis
- 16.2.8.4. Recent Developments
- 16.2.8.5. Financials (Based on Availability)
- 16.2.9 WiseChip Semiconductor Inc
- 16.2.9.1. Overview
- 16.2.9.2. Products
- 16.2.9.3. SWOT Analysis
- 16.2.9.4. Recent Developments
- 16.2.9.5. Financials (Based on Availability)
- 16.2.1 LG Display Co Ltd
List of Figures
- Figure 1: Global Flexible OLED Industry Revenue Breakdown (Million, %) by Region 2024 & 2032
- Figure 2: North America Flexible OLED Industry Revenue (Million), by Country 2024 & 2032
- Figure 3: North America Flexible OLED Industry Revenue Share (%), by Country 2024 & 2032
- Figure 4: Europe Flexible OLED Industry Revenue (Million), by Country 2024 & 2032
- Figure 5: Europe Flexible OLED Industry Revenue Share (%), by Country 2024 & 2032
- Figure 6: Asia Pacific Flexible OLED Industry Revenue (Million), by Country 2024 & 2032
- Figure 7: Asia Pacific Flexible OLED Industry Revenue Share (%), by Country 2024 & 2032
- Figure 8: Latin America Flexible OLED Industry Revenue (Million), by Country 2024 & 2032
- Figure 9: Latin America Flexible OLED Industry Revenue Share (%), by Country 2024 & 2032
- Figure 10: Middle East Flexible OLED Industry Revenue (Million), by Country 2024 & 2032
- Figure 11: Middle East Flexible OLED Industry Revenue Share (%), by Country 2024 & 2032
- Figure 12: North America Flexible OLED Industry Revenue (Million), by Technology 2024 & 2032
- Figure 13: North America Flexible OLED Industry Revenue Share (%), by Technology 2024 & 2032
- Figure 14: North America Flexible OLED Industry Revenue (Million), by Application 2024 & 2032
- Figure 15: North America Flexible OLED Industry Revenue Share (%), by Application 2024 & 2032
- Figure 16: North America Flexible OLED Industry Revenue (Million), by Country 2024 & 2032
- Figure 17: North America Flexible OLED Industry Revenue Share (%), by Country 2024 & 2032
- Figure 18: Europe Flexible OLED Industry Revenue (Million), by Technology 2024 & 2032
- Figure 19: Europe Flexible OLED Industry Revenue Share (%), by Technology 2024 & 2032
- Figure 20: Europe Flexible OLED Industry Revenue (Million), by Application 2024 & 2032
- Figure 21: Europe Flexible OLED Industry Revenue Share (%), by Application 2024 & 2032
- Figure 22: Europe Flexible OLED Industry Revenue (Million), by Country 2024 & 2032
- Figure 23: Europe Flexible OLED Industry Revenue Share (%), by Country 2024 & 2032
- Figure 24: Asia Pacific Flexible OLED Industry Revenue (Million), by Technology 2024 & 2032
- Figure 25: Asia Pacific Flexible OLED Industry Revenue Share (%), by Technology 2024 & 2032
- Figure 26: Asia Pacific Flexible OLED Industry Revenue (Million), by Application 2024 & 2032
- Figure 27: Asia Pacific Flexible OLED Industry Revenue Share (%), by Application 2024 & 2032
- Figure 28: Asia Pacific Flexible OLED Industry Revenue (Million), by Country 2024 & 2032
- Figure 29: Asia Pacific Flexible OLED Industry Revenue Share (%), by Country 2024 & 2032
- Figure 30: Latin America Flexible OLED Industry Revenue (Million), by Technology 2024 & 2032
- Figure 31: Latin America Flexible OLED Industry Revenue Share (%), by Technology 2024 & 2032
- Figure 32: Latin America Flexible OLED Industry Revenue (Million), by Application 2024 & 2032
- Figure 33: Latin America Flexible OLED Industry Revenue Share (%), by Application 2024 & 2032
- Figure 34: Latin America Flexible OLED Industry Revenue (Million), by Country 2024 & 2032
- Figure 35: Latin America Flexible OLED Industry Revenue Share (%), by Country 2024 & 2032
- Figure 36: Middle East Flexible OLED Industry Revenue (Million), by Technology 2024 & 2032
- Figure 37: Middle East Flexible OLED Industry Revenue Share (%), by Technology 2024 & 2032
- Figure 38: Middle East Flexible OLED Industry Revenue (Million), by Application 2024 & 2032
- Figure 39: Middle East Flexible OLED Industry Revenue Share (%), by Application 2024 & 2032
- Figure 40: Middle East Flexible OLED Industry Revenue (Million), by Country 2024 & 2032
- Figure 41: Middle East Flexible OLED Industry Revenue Share (%), by Country 2024 & 2032
List of Tables
- Table 1: Global Flexible OLED Industry Revenue Million Forecast, by Region 2019 & 2032
- Table 2: Global Flexible OLED Industry Revenue Million Forecast, by Technology 2019 & 2032
- Table 3: Global Flexible OLED Industry Revenue Million Forecast, by Application 2019 & 2032
- Table 4: Global Flexible OLED Industry Revenue Million Forecast, by Region 2019 & 2032
- Table 5: Global Flexible OLED Industry Revenue Million Forecast, by Country 2019 & 2032
- Table 6: Flexible OLED Industry Revenue (Million) Forecast, by Application 2019 & 2032
- Table 7: Global Flexible OLED Industry Revenue Million Forecast, by Country 2019 & 2032
- Table 8: Flexible OLED Industry Revenue (Million) Forecast, by Application 2019 & 2032
- Table 9: Global Flexible OLED Industry Revenue Million Forecast, by Country 2019 & 2032
- Table 10: Flexible OLED Industry Revenue (Million) Forecast, by Application 2019 & 2032
- Table 11: Global Flexible OLED Industry Revenue Million Forecast, by Country 2019 & 2032
- Table 12: Flexible OLED Industry Revenue (Million) Forecast, by Application 2019 & 2032
- Table 13: Global Flexible OLED Industry Revenue Million Forecast, by Country 2019 & 2032
- Table 14: Flexible OLED Industry Revenue (Million) Forecast, by Application 2019 & 2032
- Table 15: Global Flexible OLED Industry Revenue Million Forecast, by Technology 2019 & 2032
- Table 16: Global Flexible OLED Industry Revenue Million Forecast, by Application 2019 & 2032
- Table 17: Global Flexible OLED Industry Revenue Million Forecast, by Country 2019 & 2032
- Table 18: Global Flexible OLED Industry Revenue Million Forecast, by Technology 2019 & 2032
- Table 19: Global Flexible OLED Industry Revenue Million Forecast, by Application 2019 & 2032
- Table 20: Global Flexible OLED Industry Revenue Million Forecast, by Country 2019 & 2032
- Table 21: Global Flexible OLED Industry Revenue Million Forecast, by Technology 2019 & 2032
- Table 22: Global Flexible OLED Industry Revenue Million Forecast, by Application 2019 & 2032
- Table 23: Global Flexible OLED Industry Revenue Million Forecast, by Country 2019 & 2032
- Table 24: Global Flexible OLED Industry Revenue Million Forecast, by Technology 2019 & 2032
- Table 25: Global Flexible OLED Industry Revenue Million Forecast, by Application 2019 & 2032
- Table 26: Global Flexible OLED Industry Revenue Million Forecast, by Country 2019 & 2032
- Table 27: Global Flexible OLED Industry Revenue Million Forecast, by Technology 2019 & 2032
- Table 28: Global Flexible OLED Industry Revenue Million Forecast, by Application 2019 & 2032
- Table 29: Global Flexible OLED Industry Revenue Million Forecast, by Country 2019 & 2032
Frequently Asked Questions
1. What is the projected Compound Annual Growth Rate (CAGR) of the Flexible OLED Industry?
The projected CAGR is approximately 39.40%.
2. Which companies are prominent players in the Flexible OLED Industry?
Key companies in the market include LG Display Co Ltd, Universal Display Corporation, Royole Corporation*List Not Exhaustive, Visionox Company, Samsung Electronics Co Ltd, BOE Technology UK Limited, Ritdisplay Corporation, AUO Corporation, WiseChip Semiconductor Inc.
3. What are the main segments of the Flexible OLED Industry?
The market segments include Technology, Application.
4. Can you provide details about the market size?
The market size is estimated to be USD XX Million as of 2022.
5. What are some drivers contributing to market growth?
Increasing Demand for OLED in Smartphone Panels; Technological Advancements in Display Market.
6. What are the notable trends driving market growth?
Mobiles and Televisions to Witness Significant Growth.
7. Are there any restraints impacting market growth?
; Competition with Existing Display Technologies.
8. Can you provide examples of recent developments in the market?
June 2022 - LG Display creates new markets with cutting-edge OLED solutions. The company launched upgraded versions of G2& C2 televisions. Both versions are making use of upgraded OLED technology to create even better visuals. This technology enables the displays to deliver higher brightness with greater clarity and detail. The new sizes of the G2 series are introduced alongside three other sizes (55", 65", and 77"). The C2 series gets a total of 6 display sizes.
9. What pricing options are available for accessing the report?
Pricing options include single-user, multi-user, and enterprise licenses priced at USD 4750, USD 5250, and USD 8750 respectively.
10. Is the market size provided in terms of value or volume?
The market size is provided in terms of value, measured in Million.
11. Are there any specific market keywords associated with the report?
Yes, the market keyword associated with the report is "Flexible OLED Industry," which aids in identifying and referencing the specific market segment covered.
12. How do I determine which pricing option suits my needs best?
The pricing options vary based on user requirements and access needs. Individual users may opt for single-user licenses, while businesses requiring broader access may choose multi-user or enterprise licenses for cost-effective access to the report.
13. Are there any additional resources or data provided in the Flexible OLED Industry report?
While the report offers comprehensive insights, it's advisable to review the specific contents or supplementary materials provided to ascertain if additional resources or data are available.
14. How can I stay updated on further developments or reports in the Flexible OLED Industry?
To stay informed about further developments, trends, and reports in the Flexible OLED Industry, consider subscribing to industry newsletters, following relevant companies and organizations, or regularly checking reputable industry news sources and publications.
Methodology
Step 1 - Identification of Relevant Samples Size from Population Database


Step 2 - Approaches for Defining Global Market Size (Value, Volume* & Price*)

Note*: In applicable scenarios
Step 3 - Data Sources
Primary Research
- Web Analytics
- Survey Reports
- Research Institute
- Latest Research Reports
- Opinion Leaders
Secondary Research
- Annual Reports
- White Paper
- Latest Press Release
- Industry Association
- Paid Database
- Investor Presentations

Step 4 - Data Triangulation
Involves using different sources of information in order to increase the validity of a study
These sources are likely to be stakeholders in a program - participants, other researchers, program staff, other community members, and so on.
Then we put all data in single framework & apply various statistical tools to find out the dynamic on the market.
During the analysis stage, feedback from the stakeholder groups would be compared to determine areas of agreement as well as areas of divergence


