
Key Insights
The flat antenna market is experiencing robust growth, driven by the increasing demand for high-performance, compact, and lightweight antenna systems across various sectors. The market's Compound Annual Growth Rate (CAGR) of 23.80% from 2019 to 2024 indicates a significant expansion, projected to continue throughout the forecast period (2025-2033). Key drivers include the proliferation of 5G and satellite communication technologies, the rising adoption of advanced materials with improved electromagnetic properties, and the miniaturization trend in electronic devices. The aerospace and defense sectors are major contributors, demanding high-reliability antennas for communication and surveillance applications. The commercial sector, encompassing applications like mobile devices, IoT devices, and broadband communications, further fuels market growth. While some challenges remain, such as the cost associated with advanced materials and manufacturing techniques, the overall market outlook is positive, supported by continuous technological advancements and increasing investment in research and development.
The segmentation by application (Aerospace, Defense, Commercial) provides valuable insights into market dynamics. The Aerospace and Defense segments are expected to maintain a substantial market share due to their stringent performance and reliability requirements. However, the Commercial segment is poised for rapid growth, driven by the increasing penetration of wireless technologies in consumer electronics and the expanding Internet of Things (IoT) market. Geographically, North America and Europe currently hold significant market share, due to the presence of major industry players and advanced technological infrastructure. However, the Asia-Pacific region is anticipated to witness the fastest growth, spurred by rapid industrialization, expanding telecommunications infrastructure, and a rising demand for advanced communication solutions. This dynamic landscape underscores the need for companies to strategically adapt to changing technological advancements and market demands to maintain their competitive edge.
Flat Antenna Industry Market Report: 2019-2033
This comprehensive report provides a detailed analysis of the Flat Antenna industry, encompassing market dynamics, growth trends, regional dominance, product landscape, and key players. The report covers the historical period (2019-2024), base year (2025), and forecast period (2025-2033), offering invaluable insights for industry professionals, investors, and strategic decision-makers. The study focuses on the parent market of antenna technology and the child market of flat antennas, providing a nuanced understanding of market segmentation and growth drivers. Market values are presented in Million units.
Flat Antenna Industry Market Dynamics & Structure
The flat antenna market is characterized by moderate concentration, with several key players holding significant market share, but a growing number of smaller, specialized companies emerging. Technological innovation, driven by advancements in materials science, miniaturization techniques, and improved signal processing, is a key growth driver. Regulatory frameworks, particularly those concerning spectrum allocation and electromagnetic compatibility (EMC), impact market development. Competitive substitutes, such as traditional parabolic antennas, face increasing pressure from the advantages offered by flat antennas in terms of size, weight, and aesthetics. End-user demographics are diverse, spanning aerospace, defense, commercial, and consumer applications, each with specific needs and preferences. Mergers and acquisitions (M&A) activity is moderate, reflecting consolidation and strategic expansion within the sector.
- Market Concentration: Moderately concentrated, with top 5 players holding xx% market share (2025).
- Technological Innovation: Significant advancements in materials (e.g., metamaterials) and signal processing drive miniaturization and performance improvements.
- Regulatory Landscape: Compliance with EMC standards and spectrum allocation regulations influences product development and deployment.
- Competitive Substitutes: Traditional antennas face challenges from flat antenna advantages in size, weight, and cost.
- M&A Activity: xx deals recorded between 2019-2024, driven by strategic expansion and technology acquisition.
- Innovation Barriers: High R&D costs, stringent regulatory compliance, and complexity in achieving optimal performance.
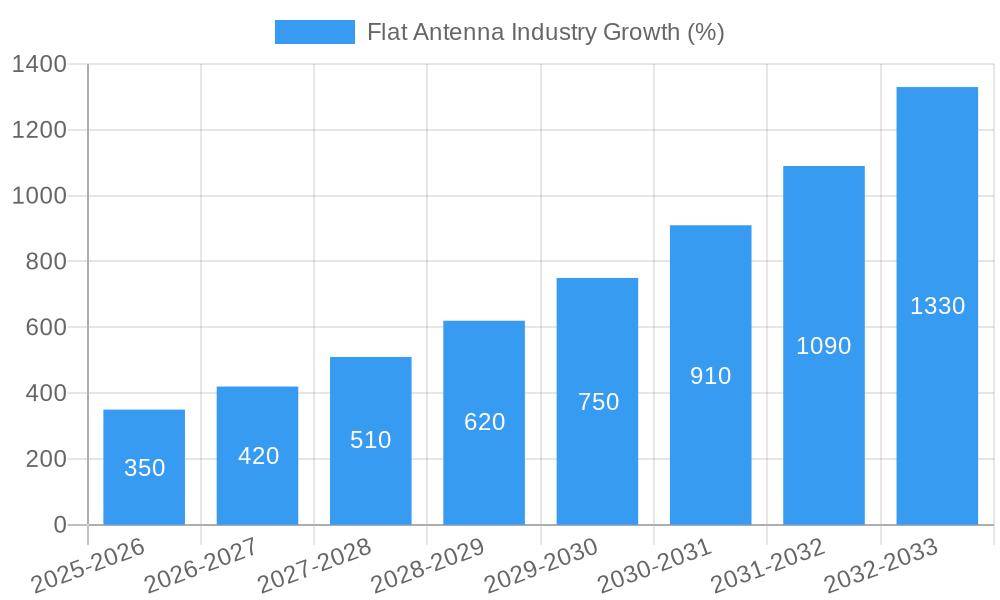
Flat Antenna Industry Growth Trends & Insights
The flat antenna market is experiencing robust growth, driven by increasing demand across diverse sectors. The market size expanded from xx Million units in 2019 to xx Million units in 2024, demonstrating a CAGR of xx%. This growth is attributed to factors such as the rising adoption of 5G technology, the proliferation of IoT devices, and the increasing demand for high-bandwidth communication solutions in various applications. Technological disruptions, such as the development of flexible and conformal antennas, are further shaping market dynamics. Consumer behavior shifts towards smaller, more aesthetically pleasing devices are also contributing to the growth of flat antennas. Market penetration in key application areas, such as aerospace, is expected to increase significantly during the forecast period.
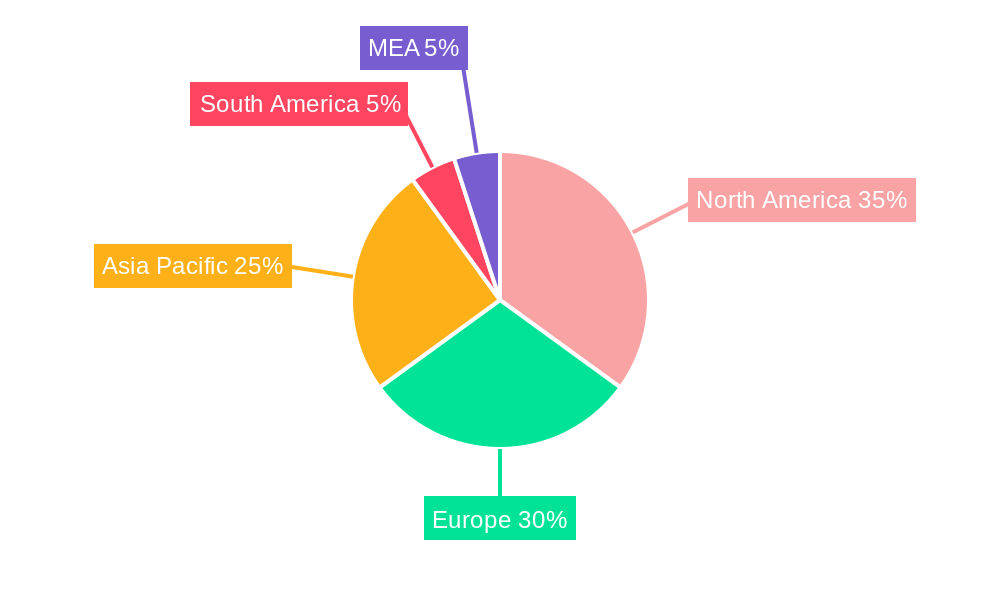
Dominant Regions, Countries, or Segments in Flat Antenna Industry
The Aerospace and Defense segments are currently the dominant drivers of the flat antenna market, followed by the Commercial sector. The North American and European regions hold significant market shares due to strong defense spending and advanced technological capabilities. Asia-Pacific is emerging as a key growth region driven by increased investments in telecommunications infrastructure and the expanding consumer electronics market.
- Key Drivers for Aerospace & Defense: Stringent requirements for lightweight, compact, and high-performance antennas; high defense budgets in North America and Europe.
- Key Drivers for Commercial Segment: Growing demand for high-speed data connectivity in applications such as maritime, satellite communication and broadcasting.
- Regional Dominance: North America and Europe hold leading market share (xx% and xx% respectively in 2025), with Asia-Pacific exhibiting the highest growth potential.
- Market Share Projections (2033): North America (xx%), Europe (xx%), Asia-Pacific (xx%), Rest of World (xx%).
Flat Antenna Industry Product Landscape
Flat antennas are characterized by their compact design and advanced functionalities, such as electronically steerable beams, multiple frequency bands, and high-gain performance. These features address the growing need for efficient and reliable communication in various applications. Recent innovations include flexible, conformal designs that conform to curved surfaces and improve integration into various devices. The market offers a range of products based on different technologies, including microstrip antennas, patch antennas, and metamaterial-based antennas. Unique selling propositions (USPs) frequently include size, weight, and power (SWaP) advantages, improved signal quality, and multi-band capabilities.
Key Drivers, Barriers & Challenges in Flat Antenna Industry
Key Drivers:
- Increasing demand for high-bandwidth communication across diverse sectors (5G, IoT).
- Advancements in materials science and signal processing technologies.
- Growing adoption of satellite communication, particularly LEO constellations.
Key Challenges & Restraints:
- High R&D costs associated with developing advanced antenna technologies.
- Stringent regulatory compliance and testing requirements.
- Competition from established antenna manufacturers and emerging technologies.
- Supply chain disruptions impacting the availability of key components (estimated impact: xx% reduction in production in 2024).
Emerging Opportunities in Flat Antenna Industry
- Expanding applications in the Internet of Things (IoT) and smart city initiatives.
- Development of flexible and conformal antennas for wearable devices and integrated systems.
- Increased use in autonomous vehicles for communication and sensor integration.
- Growth in demand for high-performance antennas in the space sector.
Growth Accelerators in the Flat Antenna Industry
Technological breakthroughs in materials, design, and manufacturing processes are significantly accelerating market growth. Strategic partnerships between antenna manufacturers and technology companies are facilitating innovation and expansion into new markets. Government initiatives promoting the adoption of advanced communication technologies and investment in space exploration are also creating lucrative opportunities for the flat antenna industry. Market expansion into emerging economies offers vast potential for future growth.
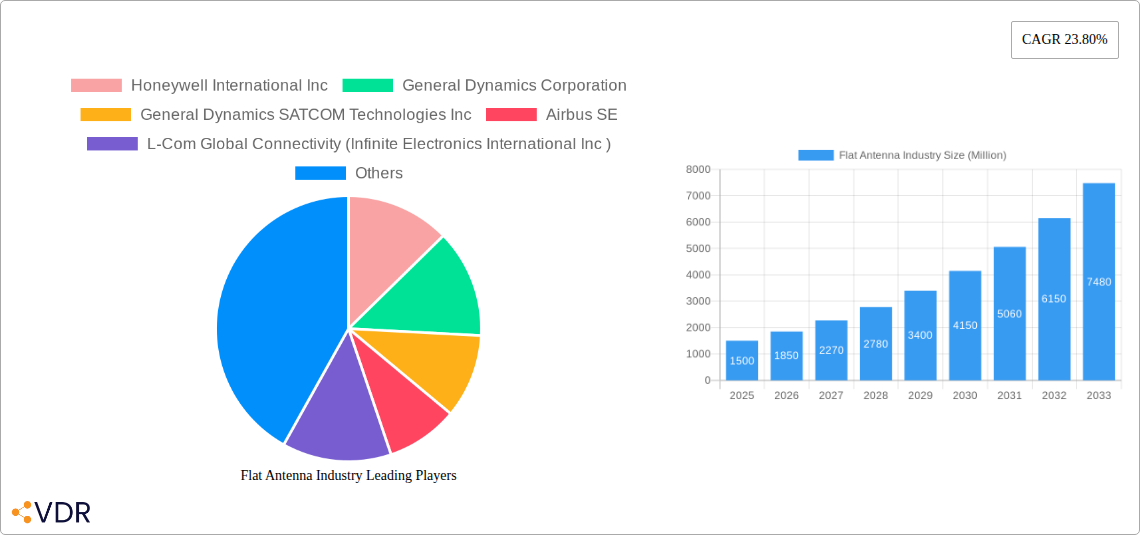
Key Players Shaping the Flat Antenna Industry Market
- Honeywell International Inc
- General Dynamics Corporation
- General Dynamics SATCOM Technologies Inc
- Airbus SE
- L-Com Global Connectivity (Infinite Electronics International Inc)
- Kymeta Corporation
- MacDonald Dettwiler and Associates Ltd
- Mars Antenna & RF Systems Ltd
- Phasor Inc
- Cobham PLC
- L3Harris Technologies
Notable Milestones in Flat Antenna Industry Sector
- November 2021: Isotropic Systems successfully field-tested its flat-panel antenna, demonstrating multi-orbit connectivity for the first time.
- March 2022: Kymeta secured USD 84 million in funding to scale up manufacturing for its flat-panel antennas.
- August 2022: Intellian Technologies launched new t-Series and S-Series antennas for improved live TV on marine vessels.
- August 2022: KP Performance Antennas (Infinite Electronics) unveiled new 5G low-PIM in-building DAS antennas.
In-Depth Flat Antenna Industry Market Outlook
The flat antenna market is poised for sustained growth, driven by ongoing technological advancements and expanding applications across diverse sectors. Future market potential is substantial, particularly in emerging economies and new applications such as autonomous vehicles and advanced satellite communication systems. Strategic opportunities exist for companies focusing on innovation, strategic partnerships, and market expansion into untapped segments. The continued miniaturization and improved performance of flat antennas will further fuel market expansion in the coming years.
Flat Antenna Industry Segmentation
-
1. Application
- 1.1. Aerospace
- 1.2. Defense
- 1.3. Commercial
Flat Antenna Industry Segmentation By Geography
- 1. North America
- 2. Asia Pacific
- 3. Europe
- 4. Rest of the World
Flat Antenna Industry REPORT HIGHLIGHTS
| Aspects | Details |
|---|---|
| Study Period | 2019-2033 |
| Base Year | 2024 |
| Estimated Year | 2025 |
| Forecast Period | 2025-2033 |
| Historical Period | 2019-2024 |
| Growth Rate | CAGR of 23.80% from 2019-2033 |
| Segmentation |
|
Table of Contents
- 1. Introduction
- 1.1. Research Scope
- 1.2. Market Segmentation
- 1.3. Research Methodology
- 1.4. Definitions and Assumptions
- 2. Executive Summary
- 2.1. Introduction
- 3. Market Dynamics
- 3.1. Introduction
- 3.2. Market Drivers
- 3.2.1. Adoption of Unmanned Systems in Defense and Increasing demand for Commercial Aircraft are the Major Driver of the Market; Innovation Leading To Wider Application of Flat Antenna
- 3.3. Market Restrains
- 3.3.1. High Price acts as a Restraint for Wider Application
- 3.4. Market Trends
- 3.4.1. Adoption of Unmanned Systems in Defense and Increasing Demand for Commercial Aircraft
- 4. Market Factor Analysis
- 4.1. Porters Five Forces
- 4.2. Supply/Value Chain
- 4.3. PESTEL analysis
- 4.4. Market Entropy
- 4.5. Patent/Trademark Analysis
- 5. Global Flat Antenna Industry Analysis, Insights and Forecast, 2019-2031
- 5.1. Market Analysis, Insights and Forecast - by Application
- 5.1.1. Aerospace
- 5.1.2. Defense
- 5.1.3. Commercial
- 5.2. Market Analysis, Insights and Forecast - by Region
- 5.2.1. North America
- 5.2.2. Asia Pacific
- 5.2.3. Europe
- 5.2.4. Rest of the World
- 5.1. Market Analysis, Insights and Forecast - by Application
- 6. North America Flat Antenna Industry Analysis, Insights and Forecast, 2019-2031
- 6.1. Market Analysis, Insights and Forecast - by Application
- 6.1.1. Aerospace
- 6.1.2. Defense
- 6.1.3. Commercial
- 6.1. Market Analysis, Insights and Forecast - by Application
- 7. Asia Pacific Flat Antenna Industry Analysis, Insights and Forecast, 2019-2031
- 7.1. Market Analysis, Insights and Forecast - by Application
- 7.1.1. Aerospace
- 7.1.2. Defense
- 7.1.3. Commercial
- 7.1. Market Analysis, Insights and Forecast - by Application
- 8. Europe Flat Antenna Industry Analysis, Insights and Forecast, 2019-2031
- 8.1. Market Analysis, Insights and Forecast - by Application
- 8.1.1. Aerospace
- 8.1.2. Defense
- 8.1.3. Commercial
- 8.1. Market Analysis, Insights and Forecast - by Application
- 9. Rest of the World Flat Antenna Industry Analysis, Insights and Forecast, 2019-2031
- 9.1. Market Analysis, Insights and Forecast - by Application
- 9.1.1. Aerospace
- 9.1.2. Defense
- 9.1.3. Commercial
- 9.1. Market Analysis, Insights and Forecast - by Application
- 10. North America Flat Antenna Industry Analysis, Insights and Forecast, 2019-2031
- 10.1. Market Analysis, Insights and Forecast - By Country/Sub-region
- 10.1.1 United States
- 10.1.2 Canada
- 10.1.3 Mexico
- 11. Europe Flat Antenna Industry Analysis, Insights and Forecast, 2019-2031
- 11.1. Market Analysis, Insights and Forecast - By Country/Sub-region
- 11.1.1 Germany
- 11.1.2 United Kingdom
- 11.1.3 France
- 11.1.4 Spain
- 11.1.5 Italy
- 11.1.6 Spain
- 11.1.7 Belgium
- 11.1.8 Netherland
- 11.1.9 Nordics
- 11.1.10 Rest of Europe
- 12. Asia Pacific Flat Antenna Industry Analysis, Insights and Forecast, 2019-2031
- 12.1. Market Analysis, Insights and Forecast - By Country/Sub-region
- 12.1.1 China
- 12.1.2 Japan
- 12.1.3 India
- 12.1.4 South Korea
- 12.1.5 Southeast Asia
- 12.1.6 Australia
- 12.1.7 Indonesia
- 12.1.8 Phillipes
- 12.1.9 Singapore
- 12.1.10 Thailandc
- 12.1.11 Rest of Asia Pacific
- 13. South America Flat Antenna Industry Analysis, Insights and Forecast, 2019-2031
- 13.1. Market Analysis, Insights and Forecast - By Country/Sub-region
- 13.1.1 Brazil
- 13.1.2 Argentina
- 13.1.3 Peru
- 13.1.4 Chile
- 13.1.5 Colombia
- 13.1.6 Ecuador
- 13.1.7 Venezuela
- 13.1.8 Rest of South America
- 14. North America Flat Antenna Industry Analysis, Insights and Forecast, 2019-2031
- 14.1. Market Analysis, Insights and Forecast - By Country/Sub-region
- 14.1.1 United States
- 14.1.2 Canada
- 14.1.3 Mexico
- 15. MEA Flat Antenna Industry Analysis, Insights and Forecast, 2019-2031
- 15.1. Market Analysis, Insights and Forecast - By Country/Sub-region
- 15.1.1 United Arab Emirates
- 15.1.2 Saudi Arabia
- 15.1.3 South Africa
- 15.1.4 Rest of Middle East and Africa
- 16. Competitive Analysis
- 16.1. Global Market Share Analysis 2024
- 16.2. Company Profiles
- 16.2.1 Honeywell International Inc
- 16.2.1.1. Overview
- 16.2.1.2. Products
- 16.2.1.3. SWOT Analysis
- 16.2.1.4. Recent Developments
- 16.2.1.5. Financials (Based on Availability)
- 16.2.2 General Dynamics Corporation
- 16.2.2.1. Overview
- 16.2.2.2. Products
- 16.2.2.3. SWOT Analysis
- 16.2.2.4. Recent Developments
- 16.2.2.5. Financials (Based on Availability)
- 16.2.3 General Dynamics SATCOM Technologies Inc
- 16.2.3.1. Overview
- 16.2.3.2. Products
- 16.2.3.3. SWOT Analysis
- 16.2.3.4. Recent Developments
- 16.2.3.5. Financials (Based on Availability)
- 16.2.4 Airbus SE
- 16.2.4.1. Overview
- 16.2.4.2. Products
- 16.2.4.3. SWOT Analysis
- 16.2.4.4. Recent Developments
- 16.2.4.5. Financials (Based on Availability)
- 16.2.5 L-Com Global Connectivity (Infinite Electronics International Inc )
- 16.2.5.1. Overview
- 16.2.5.2. Products
- 16.2.5.3. SWOT Analysis
- 16.2.5.4. Recent Developments
- 16.2.5.5. Financials (Based on Availability)
- 16.2.6 Kymeta Corporation
- 16.2.6.1. Overview
- 16.2.6.2. Products
- 16.2.6.3. SWOT Analysis
- 16.2.6.4. Recent Developments
- 16.2.6.5. Financials (Based on Availability)
- 16.2.7 MacDonald Dettwiler and Associates Ltd
- 16.2.7.1. Overview
- 16.2.7.2. Products
- 16.2.7.3. SWOT Analysis
- 16.2.7.4. Recent Developments
- 16.2.7.5. Financials (Based on Availability)
- 16.2.8 Mars Antenna & RF Systems Ltd
- 16.2.8.1. Overview
- 16.2.8.2. Products
- 16.2.8.3. SWOT Analysis
- 16.2.8.4. Recent Developments
- 16.2.8.5. Financials (Based on Availability)
- 16.2.9 Phasor Inc
- 16.2.9.1. Overview
- 16.2.9.2. Products
- 16.2.9.3. SWOT Analysis
- 16.2.9.4. Recent Developments
- 16.2.9.5. Financials (Based on Availability)
- 16.2.10 Cobham PLC
- 16.2.10.1. Overview
- 16.2.10.2. Products
- 16.2.10.3. SWOT Analysis
- 16.2.10.4. Recent Developments
- 16.2.10.5. Financials (Based on Availability)
- 16.2.11 L3Harris Technologies
- 16.2.11.1. Overview
- 16.2.11.2. Products
- 16.2.11.3. SWOT Analysis
- 16.2.11.4. Recent Developments
- 16.2.11.5. Financials (Based on Availability)
- 16.2.1 Honeywell International Inc
List of Figures
- Figure 1: Global Flat Antenna Industry Revenue Breakdown (Million, %) by Region 2024 & 2032
- Figure 2: North America Flat Antenna Industry Revenue (Million), by Country 2024 & 2032
- Figure 3: North America Flat Antenna Industry Revenue Share (%), by Country 2024 & 2032
- Figure 4: Europe Flat Antenna Industry Revenue (Million), by Country 2024 & 2032
- Figure 5: Europe Flat Antenna Industry Revenue Share (%), by Country 2024 & 2032
- Figure 6: Asia Pacific Flat Antenna Industry Revenue (Million), by Country 2024 & 2032
- Figure 7: Asia Pacific Flat Antenna Industry Revenue Share (%), by Country 2024 & 2032
- Figure 8: South America Flat Antenna Industry Revenue (Million), by Country 2024 & 2032
- Figure 9: South America Flat Antenna Industry Revenue Share (%), by Country 2024 & 2032
- Figure 10: North America Flat Antenna Industry Revenue (Million), by Country 2024 & 2032
- Figure 11: North America Flat Antenna Industry Revenue Share (%), by Country 2024 & 2032
- Figure 12: MEA Flat Antenna Industry Revenue (Million), by Country 2024 & 2032
- Figure 13: MEA Flat Antenna Industry Revenue Share (%), by Country 2024 & 2032
- Figure 14: North America Flat Antenna Industry Revenue (Million), by Application 2024 & 2032
- Figure 15: North America Flat Antenna Industry Revenue Share (%), by Application 2024 & 2032
- Figure 16: North America Flat Antenna Industry Revenue (Million), by Country 2024 & 2032
- Figure 17: North America Flat Antenna Industry Revenue Share (%), by Country 2024 & 2032
- Figure 18: Asia Pacific Flat Antenna Industry Revenue (Million), by Application 2024 & 2032
- Figure 19: Asia Pacific Flat Antenna Industry Revenue Share (%), by Application 2024 & 2032
- Figure 20: Asia Pacific Flat Antenna Industry Revenue (Million), by Country 2024 & 2032
- Figure 21: Asia Pacific Flat Antenna Industry Revenue Share (%), by Country 2024 & 2032
- Figure 22: Europe Flat Antenna Industry Revenue (Million), by Application 2024 & 2032
- Figure 23: Europe Flat Antenna Industry Revenue Share (%), by Application 2024 & 2032
- Figure 24: Europe Flat Antenna Industry Revenue (Million), by Country 2024 & 2032
- Figure 25: Europe Flat Antenna Industry Revenue Share (%), by Country 2024 & 2032
- Figure 26: Rest of the World Flat Antenna Industry Revenue (Million), by Application 2024 & 2032
- Figure 27: Rest of the World Flat Antenna Industry Revenue Share (%), by Application 2024 & 2032
- Figure 28: Rest of the World Flat Antenna Industry Revenue (Million), by Country 2024 & 2032
- Figure 29: Rest of the World Flat Antenna Industry Revenue Share (%), by Country 2024 & 2032
List of Tables
- Table 1: Global Flat Antenna Industry Revenue Million Forecast, by Region 2019 & 2032
- Table 2: Global Flat Antenna Industry Revenue Million Forecast, by Application 2019 & 2032
- Table 3: Global Flat Antenna Industry Revenue Million Forecast, by Region 2019 & 2032
- Table 4: Global Flat Antenna Industry Revenue Million Forecast, by Country 2019 & 2032
- Table 5: United States Flat Antenna Industry Revenue (Million) Forecast, by Application 2019 & 2032
- Table 6: Canada Flat Antenna Industry Revenue (Million) Forecast, by Application 2019 & 2032
- Table 7: Mexico Flat Antenna Industry Revenue (Million) Forecast, by Application 2019 & 2032
- Table 8: Global Flat Antenna Industry Revenue Million Forecast, by Country 2019 & 2032
- Table 9: Germany Flat Antenna Industry Revenue (Million) Forecast, by Application 2019 & 2032
- Table 10: United Kingdom Flat Antenna Industry Revenue (Million) Forecast, by Application 2019 & 2032
- Table 11: France Flat Antenna Industry Revenue (Million) Forecast, by Application 2019 & 2032
- Table 12: Spain Flat Antenna Industry Revenue (Million) Forecast, by Application 2019 & 2032
- Table 13: Italy Flat Antenna Industry Revenue (Million) Forecast, by Application 2019 & 2032
- Table 14: Spain Flat Antenna Industry Revenue (Million) Forecast, by Application 2019 & 2032
- Table 15: Belgium Flat Antenna Industry Revenue (Million) Forecast, by Application 2019 & 2032
- Table 16: Netherland Flat Antenna Industry Revenue (Million) Forecast, by Application 2019 & 2032
- Table 17: Nordics Flat Antenna Industry Revenue (Million) Forecast, by Application 2019 & 2032
- Table 18: Rest of Europe Flat Antenna Industry Revenue (Million) Forecast, by Application 2019 & 2032
- Table 19: Global Flat Antenna Industry Revenue Million Forecast, by Country 2019 & 2032
- Table 20: China Flat Antenna Industry Revenue (Million) Forecast, by Application 2019 & 2032
- Table 21: Japan Flat Antenna Industry Revenue (Million) Forecast, by Application 2019 & 2032
- Table 22: India Flat Antenna Industry Revenue (Million) Forecast, by Application 2019 & 2032
- Table 23: South Korea Flat Antenna Industry Revenue (Million) Forecast, by Application 2019 & 2032
- Table 24: Southeast Asia Flat Antenna Industry Revenue (Million) Forecast, by Application 2019 & 2032
- Table 25: Australia Flat Antenna Industry Revenue (Million) Forecast, by Application 2019 & 2032
- Table 26: Indonesia Flat Antenna Industry Revenue (Million) Forecast, by Application 2019 & 2032
- Table 27: Phillipes Flat Antenna Industry Revenue (Million) Forecast, by Application 2019 & 2032
- Table 28: Singapore Flat Antenna Industry Revenue (Million) Forecast, by Application 2019 & 2032
- Table 29: Thailandc Flat Antenna Industry Revenue (Million) Forecast, by Application 2019 & 2032
- Table 30: Rest of Asia Pacific Flat Antenna Industry Revenue (Million) Forecast, by Application 2019 & 2032
- Table 31: Global Flat Antenna Industry Revenue Million Forecast, by Country 2019 & 2032
- Table 32: Brazil Flat Antenna Industry Revenue (Million) Forecast, by Application 2019 & 2032
- Table 33: Argentina Flat Antenna Industry Revenue (Million) Forecast, by Application 2019 & 2032
- Table 34: Peru Flat Antenna Industry Revenue (Million) Forecast, by Application 2019 & 2032
- Table 35: Chile Flat Antenna Industry Revenue (Million) Forecast, by Application 2019 & 2032
- Table 36: Colombia Flat Antenna Industry Revenue (Million) Forecast, by Application 2019 & 2032
- Table 37: Ecuador Flat Antenna Industry Revenue (Million) Forecast, by Application 2019 & 2032
- Table 38: Venezuela Flat Antenna Industry Revenue (Million) Forecast, by Application 2019 & 2032
- Table 39: Rest of South America Flat Antenna Industry Revenue (Million) Forecast, by Application 2019 & 2032
- Table 40: Global Flat Antenna Industry Revenue Million Forecast, by Country 2019 & 2032
- Table 41: United States Flat Antenna Industry Revenue (Million) Forecast, by Application 2019 & 2032
- Table 42: Canada Flat Antenna Industry Revenue (Million) Forecast, by Application 2019 & 2032
- Table 43: Mexico Flat Antenna Industry Revenue (Million) Forecast, by Application 2019 & 2032
- Table 44: Global Flat Antenna Industry Revenue Million Forecast, by Country 2019 & 2032
- Table 45: United Arab Emirates Flat Antenna Industry Revenue (Million) Forecast, by Application 2019 & 2032
- Table 46: Saudi Arabia Flat Antenna Industry Revenue (Million) Forecast, by Application 2019 & 2032
- Table 47: South Africa Flat Antenna Industry Revenue (Million) Forecast, by Application 2019 & 2032
- Table 48: Rest of Middle East and Africa Flat Antenna Industry Revenue (Million) Forecast, by Application 2019 & 2032
- Table 49: Global Flat Antenna Industry Revenue Million Forecast, by Application 2019 & 2032
- Table 50: Global Flat Antenna Industry Revenue Million Forecast, by Country 2019 & 2032
- Table 51: Global Flat Antenna Industry Revenue Million Forecast, by Application 2019 & 2032
- Table 52: Global Flat Antenna Industry Revenue Million Forecast, by Country 2019 & 2032
- Table 53: Global Flat Antenna Industry Revenue Million Forecast, by Application 2019 & 2032
- Table 54: Global Flat Antenna Industry Revenue Million Forecast, by Country 2019 & 2032
- Table 55: Global Flat Antenna Industry Revenue Million Forecast, by Application 2019 & 2032
- Table 56: Global Flat Antenna Industry Revenue Million Forecast, by Country 2019 & 2032
Frequently Asked Questions
1. What is the projected Compound Annual Growth Rate (CAGR) of the Flat Antenna Industry?
The projected CAGR is approximately 23.80%.
2. Which companies are prominent players in the Flat Antenna Industry?
Key companies in the market include Honeywell International Inc, General Dynamics Corporation, General Dynamics SATCOM Technologies Inc, Airbus SE, L-Com Global Connectivity (Infinite Electronics International Inc ), Kymeta Corporation, MacDonald Dettwiler and Associates Ltd, Mars Antenna & RF Systems Ltd, Phasor Inc, Cobham PLC, L3Harris Technologies.
3. What are the main segments of the Flat Antenna Industry?
The market segments include Application.
4. Can you provide details about the market size?
The market size is estimated to be USD XX Million as of 2022.
5. What are some drivers contributing to market growth?
Adoption of Unmanned Systems in Defense and Increasing demand for Commercial Aircraft are the Major Driver of the Market; Innovation Leading To Wider Application of Flat Antenna.
6. What are the notable trends driving market growth?
Adoption of Unmanned Systems in Defense and Increasing Demand for Commercial Aircraft.
7. Are there any restraints impacting market growth?
High Price acts as a Restraint for Wider Application.
8. Can you provide examples of recent developments in the market?
August 2022 - Intellian Technologies, Inc., the world's leading manufacturer of satellite communications technologies and solutions, has unveiled new t-Series and S-Series antennas to improve the live television (TV) quality for passengers onboard marine boats.
9. What pricing options are available for accessing the report?
Pricing options include single-user, multi-user, and enterprise licenses priced at USD 4750, USD 5250, and USD 8750 respectively.
10. Is the market size provided in terms of value or volume?
The market size is provided in terms of value, measured in Million.
11. Are there any specific market keywords associated with the report?
Yes, the market keyword associated with the report is "Flat Antenna Industry," which aids in identifying and referencing the specific market segment covered.
12. How do I determine which pricing option suits my needs best?
The pricing options vary based on user requirements and access needs. Individual users may opt for single-user licenses, while businesses requiring broader access may choose multi-user or enterprise licenses for cost-effective access to the report.
13. Are there any additional resources or data provided in the Flat Antenna Industry report?
While the report offers comprehensive insights, it's advisable to review the specific contents or supplementary materials provided to ascertain if additional resources or data are available.
14. How can I stay updated on further developments or reports in the Flat Antenna Industry?
To stay informed about further developments, trends, and reports in the Flat Antenna Industry, consider subscribing to industry newsletters, following relevant companies and organizations, or regularly checking reputable industry news sources and publications.
Methodology
Step 1 - Identification of Relevant Samples Size from Population Database


Step 2 - Approaches for Defining Global Market Size (Value, Volume* & Price*)

Note*: In applicable scenarios
Step 3 - Data Sources
Primary Research
- Web Analytics
- Survey Reports
- Research Institute
- Latest Research Reports
- Opinion Leaders
Secondary Research
- Annual Reports
- White Paper
- Latest Press Release
- Industry Association
- Paid Database
- Investor Presentations

Step 4 - Data Triangulation
Involves using different sources of information in order to increase the validity of a study
These sources are likely to be stakeholders in a program - participants, other researchers, program staff, other community members, and so on.
Then we put all data in single framework & apply various statistical tools to find out the dynamic on the market.
During the analysis stage, feedback from the stakeholder groups would be compared to determine areas of agreement as well as areas of divergence


