
Key Insights
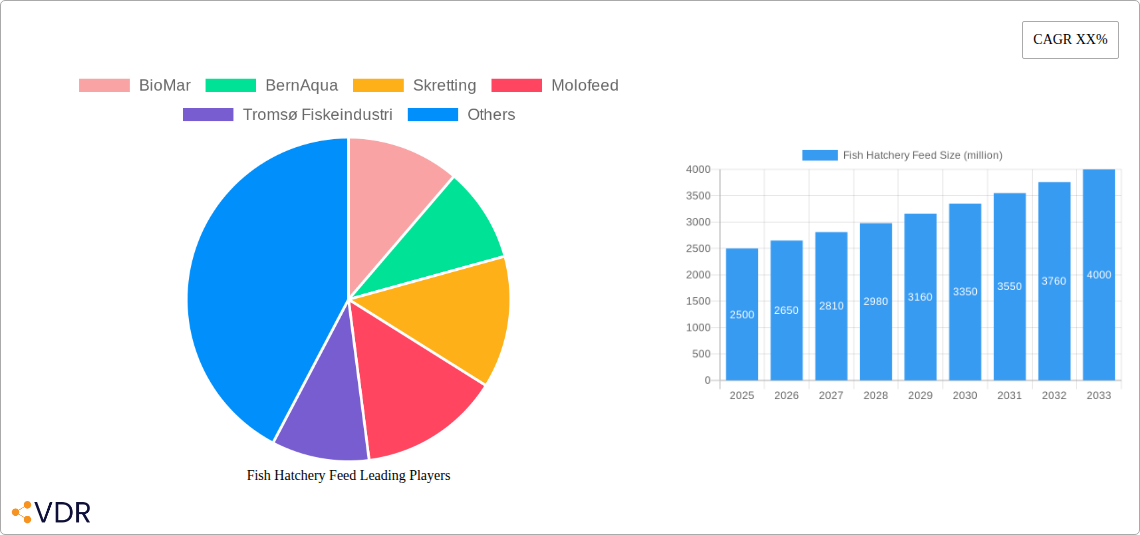
The global fish hatchery feed market is experiencing robust growth, driven by the increasing demand for farmed fish to meet rising global protein needs. The market, estimated at $2.5 billion in 2025, is projected to witness a Compound Annual Growth Rate (CAGR) of 6% from 2025 to 2033, reaching an estimated value of $4.2 billion by 2033. This expansion is fueled by several key factors. Technological advancements in feed formulations are leading to improved fish health, growth rates, and feed efficiency. A growing awareness of sustainable aquaculture practices is further boosting the demand for high-quality, responsibly sourced fish hatchery feeds. The market is segmented by various feed types (e.g., dry, wet, live), species-specific formulations, and geographical regions. Major players like BioMar, Skretting, and Cargill (not explicitly listed but a significant player) dominate the market, leveraging their extensive research and development capabilities and global distribution networks. However, challenges remain, including fluctuations in raw material prices (like fishmeal and fish oil), stringent environmental regulations, and the need for continuous innovation to address evolving disease challenges in aquaculture.
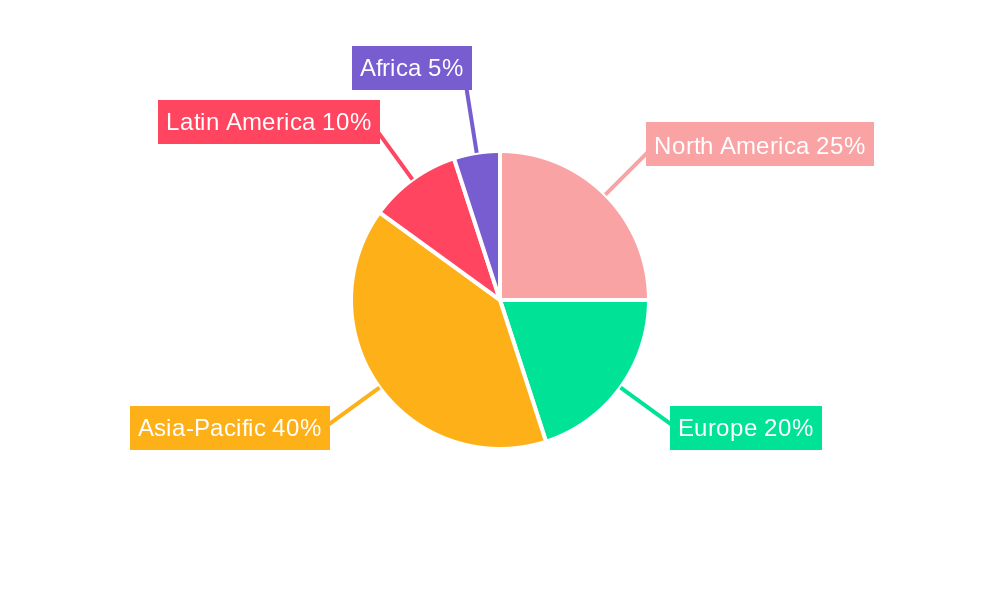
The competitive landscape is characterized by a mix of large multinational corporations and smaller regional players. While larger companies benefit from economies of scale and established distribution channels, smaller companies often focus on niche markets or specialized feed formulations, catering to specific fish species or farming practices. Future growth will likely be influenced by factors such as advancements in precision aquaculture technologies, the development of alternative protein sources to reduce reliance on traditional fishmeal and fish oil, and government policies promoting sustainable aquaculture practices. The Asia-Pacific region is expected to show the highest growth due to its large aquaculture industry and increasing consumer demand. Continued innovation and investment in research and development are crucial for players to maintain their competitive edge and capitalize on the growing opportunities within the fish hatchery feed market.
Fish Hatchery Feed Market Report: 2019-2033 - A Comprehensive Analysis
This comprehensive report provides an in-depth analysis of the Fish Hatchery Feed market from 2019 to 2033, encompassing market dynamics, growth trends, regional dominance, product landscape, key players, and future outlook. The report leverages proprietary data and expert analysis to offer actionable insights for industry professionals, investors, and stakeholders. The study period covers 2019-2033, with a base year of 2025 and a forecast period of 2025-2033. The historical period analyzed is 2019-2024. The market is segmented by various factors (details within the report). The report also considers the parent market of aquaculture feed and the child market of specific fish species within hatcheries.
Fish Hatchery Feed Market Dynamics & Structure
The global Fish Hatchery Feed market, valued at $xx million in 2025, exhibits a moderately concentrated structure. Key players like BioMar, BioMar, BernAqua, Skretting, Molofeed, Tromsø Fiskeindustri, and Great Salt Lake Artemia hold significant market share, with BioMar estimated to hold approximately xx% in 2025. Technological innovation, particularly in feed formulations and delivery systems, is a key driver. Stringent regulatory frameworks concerning feed composition and sustainability significantly impact market dynamics. Competitive pressure from substitute products, including alternative protein sources, is also a major factor. The market sees frequent M&A activity, with an estimated xx M&A deals in the period 2019-2024, driven by consolidation and expansion strategies. End-user demographics, primarily driven by the growth of aquaculture, largely shape market demand.
- Market Concentration: Moderately concentrated, with top 5 players holding xx% of the market share in 2025.
- Technological Innovation: Focus on sustainable and efficient feed formulations, automated feeding systems, and precision aquaculture.
- Regulatory Landscape: Stringent regulations on feed composition, environmental impact, and traceability influence market growth.
- Competitive Substitutes: Alternative protein sources and feed ingredients pose a competitive threat.
- M&A Activity: High level of mergers and acquisitions, driving market consolidation.
- Innovation Barriers: High R&D costs, stringent regulations, and securing sustainable sourcing of raw materials.
Fish Hatchery Feed Growth Trends & Insights
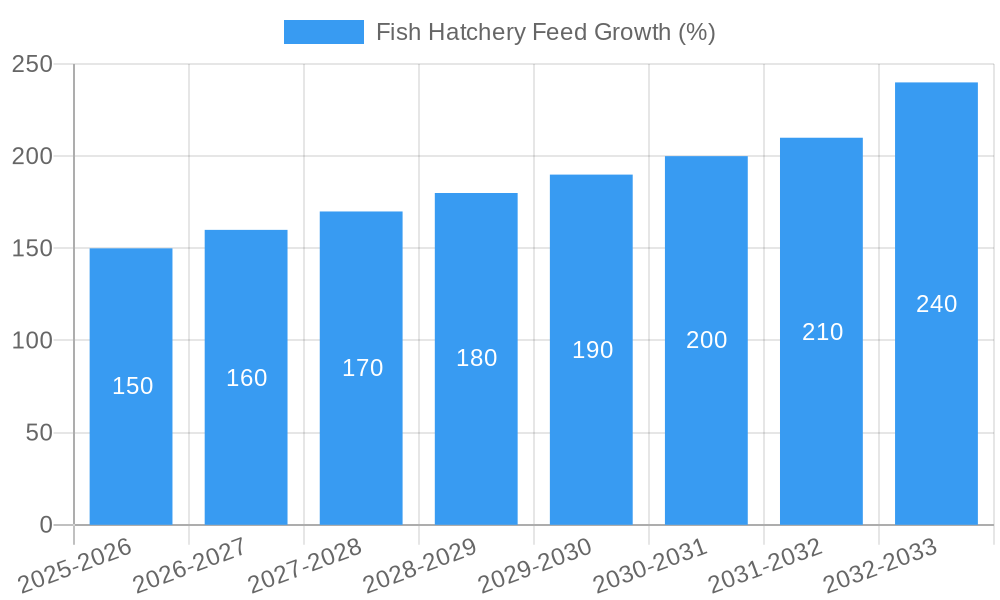
The Fish Hatchery Feed market experienced robust growth during the historical period (2019-2024), with a CAGR of xx%. This growth is primarily attributed to the expanding aquaculture industry, increasing consumer demand for seafood, and technological advancements leading to improved feed efficiency and fish health. Market penetration of advanced feed formulations is steadily increasing, driven by a growing awareness of sustainable aquaculture practices and the need for optimized fish growth. Technological disruptions, such as the adoption of precision feeding systems and data-driven aquaculture management, are accelerating market expansion. Consumer behavior shifts towards healthier and more sustainably produced seafood are creating new opportunities for specialized hatchery feeds. The market is projected to continue its growth trajectory during the forecast period (2025-2033), with a projected CAGR of xx%, reaching $xx million by 2033.
Dominant Regions, Countries, or Segments in Fish Hatchery Feed
The Asia-Pacific region dominates the Fish Hatchery Feed market, accounting for xx% of global market share in 2025. This dominance is primarily attributed to the region's robust aquaculture industry, particularly in China, Vietnam, and India. These countries benefit from supportive government policies promoting aquaculture development, readily available resources, and a burgeoning consumer base. Other key regions such as Europe and North America also showcase significant growth, driven by increasing consumer demand for high-quality seafood and stringent regulations favoring sustainable aquaculture practices.
- Key Drivers in Asia-Pacific:
- Government support for aquaculture
- Large consumer base with increasing disposable income
- Abundant aquaculture resources and suitable climate
- Key Drivers in Europe & North America:
- Growing demand for sustainably produced seafood
- Stringent environmental regulations promoting responsible aquaculture
- High consumer awareness of seafood quality and safety
Fish Hatchery Feed Product Landscape
The Fish Hatchery Feed market offers a diverse range of products catering to various fish species and life stages. Innovations focus on enhancing feed efficiency, improving fish health and welfare, and reducing environmental impact. Formulations include specialized diets optimized for specific nutritional requirements, incorporating novel ingredients like insect meal and single-cell proteins. Performance metrics, such as feed conversion ratio (FCR) and growth rate, are key factors influencing product selection. Unique selling propositions often include enhanced digestibility, improved disease resistance, and reduced environmental footprint.
Key Drivers, Barriers & Challenges in Fish Hatchery Feed
Key Drivers: Growing demand for seafood, expansion of aquaculture, technological advancements in feed formulation, increasing awareness of sustainable aquaculture practices, government support for aquaculture development.
Key Challenges: Fluctuating raw material prices, stringent environmental regulations, competition from alternative protein sources, and maintaining sustainable sourcing of ingredients. The impact of these challenges is estimated to reduce overall market growth by approximately xx% in the forecast period.
Emerging Opportunities in Fish Hatchery Feed
Emerging opportunities include the development of sustainable and innovative feed ingredients, the expansion into untapped markets, the growing interest in recirculating aquaculture systems (RAS), and the increasing demand for traceable and certified sustainable feeds. Opportunities also exist in developing specialized feeds for specific fish species and life stages.
Growth Accelerators in the Fish Hatchery Feed Industry
Technological breakthroughs in feed formulation, precision feeding systems, and data-driven aquaculture management are accelerating market growth. Strategic partnerships between feed manufacturers, aquaculture producers, and research institutions are fostering innovation and market expansion. Expanding into emerging markets with high growth potential is also a key growth strategy.
Key Players Shaping the Fish Hatchery Feed Market
- BioMar
- BernAqua
- Skretting
- Molofeed
- Tromsø Fiskeindustri
- Great Salt Lake Artemia
Notable Milestones in Fish Hatchery Feed Sector
- 2020: Launch of a new sustainable feed formulation by BioMar.
- 2022: Merger between two major feed producers in the Asian market.
- 2023: Introduction of a novel insect-based feed ingredient by a leading supplier. (Further details within the report)
In-Depth Fish Hatchery Feed Market Outlook
The Fish Hatchery Feed market is poised for significant growth in the coming years, driven by a confluence of factors including rising global seafood demand, technological advancements, and increasing focus on sustainable aquaculture practices. Strategic partnerships and investments in research and development will play a crucial role in shaping the market's future. The market presents substantial opportunities for companies with innovative products and sustainable business models.
Fish Hatchery Feed Segmentation
-
1. Application
- 1.1. Goldfish
- 1.2. Koi
- 1.3. Tropical Fish
- 1.4. Others
-
2. Types
- 2.1. Rotifer
- 2.2. Artemia
- 2.3. Others
Fish Hatchery Feed Segmentation By Geography
-
1. North America
- 1.1. United States
- 1.2. Canada
- 1.3. Mexico
-
2. South America
- 2.1. Brazil
- 2.2. Argentina
- 2.3. Rest of South America
-
3. Europe
- 3.1. United Kingdom
- 3.2. Germany
- 3.3. France
- 3.4. Italy
- 3.5. Spain
- 3.6. Russia
- 3.7. Benelux
- 3.8. Nordics
- 3.9. Rest of Europe
-
4. Middle East & Africa
- 4.1. Turkey
- 4.2. Israel
- 4.3. GCC
- 4.4. North Africa
- 4.5. South Africa
- 4.6. Rest of Middle East & Africa
-
5. Asia Pacific
- 5.1. China
- 5.2. India
- 5.3. Japan
- 5.4. South Korea
- 5.5. ASEAN
- 5.6. Oceania
- 5.7. Rest of Asia Pacific
Fish Hatchery Feed REPORT HIGHLIGHTS
| Aspects | Details |
|---|---|
| Study Period | 2019-2033 |
| Base Year | 2024 |
| Estimated Year | 2025 |
| Forecast Period | 2025-2033 |
| Historical Period | 2019-2024 |
| Growth Rate | CAGR of XX% from 2019-2033 |
| Segmentation |
|
Table of Contents
- 1. Introduction
- 1.1. Research Scope
- 1.2. Market Segmentation
- 1.3. Research Methodology
- 1.4. Definitions and Assumptions
- 2. Executive Summary
- 2.1. Introduction
- 3. Market Dynamics
- 3.1. Introduction
- 3.2. Market Drivers
- 3.3. Market Restrains
- 3.4. Market Trends
- 4. Market Factor Analysis
- 4.1. Porters Five Forces
- 4.2. Supply/Value Chain
- 4.3. PESTEL analysis
- 4.4. Market Entropy
- 4.5. Patent/Trademark Analysis
- 5. Global Fish Hatchery Feed Analysis, Insights and Forecast, 2019-2031
- 5.1. Market Analysis, Insights and Forecast - by Application
- 5.1.1. Goldfish
- 5.1.2. Koi
- 5.1.3. Tropical Fish
- 5.1.4. Others
- 5.2. Market Analysis, Insights and Forecast - by Types
- 5.2.1. Rotifer
- 5.2.2. Artemia
- 5.2.3. Others
- 5.3. Market Analysis, Insights and Forecast - by Region
- 5.3.1. North America
- 5.3.2. South America
- 5.3.3. Europe
- 5.3.4. Middle East & Africa
- 5.3.5. Asia Pacific
- 5.1. Market Analysis, Insights and Forecast - by Application
- 6. North America Fish Hatchery Feed Analysis, Insights and Forecast, 2019-2031
- 6.1. Market Analysis, Insights and Forecast - by Application
- 6.1.1. Goldfish
- 6.1.2. Koi
- 6.1.3. Tropical Fish
- 6.1.4. Others
- 6.2. Market Analysis, Insights and Forecast - by Types
- 6.2.1. Rotifer
- 6.2.2. Artemia
- 6.2.3. Others
- 6.1. Market Analysis, Insights and Forecast - by Application
- 7. South America Fish Hatchery Feed Analysis, Insights and Forecast, 2019-2031
- 7.1. Market Analysis, Insights and Forecast - by Application
- 7.1.1. Goldfish
- 7.1.2. Koi
- 7.1.3. Tropical Fish
- 7.1.4. Others
- 7.2. Market Analysis, Insights and Forecast - by Types
- 7.2.1. Rotifer
- 7.2.2. Artemia
- 7.2.3. Others
- 7.1. Market Analysis, Insights and Forecast - by Application
- 8. Europe Fish Hatchery Feed Analysis, Insights and Forecast, 2019-2031
- 8.1. Market Analysis, Insights and Forecast - by Application
- 8.1.1. Goldfish
- 8.1.2. Koi
- 8.1.3. Tropical Fish
- 8.1.4. Others
- 8.2. Market Analysis, Insights and Forecast - by Types
- 8.2.1. Rotifer
- 8.2.2. Artemia
- 8.2.3. Others
- 8.1. Market Analysis, Insights and Forecast - by Application
- 9. Middle East & Africa Fish Hatchery Feed Analysis, Insights and Forecast, 2019-2031
- 9.1. Market Analysis, Insights and Forecast - by Application
- 9.1.1. Goldfish
- 9.1.2. Koi
- 9.1.3. Tropical Fish
- 9.1.4. Others
- 9.2. Market Analysis, Insights and Forecast - by Types
- 9.2.1. Rotifer
- 9.2.2. Artemia
- 9.2.3. Others
- 9.1. Market Analysis, Insights and Forecast - by Application
- 10. Asia Pacific Fish Hatchery Feed Analysis, Insights and Forecast, 2019-2031
- 10.1. Market Analysis, Insights and Forecast - by Application
- 10.1.1. Goldfish
- 10.1.2. Koi
- 10.1.3. Tropical Fish
- 10.1.4. Others
- 10.2. Market Analysis, Insights and Forecast - by Types
- 10.2.1. Rotifer
- 10.2.2. Artemia
- 10.2.3. Others
- 10.1. Market Analysis, Insights and Forecast - by Application
- 11. Competitive Analysis
- 11.1. Global Market Share Analysis 2024
- 11.2. Company Profiles
- 11.2.1 BioMar
- 11.2.1.1. Overview
- 11.2.1.2. Products
- 11.2.1.3. SWOT Analysis
- 11.2.1.4. Recent Developments
- 11.2.1.5. Financials (Based on Availability)
- 11.2.2 BernAqua
- 11.2.2.1. Overview
- 11.2.2.2. Products
- 11.2.2.3. SWOT Analysis
- 11.2.2.4. Recent Developments
- 11.2.2.5. Financials (Based on Availability)
- 11.2.3 Skretting
- 11.2.3.1. Overview
- 11.2.3.2. Products
- 11.2.3.3. SWOT Analysis
- 11.2.3.4. Recent Developments
- 11.2.3.5. Financials (Based on Availability)
- 11.2.4 Molofeed
- 11.2.4.1. Overview
- 11.2.4.2. Products
- 11.2.4.3. SWOT Analysis
- 11.2.4.4. Recent Developments
- 11.2.4.5. Financials (Based on Availability)
- 11.2.5 Tromsø Fiskeindustri
- 11.2.5.1. Overview
- 11.2.5.2. Products
- 11.2.5.3. SWOT Analysis
- 11.2.5.4. Recent Developments
- 11.2.5.5. Financials (Based on Availability)
- 11.2.6 Great Salt Lake Artemia
- 11.2.6.1. Overview
- 11.2.6.2. Products
- 11.2.6.3. SWOT Analysis
- 11.2.6.4. Recent Developments
- 11.2.6.5. Financials (Based on Availability)
- 11.2.1 BioMar
List of Figures
- Figure 1: Global Fish Hatchery Feed Revenue Breakdown (million, %) by Region 2024 & 2032
- Figure 2: Global Fish Hatchery Feed Volume Breakdown (K, %) by Region 2024 & 2032
- Figure 3: North America Fish Hatchery Feed Revenue (million), by Application 2024 & 2032
- Figure 4: North America Fish Hatchery Feed Volume (K), by Application 2024 & 2032
- Figure 5: North America Fish Hatchery Feed Revenue Share (%), by Application 2024 & 2032
- Figure 6: North America Fish Hatchery Feed Volume Share (%), by Application 2024 & 2032
- Figure 7: North America Fish Hatchery Feed Revenue (million), by Types 2024 & 2032
- Figure 8: North America Fish Hatchery Feed Volume (K), by Types 2024 & 2032
- Figure 9: North America Fish Hatchery Feed Revenue Share (%), by Types 2024 & 2032
- Figure 10: North America Fish Hatchery Feed Volume Share (%), by Types 2024 & 2032
- Figure 11: North America Fish Hatchery Feed Revenue (million), by Country 2024 & 2032
- Figure 12: North America Fish Hatchery Feed Volume (K), by Country 2024 & 2032
- Figure 13: North America Fish Hatchery Feed Revenue Share (%), by Country 2024 & 2032
- Figure 14: North America Fish Hatchery Feed Volume Share (%), by Country 2024 & 2032
- Figure 15: South America Fish Hatchery Feed Revenue (million), by Application 2024 & 2032
- Figure 16: South America Fish Hatchery Feed Volume (K), by Application 2024 & 2032
- Figure 17: South America Fish Hatchery Feed Revenue Share (%), by Application 2024 & 2032
- Figure 18: South America Fish Hatchery Feed Volume Share (%), by Application 2024 & 2032
- Figure 19: South America Fish Hatchery Feed Revenue (million), by Types 2024 & 2032
- Figure 20: South America Fish Hatchery Feed Volume (K), by Types 2024 & 2032
- Figure 21: South America Fish Hatchery Feed Revenue Share (%), by Types 2024 & 2032
- Figure 22: South America Fish Hatchery Feed Volume Share (%), by Types 2024 & 2032
- Figure 23: South America Fish Hatchery Feed Revenue (million), by Country 2024 & 2032
- Figure 24: South America Fish Hatchery Feed Volume (K), by Country 2024 & 2032
- Figure 25: South America Fish Hatchery Feed Revenue Share (%), by Country 2024 & 2032
- Figure 26: South America Fish Hatchery Feed Volume Share (%), by Country 2024 & 2032
- Figure 27: Europe Fish Hatchery Feed Revenue (million), by Application 2024 & 2032
- Figure 28: Europe Fish Hatchery Feed Volume (K), by Application 2024 & 2032
- Figure 29: Europe Fish Hatchery Feed Revenue Share (%), by Application 2024 & 2032
- Figure 30: Europe Fish Hatchery Feed Volume Share (%), by Application 2024 & 2032
- Figure 31: Europe Fish Hatchery Feed Revenue (million), by Types 2024 & 2032
- Figure 32: Europe Fish Hatchery Feed Volume (K), by Types 2024 & 2032
- Figure 33: Europe Fish Hatchery Feed Revenue Share (%), by Types 2024 & 2032
- Figure 34: Europe Fish Hatchery Feed Volume Share (%), by Types 2024 & 2032
- Figure 35: Europe Fish Hatchery Feed Revenue (million), by Country 2024 & 2032
- Figure 36: Europe Fish Hatchery Feed Volume (K), by Country 2024 & 2032
- Figure 37: Europe Fish Hatchery Feed Revenue Share (%), by Country 2024 & 2032
- Figure 38: Europe Fish Hatchery Feed Volume Share (%), by Country 2024 & 2032
- Figure 39: Middle East & Africa Fish Hatchery Feed Revenue (million), by Application 2024 & 2032
- Figure 40: Middle East & Africa Fish Hatchery Feed Volume (K), by Application 2024 & 2032
- Figure 41: Middle East & Africa Fish Hatchery Feed Revenue Share (%), by Application 2024 & 2032
- Figure 42: Middle East & Africa Fish Hatchery Feed Volume Share (%), by Application 2024 & 2032
- Figure 43: Middle East & Africa Fish Hatchery Feed Revenue (million), by Types 2024 & 2032
- Figure 44: Middle East & Africa Fish Hatchery Feed Volume (K), by Types 2024 & 2032
- Figure 45: Middle East & Africa Fish Hatchery Feed Revenue Share (%), by Types 2024 & 2032
- Figure 46: Middle East & Africa Fish Hatchery Feed Volume Share (%), by Types 2024 & 2032
- Figure 47: Middle East & Africa Fish Hatchery Feed Revenue (million), by Country 2024 & 2032
- Figure 48: Middle East & Africa Fish Hatchery Feed Volume (K), by Country 2024 & 2032
- Figure 49: Middle East & Africa Fish Hatchery Feed Revenue Share (%), by Country 2024 & 2032
- Figure 50: Middle East & Africa Fish Hatchery Feed Volume Share (%), by Country 2024 & 2032
- Figure 51: Asia Pacific Fish Hatchery Feed Revenue (million), by Application 2024 & 2032
- Figure 52: Asia Pacific Fish Hatchery Feed Volume (K), by Application 2024 & 2032
- Figure 53: Asia Pacific Fish Hatchery Feed Revenue Share (%), by Application 2024 & 2032
- Figure 54: Asia Pacific Fish Hatchery Feed Volume Share (%), by Application 2024 & 2032
- Figure 55: Asia Pacific Fish Hatchery Feed Revenue (million), by Types 2024 & 2032
- Figure 56: Asia Pacific Fish Hatchery Feed Volume (K), by Types 2024 & 2032
- Figure 57: Asia Pacific Fish Hatchery Feed Revenue Share (%), by Types 2024 & 2032
- Figure 58: Asia Pacific Fish Hatchery Feed Volume Share (%), by Types 2024 & 2032
- Figure 59: Asia Pacific Fish Hatchery Feed Revenue (million), by Country 2024 & 2032
- Figure 60: Asia Pacific Fish Hatchery Feed Volume (K), by Country 2024 & 2032
- Figure 61: Asia Pacific Fish Hatchery Feed Revenue Share (%), by Country 2024 & 2032
- Figure 62: Asia Pacific Fish Hatchery Feed Volume Share (%), by Country 2024 & 2032
List of Tables
- Table 1: Global Fish Hatchery Feed Revenue million Forecast, by Region 2019 & 2032
- Table 2: Global Fish Hatchery Feed Volume K Forecast, by Region 2019 & 2032
- Table 3: Global Fish Hatchery Feed Revenue million Forecast, by Application 2019 & 2032
- Table 4: Global Fish Hatchery Feed Volume K Forecast, by Application 2019 & 2032
- Table 5: Global Fish Hatchery Feed Revenue million Forecast, by Types 2019 & 2032
- Table 6: Global Fish Hatchery Feed Volume K Forecast, by Types 2019 & 2032
- Table 7: Global Fish Hatchery Feed Revenue million Forecast, by Region 2019 & 2032
- Table 8: Global Fish Hatchery Feed Volume K Forecast, by Region 2019 & 2032
- Table 9: Global Fish Hatchery Feed Revenue million Forecast, by Application 2019 & 2032
- Table 10: Global Fish Hatchery Feed Volume K Forecast, by Application 2019 & 2032
- Table 11: Global Fish Hatchery Feed Revenue million Forecast, by Types 2019 & 2032
- Table 12: Global Fish Hatchery Feed Volume K Forecast, by Types 2019 & 2032
- Table 13: Global Fish Hatchery Feed Revenue million Forecast, by Country 2019 & 2032
- Table 14: Global Fish Hatchery Feed Volume K Forecast, by Country 2019 & 2032
- Table 15: United States Fish Hatchery Feed Revenue (million) Forecast, by Application 2019 & 2032
- Table 16: United States Fish Hatchery Feed Volume (K) Forecast, by Application 2019 & 2032
- Table 17: Canada Fish Hatchery Feed Revenue (million) Forecast, by Application 2019 & 2032
- Table 18: Canada Fish Hatchery Feed Volume (K) Forecast, by Application 2019 & 2032
- Table 19: Mexico Fish Hatchery Feed Revenue (million) Forecast, by Application 2019 & 2032
- Table 20: Mexico Fish Hatchery Feed Volume (K) Forecast, by Application 2019 & 2032
- Table 21: Global Fish Hatchery Feed Revenue million Forecast, by Application 2019 & 2032
- Table 22: Global Fish Hatchery Feed Volume K Forecast, by Application 2019 & 2032
- Table 23: Global Fish Hatchery Feed Revenue million Forecast, by Types 2019 & 2032
- Table 24: Global Fish Hatchery Feed Volume K Forecast, by Types 2019 & 2032
- Table 25: Global Fish Hatchery Feed Revenue million Forecast, by Country 2019 & 2032
- Table 26: Global Fish Hatchery Feed Volume K Forecast, by Country 2019 & 2032
- Table 27: Brazil Fish Hatchery Feed Revenue (million) Forecast, by Application 2019 & 2032
- Table 28: Brazil Fish Hatchery Feed Volume (K) Forecast, by Application 2019 & 2032
- Table 29: Argentina Fish Hatchery Feed Revenue (million) Forecast, by Application 2019 & 2032
- Table 30: Argentina Fish Hatchery Feed Volume (K) Forecast, by Application 2019 & 2032
- Table 31: Rest of South America Fish Hatchery Feed Revenue (million) Forecast, by Application 2019 & 2032
- Table 32: Rest of South America Fish Hatchery Feed Volume (K) Forecast, by Application 2019 & 2032
- Table 33: Global Fish Hatchery Feed Revenue million Forecast, by Application 2019 & 2032
- Table 34: Global Fish Hatchery Feed Volume K Forecast, by Application 2019 & 2032
- Table 35: Global Fish Hatchery Feed Revenue million Forecast, by Types 2019 & 2032
- Table 36: Global Fish Hatchery Feed Volume K Forecast, by Types 2019 & 2032
- Table 37: Global Fish Hatchery Feed Revenue million Forecast, by Country 2019 & 2032
- Table 38: Global Fish Hatchery Feed Volume K Forecast, by Country 2019 & 2032
- Table 39: United Kingdom Fish Hatchery Feed Revenue (million) Forecast, by Application 2019 & 2032
- Table 40: United Kingdom Fish Hatchery Feed Volume (K) Forecast, by Application 2019 & 2032
- Table 41: Germany Fish Hatchery Feed Revenue (million) Forecast, by Application 2019 & 2032
- Table 42: Germany Fish Hatchery Feed Volume (K) Forecast, by Application 2019 & 2032
- Table 43: France Fish Hatchery Feed Revenue (million) Forecast, by Application 2019 & 2032
- Table 44: France Fish Hatchery Feed Volume (K) Forecast, by Application 2019 & 2032
- Table 45: Italy Fish Hatchery Feed Revenue (million) Forecast, by Application 2019 & 2032
- Table 46: Italy Fish Hatchery Feed Volume (K) Forecast, by Application 2019 & 2032
- Table 47: Spain Fish Hatchery Feed Revenue (million) Forecast, by Application 2019 & 2032
- Table 48: Spain Fish Hatchery Feed Volume (K) Forecast, by Application 2019 & 2032
- Table 49: Russia Fish Hatchery Feed Revenue (million) Forecast, by Application 2019 & 2032
- Table 50: Russia Fish Hatchery Feed Volume (K) Forecast, by Application 2019 & 2032
- Table 51: Benelux Fish Hatchery Feed Revenue (million) Forecast, by Application 2019 & 2032
- Table 52: Benelux Fish Hatchery Feed Volume (K) Forecast, by Application 2019 & 2032
- Table 53: Nordics Fish Hatchery Feed Revenue (million) Forecast, by Application 2019 & 2032
- Table 54: Nordics Fish Hatchery Feed Volume (K) Forecast, by Application 2019 & 2032
- Table 55: Rest of Europe Fish Hatchery Feed Revenue (million) Forecast, by Application 2019 & 2032
- Table 56: Rest of Europe Fish Hatchery Feed Volume (K) Forecast, by Application 2019 & 2032
- Table 57: Global Fish Hatchery Feed Revenue million Forecast, by Application 2019 & 2032
- Table 58: Global Fish Hatchery Feed Volume K Forecast, by Application 2019 & 2032
- Table 59: Global Fish Hatchery Feed Revenue million Forecast, by Types 2019 & 2032
- Table 60: Global Fish Hatchery Feed Volume K Forecast, by Types 2019 & 2032
- Table 61: Global Fish Hatchery Feed Revenue million Forecast, by Country 2019 & 2032
- Table 62: Global Fish Hatchery Feed Volume K Forecast, by Country 2019 & 2032
- Table 63: Turkey Fish Hatchery Feed Revenue (million) Forecast, by Application 2019 & 2032
- Table 64: Turkey Fish Hatchery Feed Volume (K) Forecast, by Application 2019 & 2032
- Table 65: Israel Fish Hatchery Feed Revenue (million) Forecast, by Application 2019 & 2032
- Table 66: Israel Fish Hatchery Feed Volume (K) Forecast, by Application 2019 & 2032
- Table 67: GCC Fish Hatchery Feed Revenue (million) Forecast, by Application 2019 & 2032
- Table 68: GCC Fish Hatchery Feed Volume (K) Forecast, by Application 2019 & 2032
- Table 69: North Africa Fish Hatchery Feed Revenue (million) Forecast, by Application 2019 & 2032
- Table 70: North Africa Fish Hatchery Feed Volume (K) Forecast, by Application 2019 & 2032
- Table 71: South Africa Fish Hatchery Feed Revenue (million) Forecast, by Application 2019 & 2032
- Table 72: South Africa Fish Hatchery Feed Volume (K) Forecast, by Application 2019 & 2032
- Table 73: Rest of Middle East & Africa Fish Hatchery Feed Revenue (million) Forecast, by Application 2019 & 2032
- Table 74: Rest of Middle East & Africa Fish Hatchery Feed Volume (K) Forecast, by Application 2019 & 2032
- Table 75: Global Fish Hatchery Feed Revenue million Forecast, by Application 2019 & 2032
- Table 76: Global Fish Hatchery Feed Volume K Forecast, by Application 2019 & 2032
- Table 77: Global Fish Hatchery Feed Revenue million Forecast, by Types 2019 & 2032
- Table 78: Global Fish Hatchery Feed Volume K Forecast, by Types 2019 & 2032
- Table 79: Global Fish Hatchery Feed Revenue million Forecast, by Country 2019 & 2032
- Table 80: Global Fish Hatchery Feed Volume K Forecast, by Country 2019 & 2032
- Table 81: China Fish Hatchery Feed Revenue (million) Forecast, by Application 2019 & 2032
- Table 82: China Fish Hatchery Feed Volume (K) Forecast, by Application 2019 & 2032
- Table 83: India Fish Hatchery Feed Revenue (million) Forecast, by Application 2019 & 2032
- Table 84: India Fish Hatchery Feed Volume (K) Forecast, by Application 2019 & 2032
- Table 85: Japan Fish Hatchery Feed Revenue (million) Forecast, by Application 2019 & 2032
- Table 86: Japan Fish Hatchery Feed Volume (K) Forecast, by Application 2019 & 2032
- Table 87: South Korea Fish Hatchery Feed Revenue (million) Forecast, by Application 2019 & 2032
- Table 88: South Korea Fish Hatchery Feed Volume (K) Forecast, by Application 2019 & 2032
- Table 89: ASEAN Fish Hatchery Feed Revenue (million) Forecast, by Application 2019 & 2032
- Table 90: ASEAN Fish Hatchery Feed Volume (K) Forecast, by Application 2019 & 2032
- Table 91: Oceania Fish Hatchery Feed Revenue (million) Forecast, by Application 2019 & 2032
- Table 92: Oceania Fish Hatchery Feed Volume (K) Forecast, by Application 2019 & 2032
- Table 93: Rest of Asia Pacific Fish Hatchery Feed Revenue (million) Forecast, by Application 2019 & 2032
- Table 94: Rest of Asia Pacific Fish Hatchery Feed Volume (K) Forecast, by Application 2019 & 2032
Frequently Asked Questions
1. What is the projected Compound Annual Growth Rate (CAGR) of the Fish Hatchery Feed?
The projected CAGR is approximately XX%.
2. Which companies are prominent players in the Fish Hatchery Feed?
Key companies in the market include BioMar, BernAqua, Skretting, Molofeed, Tromsø Fiskeindustri, Great Salt Lake Artemia.
3. What are the main segments of the Fish Hatchery Feed?
The market segments include Application, Types.
4. Can you provide details about the market size?
The market size is estimated to be USD XXX million as of 2022.
5. What are some drivers contributing to market growth?
N/A
6. What are the notable trends driving market growth?
N/A
7. Are there any restraints impacting market growth?
N/A
8. Can you provide examples of recent developments in the market?
N/A
9. What pricing options are available for accessing the report?
Pricing options include single-user, multi-user, and enterprise licenses priced at USD 3950.00, USD 5925.00, and USD 7900.00 respectively.
10. Is the market size provided in terms of value or volume?
The market size is provided in terms of value, measured in million and volume, measured in K.
11. Are there any specific market keywords associated with the report?
Yes, the market keyword associated with the report is "Fish Hatchery Feed," which aids in identifying and referencing the specific market segment covered.
12. How do I determine which pricing option suits my needs best?
The pricing options vary based on user requirements and access needs. Individual users may opt for single-user licenses, while businesses requiring broader access may choose multi-user or enterprise licenses for cost-effective access to the report.
13. Are there any additional resources or data provided in the Fish Hatchery Feed report?
While the report offers comprehensive insights, it's advisable to review the specific contents or supplementary materials provided to ascertain if additional resources or data are available.
14. How can I stay updated on further developments or reports in the Fish Hatchery Feed?
To stay informed about further developments, trends, and reports in the Fish Hatchery Feed, consider subscribing to industry newsletters, following relevant companies and organizations, or regularly checking reputable industry news sources and publications.
Methodology
Step 1 - Identification of Relevant Samples Size from Population Database


Step 2 - Approaches for Defining Global Market Size (Value, Volume* & Price*)

Note*: In applicable scenarios
Step 3 - Data Sources
Primary Research
- Web Analytics
- Survey Reports
- Research Institute
- Latest Research Reports
- Opinion Leaders
Secondary Research
- Annual Reports
- White Paper
- Latest Press Release
- Industry Association
- Paid Database
- Investor Presentations

Step 4 - Data Triangulation
Involves using different sources of information in order to increase the validity of a study
These sources are likely to be stakeholders in a program - participants, other researchers, program staff, other community members, and so on.
Then we put all data in single framework & apply various statistical tools to find out the dynamic on the market.
During the analysis stage, feedback from the stakeholder groups would be compared to determine areas of agreement as well as areas of divergence


