


Key Insights
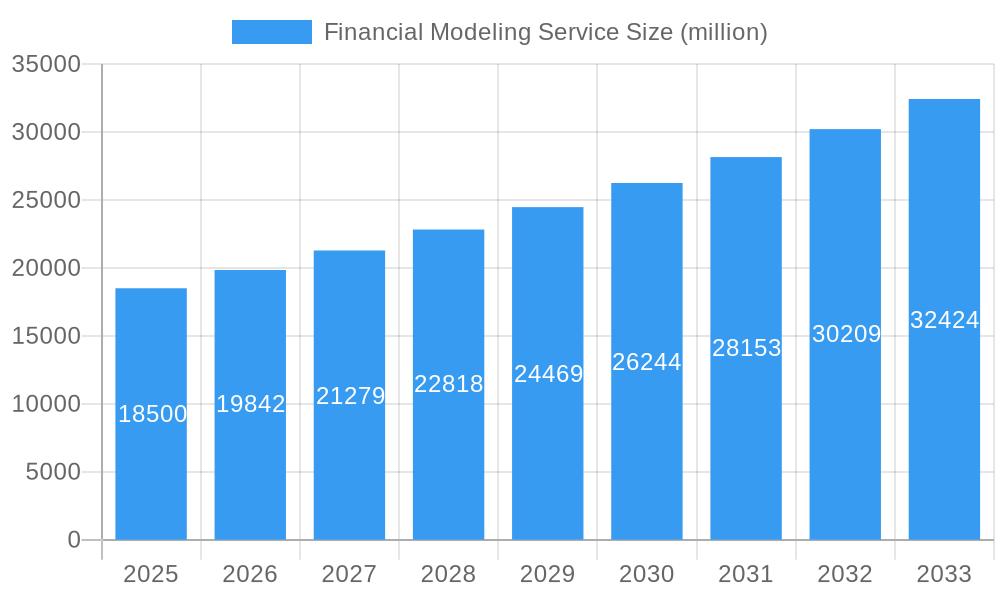
The global Financial Modeling Service market is experiencing robust growth, projected to reach approximately $18.5 billion by the end of 2025. This expansion is driven by an increasing demand for sophisticated financial analysis across various industries, enabling businesses to make more informed strategic decisions. Key growth drivers include the rising complexity of global financial markets, the need for accurate valuations in mergers and acquisitions, and the persistent requirement for effective budgeting and forecasting. Small and Medium-sized Enterprises (SMEs) are increasingly adopting these services to level the playing field with larger corporations, seeking to improve their financial planning and risk management capabilities. Similarly, large enterprises are leveraging advanced financial modeling to optimize capital structure, perform rigorous sensitivity analyses, and navigate dynamic economic landscapes. The market's Compound Annual Growth Rate (CAGR) is estimated to be around 7.2%, indicating a healthy and sustained upward trajectory through 2033.
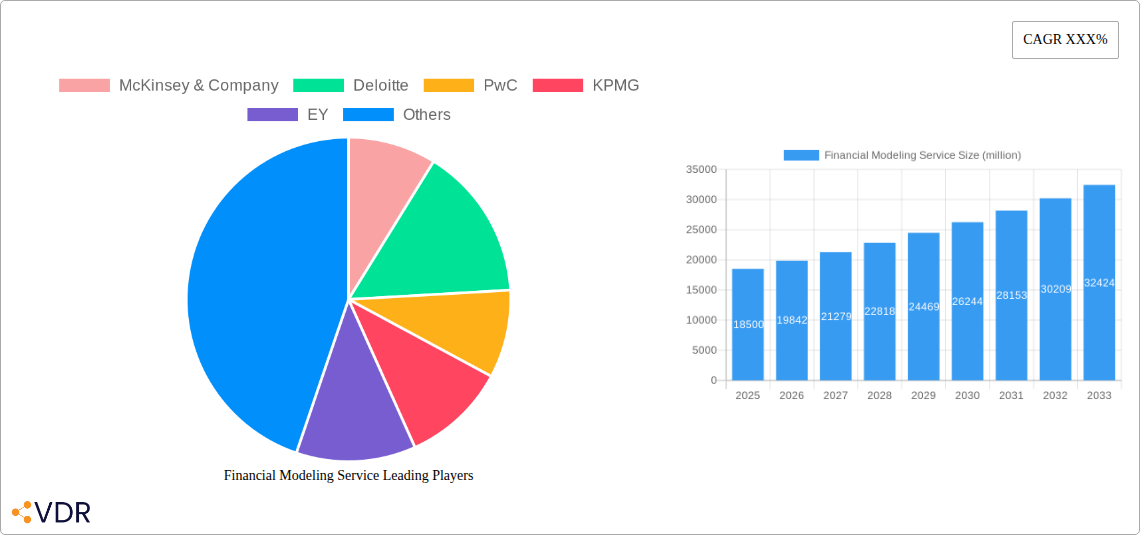
Financial Modeling Service Market Size (In Billion)

Technological advancements, such as the integration of AI and machine learning into financial modeling platforms, are further enhancing the efficiency and accuracy of these services, opening new avenues for innovation and service delivery. Leading consulting firms, investment banks, and specialized financial advisory companies are at the forefront of this market, offering a comprehensive suite of services including valuation modeling, budgeting and forecasting, sensitivity analysis, M&A modeling, and capital structure modeling. Geographically, North America currently leads the market due to a strong presence of financial institutions and a proactive business environment, followed closely by Europe. The Asia Pacific region, particularly China and India, is emerging as a significant growth hub, fueled by rapid industrialization and a burgeoning corporate sector eager to adopt advanced financial strategies. While the market is buoyant, potential restraints include the high cost of specialized talent and the initial investment required for sophisticated modeling software, though these are being mitigated by the increasing availability of cloud-based solutions and outsourcing options.
Financial Modeling Service Company Market Share
Comprehensive Financial Modeling Service Market Report: 2019-2033
This in-depth report provides a definitive analysis of the global Financial Modeling Service market, offering critical insights for strategic decision-making. Covering the period from 2019 to 2033, with a base year of 2025, this study delves into market dynamics, growth trends, regional dominance, product landscapes, and key players. Understand the evolving ecosystem, from SMEs to Large Enterprises, and across diverse modeling types like Valuation Modeling, Budgeting and Forecasting, and Mergers and Acquisitions (M&A) Modeling. Gain an unparalleled understanding of market drivers, challenges, and emerging opportunities in a rapidly transforming financial landscape.
Financial Modeling Service Market Dynamics & Structure
The global Financial Modeling Service market is characterized by a moderate to high concentration, with leading players leveraging technological innovation and strategic M&A activities to expand their market share. Technological advancements in AI, machine learning, and big data analytics are pivotal drivers, enabling more sophisticated and accurate financial forecasting and valuation models. Regulatory frameworks, while sometimes posing compliance challenges, also foster transparency and trust, particularly in areas like M&A. Competitive product substitutes, primarily in-house developed solutions and simpler spreadsheet-based tools, are continuously being challenged by the advanced capabilities offered by specialized financial modeling services. End-user demographics are shifting, with an increasing demand from SMEs seeking sophisticated financial planning tools and large enterprises requiring complex, integrated solutions. M&A trends are prominent, with larger firms acquiring niche providers to enhance their service portfolios and expand geographical reach.
- Market Concentration: Dominated by a blend of large consulting firms and specialized financial analytics providers.
- Technological Innovation Drivers: AI-driven forecasting, advanced data visualization, and automation in model building.
- Regulatory Frameworks: Growing emphasis on compliance, data privacy, and transparent reporting.
- Competitive Product Substitutes: Excel-based models, basic accounting software, and internal development teams.
- End-User Demographics: Growing adoption by SMEs alongside continued demand from large corporations.
- M&A Trends: Strategic acquisitions to gain market share, technology, and talent.
Financial Modeling Service Growth Trends & Insights
The financial modeling service market is poised for robust growth, driven by an increasing reliance on data-driven decision-making across all business sectors. Market size is projected to expand significantly, fueled by the continuous need for accurate financial projections, risk assessments, and strategic planning tools. Adoption rates are accelerating, particularly among SMEs who are increasingly recognizing the value of professional financial modeling in navigating complex economic environments and securing funding. Technological disruptions, such as the integration of AI and machine learning, are transforming the capabilities of financial modeling services, offering enhanced predictive accuracy and automation. Consumer behavior shifts are evident, with clients demanding more personalized, agile, and integrated financial modeling solutions that can adapt to rapidly changing market conditions. The market is expected to witness a Compound Annual Growth Rate (CAGR) of approximately 12.5% over the forecast period. Market penetration is deepening, as more businesses understand that sophisticated financial modeling is not just for large enterprises but a crucial tool for growth and stability.
Dominant Regions, Countries, or Segments in Financial Modeling Service
The Large Enterprises segment, encompassing multinational corporations and publicly traded companies, currently dominates the financial modeling service market, driven by their complex financial structures, significant investment in strategic planning, and higher budgets allocated for sophisticated analytical tools. This segment's dominance is further amplified by their frequent involvement in cross-border M&A activities, capital raises, and intricate financial restructurings, all of which necessitate advanced financial modeling expertise. North America and Europe are the leading geographical regions, owing to their mature financial markets, established corporate governance standards, and the presence of a large number of Fortune 500 companies and sophisticated financial institutions. The "Mergers and Acquisitions (M&A) Modeling" type also exhibits strong growth, reflecting the global trend of consolidation and strategic partnerships across industries.
- Dominant Application Segment: Large Enterprises – characterized by intricate financial needs and substantial investment capacity.
- Key Regional Drivers (North America & Europe): Mature financial markets, strong regulatory oversight, and high concentration of global corporations.
- Leading Service Type: Mergers and Acquisitions (M&A) Modeling – driven by global consolidation trends.
- Market Share within Large Enterprises: Estimated at 65% of the total market in 2025.
- Growth Potential in SMEs: Projected CAGR of 15% for SMEs, indicating a significant future opportunity.
- Economic Policies: Favorable policies encouraging investment and innovation further bolster demand in leading regions.
Financial Modeling Service Product Landscape
The financial modeling service product landscape is evolving rapidly, driven by a commitment to innovation and enhanced client value. Modern financial modeling services offer a suite of sophisticated solutions, including advanced predictive analytics, real-time scenario planning, and automated report generation. Key product innovations focus on integrating AI and machine learning algorithms to deliver highly accurate forecasts and risk assessments. Performance metrics are increasingly tied to the precision of projections, the speed of analysis, and the actionable insights provided to clients. Unique selling propositions often lie in the customization of models to specific industry needs, the integration with existing enterprise resource planning (ERP) systems, and the ability to perform complex "what-if" analyses with speed and agility.
Key Drivers, Barriers & Challenges in Financial Modeling Service
Key Drivers:
- Increasing complexity of financial markets: Demands sophisticated analytical tools for risk management and strategic decision-making.
- Growth in Big Data and AI: Enables more accurate and predictive financial modeling.
- Need for informed investment decisions: Crucial for M&A, capital allocation, and business expansion.
- Regulatory compliance requirements: Mandates accurate financial reporting and forecasting.
- Globalization of business: Requires complex cross-border financial analysis.
Barriers & Challenges:
- High cost of advanced software and skilled personnel: Can be a barrier for smaller businesses.
- Data security and privacy concerns: Essential for handling sensitive financial information, creating compliance hurdles.
- Resistance to adopting new technologies: Traditional methods may persist in some organizations.
- Intense competition: From established players and emerging disruptors, impacting pricing.
- Talent shortage: Finding experienced financial modelers with expertise in cutting-edge technologies is challenging.
Emerging Opportunities in Financial Modeling Service
Emerging opportunities in the financial modeling service sector are abundant, particularly in the integration of sustainability reporting (ESG) into financial models, providing companies with a holistic view of their performance and risks. The growing adoption of cloud-based financial modeling platforms is creating opportunities for scalable, accessible solutions, especially for SMEs. Furthermore, the increasing demand for customized risk assessment tools in the face of volatile economic conditions and geopolitical uncertainties presents a significant growth avenue. The development of AI-powered anomaly detection within financial models offers proactive identification of potential issues. The expansion of services into emerging markets, where financial literacy and formal modeling adoption are on the rise, also represents a key opportunity.
Growth Accelerators in the Financial Modeling Service Industry
Technological breakthroughs, particularly in artificial intelligence and machine learning, are significant growth accelerators, enabling more precise forecasting and sophisticated risk analysis. Strategic partnerships between financial modeling service providers and technology firms are fostering innovation and expanding service offerings. The increasing globalization of businesses and capital markets necessitates robust and adaptable financial modeling solutions, acting as a powerful growth catalyst. Furthermore, the growing emphasis on data-driven decision-making across all industries is propelling demand. The expansion of cloud-based delivery models is democratizing access to advanced financial modeling capabilities, further accelerating adoption and market growth.
Key Players Shaping the Financial Modeling Service Market
- McKinsey & Company
- Deloitte
- PwC
- KPMG
- EY
- Alvarez & Marsal
- FTI Consulting
- Grant Thornton
- Accenture
- Boston Consulting Group
- Bain & Company
- Aon
- Capgemini
- BlackRock
- Goldman Sachs
- J.P. Morgan Chase & Co.
- Morgan Stanley
- Wells Fargo Securities
- Credit Suisse
- Deutsche Bank
- UBS
- Barclays
- Citigroup
- HSBC
- Nomura
Notable Milestones in Financial Modeling Service Sector
- 2019: Increased adoption of cloud-based financial modeling platforms.
- 2020: Surge in demand for scenario planning and sensitivity analysis due to global pandemic.
- 2021: Integration of AI and machine learning capabilities becoming more mainstream.
- 2022: Growing emphasis on ESG (Environmental, Social, and Governance) integration in financial models.
- 2023: Rise of specialized financial modeling for FinTech and cryptocurrency sectors.
- 2024 (Forecast): Enhanced automation in model building and reporting expected.
In-Depth Financial Modeling Service Market Outlook
The future market outlook for financial modeling services is exceptionally promising, driven by ongoing technological advancements and an increasing imperative for data-driven strategic planning. Growth accelerators, including sophisticated AI integration for predictive analytics and the expansion of cloud-based solutions for greater accessibility, will continue to fuel market expansion. Strategic partnerships and the consolidation of market players will further refine service offerings and market reach. The increasing demand from SMEs, coupled with the evolving needs of large enterprises for dynamic risk management and complex valuation models, ensures sustained demand. The market is poised for significant growth, offering substantial opportunities for innovation and strategic investment in the coming years.
Financial Modeling Service Segmentation
-
1. Application
- 1.1. SMEs
- 1.2. Large Enterprises
-
2. Type
- 2.1. Valuation Modeling
- 2.2. Budgeting and Forecasting
- 2.3. Sensitivity Analysis
- 2.4. Mergers and Acquisitions (M&A) Modeling
- 2.5. Capital Structure Modeling
Financial Modeling Service Segmentation By Geography
-
1. North America
- 1.1. United States
- 1.2. Canada
- 1.3. Mexico
-
2. South America
- 2.1. Brazil
- 2.2. Argentina
- 2.3. Rest of South America
-
3. Europe
- 3.1. United Kingdom
- 3.2. Germany
- 3.3. France
- 3.4. Italy
- 3.5. Spain
- 3.6. Russia
- 3.7. Benelux
- 3.8. Nordics
- 3.9. Rest of Europe
-
4. Middle East & Africa
- 4.1. Turkey
- 4.2. Israel
- 4.3. GCC
- 4.4. North Africa
- 4.5. South Africa
- 4.6. Rest of Middle East & Africa
-
5. Asia Pacific
- 5.1. China
- 5.2. India
- 5.3. Japan
- 5.4. South Korea
- 5.5. ASEAN
- 5.6. Oceania
- 5.7. Rest of Asia Pacific
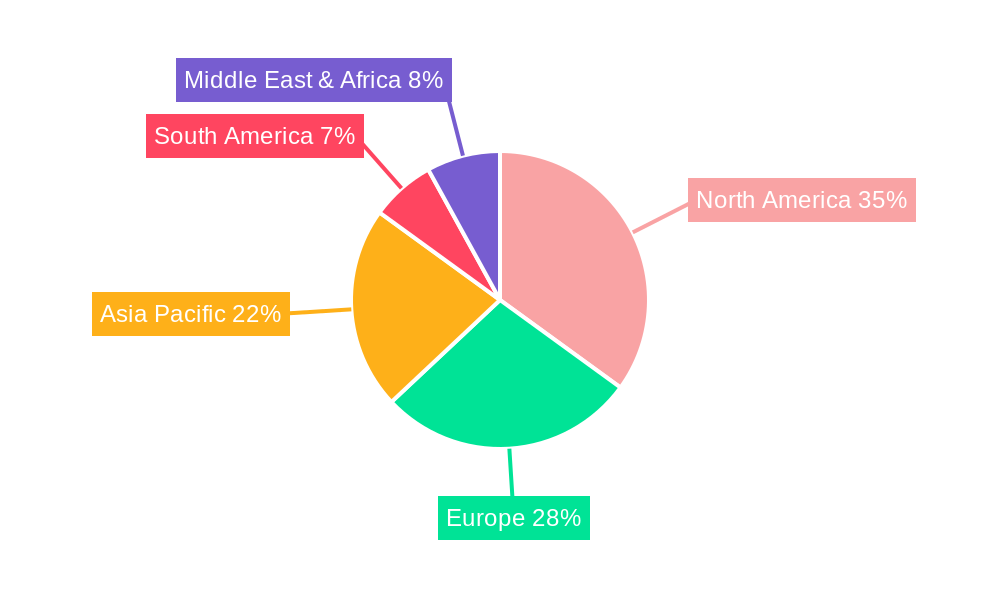
Financial Modeling Service Regional Market Share
Geographic Coverage of Financial Modeling Service
Financial Modeling Service REPORT HIGHLIGHTS
| Aspects | Details |
|---|---|
| Study Period | 2020-2034 |
| Base Year | 2025 |
| Estimated Year | 2026 |
| Forecast Period | 2026-2034 |
| Historical Period | 2020-2025 |
| Growth Rate | CAGR of XXX% from 2020-2034 |
| Segmentation |
|
Table of Contents
- 1. Introduction
- 1.1. Research Scope
- 1.2. Market Segmentation
- 1.3. Research Methodology
- 1.4. Definitions and Assumptions
- 2. Executive Summary
- 2.1. Introduction
- 3. Market Dynamics
- 3.1. Introduction
- 3.2. Market Drivers
- 3.3. Market Restrains
- 3.4. Market Trends
- 4. Market Factor Analysis
- 4.1. Porters Five Forces
- 4.2. Supply/Value Chain
- 4.3. PESTEL analysis
- 4.4. Market Entropy
- 4.5. Patent/Trademark Analysis
- 5. Global Financial Modeling Service Analysis, Insights and Forecast, 2020-2032
- 5.1. Market Analysis, Insights and Forecast - by Application
- 5.1.1. SMEs
- 5.1.2. Large Enterprises
- 5.2. Market Analysis, Insights and Forecast - by Type
- 5.2.1. Valuation Modeling
- 5.2.2. Budgeting and Forecasting
- 5.2.3. Sensitivity Analysis
- 5.2.4. Mergers and Acquisitions (M&A) Modeling
- 5.2.5. Capital Structure Modeling
- 5.3. Market Analysis, Insights and Forecast - by Region
- 5.3.1. North America
- 5.3.2. South America
- 5.3.3. Europe
- 5.3.4. Middle East & Africa
- 5.3.5. Asia Pacific
- 5.1. Market Analysis, Insights and Forecast - by Application
- 6. North America Financial Modeling Service Analysis, Insights and Forecast, 2020-2032
- 6.1. Market Analysis, Insights and Forecast - by Application
- 6.1.1. SMEs
- 6.1.2. Large Enterprises
- 6.2. Market Analysis, Insights and Forecast - by Type
- 6.2.1. Valuation Modeling
- 6.2.2. Budgeting and Forecasting
- 6.2.3. Sensitivity Analysis
- 6.2.4. Mergers and Acquisitions (M&A) Modeling
- 6.2.5. Capital Structure Modeling
- 6.1. Market Analysis, Insights and Forecast - by Application
- 7. South America Financial Modeling Service Analysis, Insights and Forecast, 2020-2032
- 7.1. Market Analysis, Insights and Forecast - by Application
- 7.1.1. SMEs
- 7.1.2. Large Enterprises
- 7.2. Market Analysis, Insights and Forecast - by Type
- 7.2.1. Valuation Modeling
- 7.2.2. Budgeting and Forecasting
- 7.2.3. Sensitivity Analysis
- 7.2.4. Mergers and Acquisitions (M&A) Modeling
- 7.2.5. Capital Structure Modeling
- 7.1. Market Analysis, Insights and Forecast - by Application
- 8. Europe Financial Modeling Service Analysis, Insights and Forecast, 2020-2032
- 8.1. Market Analysis, Insights and Forecast - by Application
- 8.1.1. SMEs
- 8.1.2. Large Enterprises
- 8.2. Market Analysis, Insights and Forecast - by Type
- 8.2.1. Valuation Modeling
- 8.2.2. Budgeting and Forecasting
- 8.2.3. Sensitivity Analysis
- 8.2.4. Mergers and Acquisitions (M&A) Modeling
- 8.2.5. Capital Structure Modeling
- 8.1. Market Analysis, Insights and Forecast - by Application
- 9. Middle East & Africa Financial Modeling Service Analysis, Insights and Forecast, 2020-2032
- 9.1. Market Analysis, Insights and Forecast - by Application
- 9.1.1. SMEs
- 9.1.2. Large Enterprises
- 9.2. Market Analysis, Insights and Forecast - by Type
- 9.2.1. Valuation Modeling
- 9.2.2. Budgeting and Forecasting
- 9.2.3. Sensitivity Analysis
- 9.2.4. Mergers and Acquisitions (M&A) Modeling
- 9.2.5. Capital Structure Modeling
- 9.1. Market Analysis, Insights and Forecast - by Application
- 10. Asia Pacific Financial Modeling Service Analysis, Insights and Forecast, 2020-2032
- 10.1. Market Analysis, Insights and Forecast - by Application
- 10.1.1. SMEs
- 10.1.2. Large Enterprises
- 10.2. Market Analysis, Insights and Forecast - by Type
- 10.2.1. Valuation Modeling
- 10.2.2. Budgeting and Forecasting
- 10.2.3. Sensitivity Analysis
- 10.2.4. Mergers and Acquisitions (M&A) Modeling
- 10.2.5. Capital Structure Modeling
- 10.1. Market Analysis, Insights and Forecast - by Application
- 11. Competitive Analysis
- 11.1. Global Market Share Analysis 2025
- 11.2. Company Profiles
- 11.2.1 McKinsey & Company
- 11.2.1.1. Overview
- 11.2.1.2. Products
- 11.2.1.3. SWOT Analysis
- 11.2.1.4. Recent Developments
- 11.2.1.5. Financials (Based on Availability)
- 11.2.2 Deloitte
- 11.2.2.1. Overview
- 11.2.2.2. Products
- 11.2.2.3. SWOT Analysis
- 11.2.2.4. Recent Developments
- 11.2.2.5. Financials (Based on Availability)
- 11.2.3 PwC
- 11.2.3.1. Overview
- 11.2.3.2. Products
- 11.2.3.3. SWOT Analysis
- 11.2.3.4. Recent Developments
- 11.2.3.5. Financials (Based on Availability)
- 11.2.4 KPMG
- 11.2.4.1. Overview
- 11.2.4.2. Products
- 11.2.4.3. SWOT Analysis
- 11.2.4.4. Recent Developments
- 11.2.4.5. Financials (Based on Availability)
- 11.2.5 EY
- 11.2.5.1. Overview
- 11.2.5.2. Products
- 11.2.5.3. SWOT Analysis
- 11.2.5.4. Recent Developments
- 11.2.5.5. Financials (Based on Availability)
- 11.2.6 Alvarez & Marsal
- 11.2.6.1. Overview
- 11.2.6.2. Products
- 11.2.6.3. SWOT Analysis
- 11.2.6.4. Recent Developments
- 11.2.6.5. Financials (Based on Availability)
- 11.2.7 FTI Consulting
- 11.2.7.1. Overview
- 11.2.7.2. Products
- 11.2.7.3. SWOT Analysis
- 11.2.7.4. Recent Developments
- 11.2.7.5. Financials (Based on Availability)
- 11.2.8 Grant Thornton
- 11.2.8.1. Overview
- 11.2.8.2. Products
- 11.2.8.3. SWOT Analysis
- 11.2.8.4. Recent Developments
- 11.2.8.5. Financials (Based on Availability)
- 11.2.9 Accenture
- 11.2.9.1. Overview
- 11.2.9.2. Products
- 11.2.9.3. SWOT Analysis
- 11.2.9.4. Recent Developments
- 11.2.9.5. Financials (Based on Availability)
- 11.2.10 Boston Consulting Group
- 11.2.10.1. Overview
- 11.2.10.2. Products
- 11.2.10.3. SWOT Analysis
- 11.2.10.4. Recent Developments
- 11.2.10.5. Financials (Based on Availability)
- 11.2.11 Bain & Company
- 11.2.11.1. Overview
- 11.2.11.2. Products
- 11.2.11.3. SWOT Analysis
- 11.2.11.4. Recent Developments
- 11.2.11.5. Financials (Based on Availability)
- 11.2.12 Aon
- 11.2.12.1. Overview
- 11.2.12.2. Products
- 11.2.12.3. SWOT Analysis
- 11.2.12.4. Recent Developments
- 11.2.12.5. Financials (Based on Availability)
- 11.2.13 Capgemini
- 11.2.13.1. Overview
- 11.2.13.2. Products
- 11.2.13.3. SWOT Analysis
- 11.2.13.4. Recent Developments
- 11.2.13.5. Financials (Based on Availability)
- 11.2.14 BlackRock
- 11.2.14.1. Overview
- 11.2.14.2. Products
- 11.2.14.3. SWOT Analysis
- 11.2.14.4. Recent Developments
- 11.2.14.5. Financials (Based on Availability)
- 11.2.15 Goldman Sachs
- 11.2.15.1. Overview
- 11.2.15.2. Products
- 11.2.15.3. SWOT Analysis
- 11.2.15.4. Recent Developments
- 11.2.15.5. Financials (Based on Availability)
- 11.2.16 J.P. Morgan Chase & Co.
- 11.2.16.1. Overview
- 11.2.16.2. Products
- 11.2.16.3. SWOT Analysis
- 11.2.16.4. Recent Developments
- 11.2.16.5. Financials (Based on Availability)
- 11.2.17 Morgan Stanley
- 11.2.17.1. Overview
- 11.2.17.2. Products
- 11.2.17.3. SWOT Analysis
- 11.2.17.4. Recent Developments
- 11.2.17.5. Financials (Based on Availability)
- 11.2.18 Wells Fargo Securities
- 11.2.18.1. Overview
- 11.2.18.2. Products
- 11.2.18.3. SWOT Analysis
- 11.2.18.4. Recent Developments
- 11.2.18.5. Financials (Based on Availability)
- 11.2.19 Credit Suisse
- 11.2.19.1. Overview
- 11.2.19.2. Products
- 11.2.19.3. SWOT Analysis
- 11.2.19.4. Recent Developments
- 11.2.19.5. Financials (Based on Availability)
- 11.2.20 Deutsche Bank
- 11.2.20.1. Overview
- 11.2.20.2. Products
- 11.2.20.3. SWOT Analysis
- 11.2.20.4. Recent Developments
- 11.2.20.5. Financials (Based on Availability)
- 11.2.21 UBS
- 11.2.21.1. Overview
- 11.2.21.2. Products
- 11.2.21.3. SWOT Analysis
- 11.2.21.4. Recent Developments
- 11.2.21.5. Financials (Based on Availability)
- 11.2.22 Barclays
- 11.2.22.1. Overview
- 11.2.22.2. Products
- 11.2.22.3. SWOT Analysis
- 11.2.22.4. Recent Developments
- 11.2.22.5. Financials (Based on Availability)
- 11.2.23 Citigroup
- 11.2.23.1. Overview
- 11.2.23.2. Products
- 11.2.23.3. SWOT Analysis
- 11.2.23.4. Recent Developments
- 11.2.23.5. Financials (Based on Availability)
- 11.2.24 HSBC
- 11.2.24.1. Overview
- 11.2.24.2. Products
- 11.2.24.3. SWOT Analysis
- 11.2.24.4. Recent Developments
- 11.2.24.5. Financials (Based on Availability)
- 11.2.25 Nomura
- 11.2.25.1. Overview
- 11.2.25.2. Products
- 11.2.25.3. SWOT Analysis
- 11.2.25.4. Recent Developments
- 11.2.25.5. Financials (Based on Availability)
- 11.2.1 McKinsey & Company
List of Figures
- Figure 1: Global Financial Modeling Service Revenue Breakdown (million, %) by Region 2025 & 2033
- Figure 2: North America Financial Modeling Service Revenue (million), by Application 2025 & 2033
- Figure 3: North America Financial Modeling Service Revenue Share (%), by Application 2025 & 2033
- Figure 4: North America Financial Modeling Service Revenue (million), by Type 2025 & 2033
- Figure 5: North America Financial Modeling Service Revenue Share (%), by Type 2025 & 2033
- Figure 6: North America Financial Modeling Service Revenue (million), by Country 2025 & 2033
- Figure 7: North America Financial Modeling Service Revenue Share (%), by Country 2025 & 2033
- Figure 8: South America Financial Modeling Service Revenue (million), by Application 2025 & 2033
- Figure 9: South America Financial Modeling Service Revenue Share (%), by Application 2025 & 2033
- Figure 10: South America Financial Modeling Service Revenue (million), by Type 2025 & 2033
- Figure 11: South America Financial Modeling Service Revenue Share (%), by Type 2025 & 2033
- Figure 12: South America Financial Modeling Service Revenue (million), by Country 2025 & 2033
- Figure 13: South America Financial Modeling Service Revenue Share (%), by Country 2025 & 2033
- Figure 14: Europe Financial Modeling Service Revenue (million), by Application 2025 & 2033
- Figure 15: Europe Financial Modeling Service Revenue Share (%), by Application 2025 & 2033
- Figure 16: Europe Financial Modeling Service Revenue (million), by Type 2025 & 2033
- Figure 17: Europe Financial Modeling Service Revenue Share (%), by Type 2025 & 2033
- Figure 18: Europe Financial Modeling Service Revenue (million), by Country 2025 & 2033
- Figure 19: Europe Financial Modeling Service Revenue Share (%), by Country 2025 & 2033
- Figure 20: Middle East & Africa Financial Modeling Service Revenue (million), by Application 2025 & 2033
- Figure 21: Middle East & Africa Financial Modeling Service Revenue Share (%), by Application 2025 & 2033
- Figure 22: Middle East & Africa Financial Modeling Service Revenue (million), by Type 2025 & 2033
- Figure 23: Middle East & Africa Financial Modeling Service Revenue Share (%), by Type 2025 & 2033
- Figure 24: Middle East & Africa Financial Modeling Service Revenue (million), by Country 2025 & 2033
- Figure 25: Middle East & Africa Financial Modeling Service Revenue Share (%), by Country 2025 & 2033
- Figure 26: Asia Pacific Financial Modeling Service Revenue (million), by Application 2025 & 2033
- Figure 27: Asia Pacific Financial Modeling Service Revenue Share (%), by Application 2025 & 2033
- Figure 28: Asia Pacific Financial Modeling Service Revenue (million), by Type 2025 & 2033
- Figure 29: Asia Pacific Financial Modeling Service Revenue Share (%), by Type 2025 & 2033
- Figure 30: Asia Pacific Financial Modeling Service Revenue (million), by Country 2025 & 2033
- Figure 31: Asia Pacific Financial Modeling Service Revenue Share (%), by Country 2025 & 2033
List of Tables
- Table 1: Global Financial Modeling Service Revenue million Forecast, by Application 2020 & 2033
- Table 2: Global Financial Modeling Service Revenue million Forecast, by Type 2020 & 2033
- Table 3: Global Financial Modeling Service Revenue million Forecast, by Region 2020 & 2033
- Table 4: Global Financial Modeling Service Revenue million Forecast, by Application 2020 & 2033
- Table 5: Global Financial Modeling Service Revenue million Forecast, by Type 2020 & 2033
- Table 6: Global Financial Modeling Service Revenue million Forecast, by Country 2020 & 2033
- Table 7: United States Financial Modeling Service Revenue (million) Forecast, by Application 2020 & 2033
- Table 8: Canada Financial Modeling Service Revenue (million) Forecast, by Application 2020 & 2033
- Table 9: Mexico Financial Modeling Service Revenue (million) Forecast, by Application 2020 & 2033
- Table 10: Global Financial Modeling Service Revenue million Forecast, by Application 2020 & 2033
- Table 11: Global Financial Modeling Service Revenue million Forecast, by Type 2020 & 2033
- Table 12: Global Financial Modeling Service Revenue million Forecast, by Country 2020 & 2033
- Table 13: Brazil Financial Modeling Service Revenue (million) Forecast, by Application 2020 & 2033
- Table 14: Argentina Financial Modeling Service Revenue (million) Forecast, by Application 2020 & 2033
- Table 15: Rest of South America Financial Modeling Service Revenue (million) Forecast, by Application 2020 & 2033
- Table 16: Global Financial Modeling Service Revenue million Forecast, by Application 2020 & 2033
- Table 17: Global Financial Modeling Service Revenue million Forecast, by Type 2020 & 2033
- Table 18: Global Financial Modeling Service Revenue million Forecast, by Country 2020 & 2033
- Table 19: United Kingdom Financial Modeling Service Revenue (million) Forecast, by Application 2020 & 2033
- Table 20: Germany Financial Modeling Service Revenue (million) Forecast, by Application 2020 & 2033
- Table 21: France Financial Modeling Service Revenue (million) Forecast, by Application 2020 & 2033
- Table 22: Italy Financial Modeling Service Revenue (million) Forecast, by Application 2020 & 2033
- Table 23: Spain Financial Modeling Service Revenue (million) Forecast, by Application 2020 & 2033
- Table 24: Russia Financial Modeling Service Revenue (million) Forecast, by Application 2020 & 2033
- Table 25: Benelux Financial Modeling Service Revenue (million) Forecast, by Application 2020 & 2033
- Table 26: Nordics Financial Modeling Service Revenue (million) Forecast, by Application 2020 & 2033
- Table 27: Rest of Europe Financial Modeling Service Revenue (million) Forecast, by Application 2020 & 2033
- Table 28: Global Financial Modeling Service Revenue million Forecast, by Application 2020 & 2033
- Table 29: Global Financial Modeling Service Revenue million Forecast, by Type 2020 & 2033
- Table 30: Global Financial Modeling Service Revenue million Forecast, by Country 2020 & 2033
- Table 31: Turkey Financial Modeling Service Revenue (million) Forecast, by Application 2020 & 2033
- Table 32: Israel Financial Modeling Service Revenue (million) Forecast, by Application 2020 & 2033
- Table 33: GCC Financial Modeling Service Revenue (million) Forecast, by Application 2020 & 2033
- Table 34: North Africa Financial Modeling Service Revenue (million) Forecast, by Application 2020 & 2033
- Table 35: South Africa Financial Modeling Service Revenue (million) Forecast, by Application 2020 & 2033
- Table 36: Rest of Middle East & Africa Financial Modeling Service Revenue (million) Forecast, by Application 2020 & 2033
- Table 37: Global Financial Modeling Service Revenue million Forecast, by Application 2020 & 2033
- Table 38: Global Financial Modeling Service Revenue million Forecast, by Type 2020 & 2033
- Table 39: Global Financial Modeling Service Revenue million Forecast, by Country 2020 & 2033
- Table 40: China Financial Modeling Service Revenue (million) Forecast, by Application 2020 & 2033
- Table 41: India Financial Modeling Service Revenue (million) Forecast, by Application 2020 & 2033
- Table 42: Japan Financial Modeling Service Revenue (million) Forecast, by Application 2020 & 2033
- Table 43: South Korea Financial Modeling Service Revenue (million) Forecast, by Application 2020 & 2033
- Table 44: ASEAN Financial Modeling Service Revenue (million) Forecast, by Application 2020 & 2033
- Table 45: Oceania Financial Modeling Service Revenue (million) Forecast, by Application 2020 & 2033
- Table 46: Rest of Asia Pacific Financial Modeling Service Revenue (million) Forecast, by Application 2020 & 2033
Frequently Asked Questions
1. What is the projected Compound Annual Growth Rate (CAGR) of the Financial Modeling Service?
The projected CAGR is approximately XXX%.
2. Which companies are prominent players in the Financial Modeling Service?
Key companies in the market include McKinsey & Company, Deloitte, PwC, KPMG, EY, Alvarez & Marsal, FTI Consulting, Grant Thornton, Accenture, Boston Consulting Group, Bain & Company, Aon, Capgemini, BlackRock, Goldman Sachs, J.P. Morgan Chase & Co., Morgan Stanley, Wells Fargo Securities, Credit Suisse, Deutsche Bank, UBS, Barclays, Citigroup, HSBC, Nomura.
3. What are the main segments of the Financial Modeling Service?
The market segments include Application, Type.
4. Can you provide details about the market size?
The market size is estimated to be USD XXX million as of 2022.
5. What are some drivers contributing to market growth?
N/A
6. What are the notable trends driving market growth?
N/A
7. Are there any restraints impacting market growth?
N/A
8. Can you provide examples of recent developments in the market?
N/A
9. What pricing options are available for accessing the report?
Pricing options include single-user, multi-user, and enterprise licenses priced at USD 3950.00, USD 5925.00, and USD 7900.00 respectively.
10. Is the market size provided in terms of value or volume?
The market size is provided in terms of value, measured in million.
11. Are there any specific market keywords associated with the report?
Yes, the market keyword associated with the report is "Financial Modeling Service," which aids in identifying and referencing the specific market segment covered.
12. How do I determine which pricing option suits my needs best?
The pricing options vary based on user requirements and access needs. Individual users may opt for single-user licenses, while businesses requiring broader access may choose multi-user or enterprise licenses for cost-effective access to the report.
13. Are there any additional resources or data provided in the Financial Modeling Service report?
While the report offers comprehensive insights, it's advisable to review the specific contents or supplementary materials provided to ascertain if additional resources or data are available.
14. How can I stay updated on further developments or reports in the Financial Modeling Service?
To stay informed about further developments, trends, and reports in the Financial Modeling Service, consider subscribing to industry newsletters, following relevant companies and organizations, or regularly checking reputable industry news sources and publications.
Methodology
Step 1 - Identification of Relevant Samples Size from Population Database


Step 2 - Approaches for Defining Global Market Size (Value, Volume* & Price*)

Note*: In applicable scenarios
Step 3 - Data Sources
Primary Research
- Web Analytics
- Survey Reports
- Research Institute
- Latest Research Reports
- Opinion Leaders
Secondary Research
- Annual Reports
- White Paper
- Latest Press Release
- Industry Association
- Paid Database
- Investor Presentations

Step 4 - Data Triangulation
Involves using different sources of information in order to increase the validity of a study
These sources are likely to be stakeholders in a program - participants, other researchers, program staff, other community members, and so on.
Then we put all data in single framework & apply various statistical tools to find out the dynamic on the market.
During the analysis stage, feedback from the stakeholder groups would be compared to determine areas of agreement as well as areas of divergence