
Key Insights
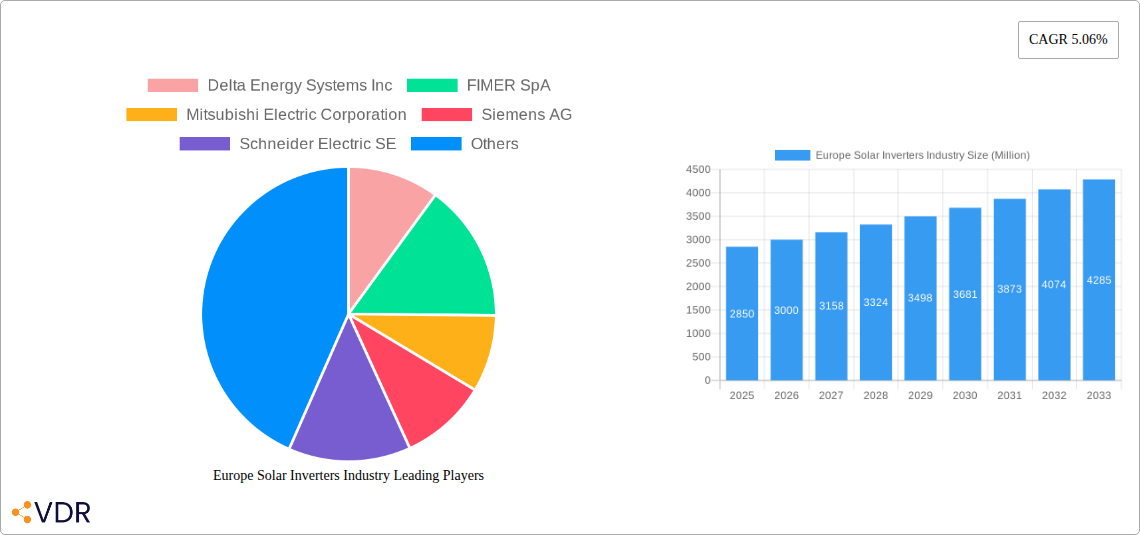
The European solar inverter market, valued at €2.85 billion in 2025, is experiencing robust growth, projected to expand at a Compound Annual Growth Rate (CAGR) of 5.06% from 2025 to 2033. This growth is fueled by several key drivers. The increasing adoption of renewable energy sources across Europe, driven by stringent environmental regulations and ambitious climate targets, is a significant factor. Furthermore, falling solar panel prices are making photovoltaic (PV) systems more cost-effective, boosting demand for inverters. Technological advancements, particularly in string inverters offering improved efficiency and enhanced monitoring capabilities, are also contributing to market expansion. The residential sector currently represents a significant portion of the market, with strong growth anticipated in the commercial and industrial sectors, driven by the increasing adoption of rooftop solar systems on businesses and factories. Germany, France, Italy, and the United Kingdom are key markets within Europe, representing a significant share of the overall market size. While the market faces some restraints, such as potential supply chain disruptions and the intermittent nature of solar power, the overall outlook remains positive, driven by continued government support for renewable energy initiatives and increasing consumer awareness of environmental sustainability.
The competitive landscape is characterized by a mix of established international players and regional manufacturers. Companies like Delta, FIMER, Mitsubishi, Siemens, Schneider Electric, Omron, KACO, Huawei, GE, and SMA Solar Technology hold significant market share, engaging in intense competition based on product innovation, pricing strategies, and service offerings. The market is segmented by inverter type (central, string, micro) and application (residential, commercial & industrial, utility-scale). String inverters are currently the most dominant segment, but microinverters are gaining traction due to their enhanced reliability and modularity. The growth trajectory of each segment will depend on various factors, including technological advancements, cost reductions, and policy support. Looking ahead, the European solar inverter market is poised for sustained growth, fueled by the expanding renewable energy sector and the region's commitment to carbon neutrality. This will likely result in increased competition and further innovation within the industry.
Europe Solar Inverters Industry: A Comprehensive Market Report (2019-2033)
This in-depth report provides a comprehensive analysis of the Europe solar inverters industry, covering market dynamics, growth trends, key players, and future outlook. The report utilizes data from 2019-2024 (historical period), with the base year being 2025 and a forecast period spanning 2025-2033. It segments the market by inverter type (central, string, micro) and application (residential, commercial & industrial, utility-scale), offering granular insights for informed decision-making. The analysis includes a detailed competitive landscape, highlighting key players and their market strategies. This report is essential for industry professionals, investors, and anyone seeking to understand the complexities and growth potential of the European solar inverter market. The expected market size for 2025 is xx Million units.
Europe Solar Inverters Industry Market Dynamics & Structure
This section analyzes the European solar inverter market's structure, encompassing market concentration, technological innovation, regulatory frameworks, competitive substitutes, end-user demographics, and M&A activity. The market exhibits moderate concentration, with key players holding significant shares.
- Market Concentration: The top 6 players (Delta Energy Systems Inc, FIMER SpA, Mitsubishi Electric Corporation, Siemens AG, Schneider Electric SE, Omron Corporation) account for approximately xx% of the market share in 2025. Further analysis reveals Huawei Technologies Co Ltd, General Electric Company, KACO New Energy GmbH and SMA Solar Technology AG as significant contributors. The report provides a detailed breakdown of market share percentages for each major player.
- Technological Innovation: Continuous advancements in inverter technology, including higher efficiency, improved power density, and enhanced grid integration capabilities, drive market growth. However, innovation faces barriers such as high R&D costs and the need for standardization.
- Regulatory Landscape: EU regulations supporting renewable energy and stringent grid integration standards influence market development. These regulations impact inverter design and certification processes.
- Competitive Substitutes: While few direct substitutes exist, the market competes indirectly with other renewable energy technologies.
- End-User Demographics: Growth is driven by the increasing demand for solar energy from residential, commercial & industrial, and utility-scale sectors, with the latter segment showing fastest growth.
- M&A Activity: The report analyzes the recent mergers and acquisitions (M&A) activity in the sector. xx major deals were recorded between 2019 and 2024, contributing to market consolidation. The total value of these transactions is estimated to be xx Million USD.
Europe Solar Inverters Industry Growth Trends & Insights
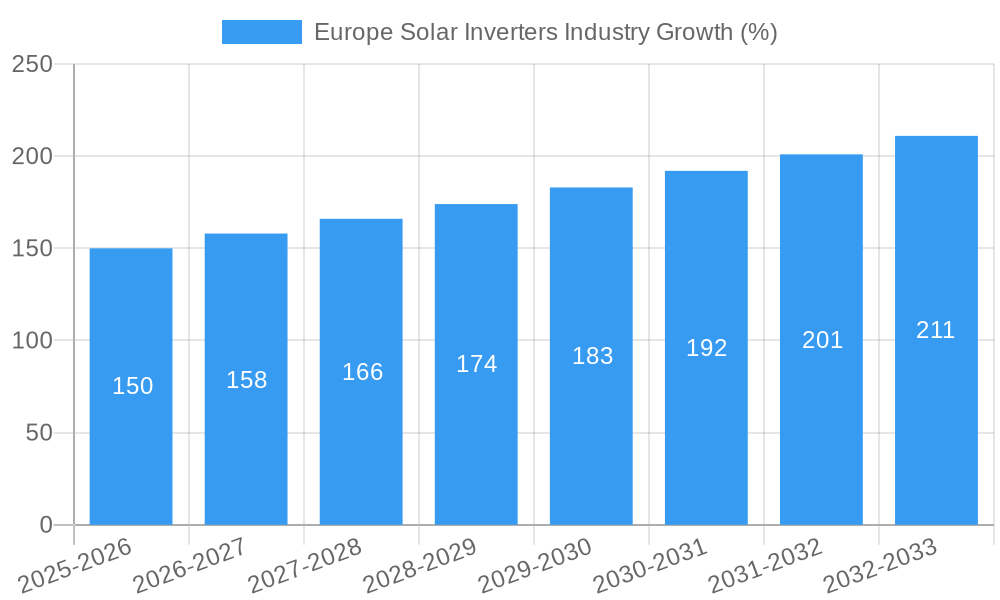
The European solar inverter market is experiencing robust growth, driven by supportive government policies, falling solar PV system costs, and increasing environmental awareness. The market size expanded significantly from xx Million units in 2019 to xx Million units in 2024, exhibiting a Compound Annual Growth Rate (CAGR) of xx%. This growth trajectory is expected to continue with a CAGR of xx% during the forecast period (2025-2033), reaching an estimated xx Million units by 2033. Market penetration is increasing rapidly in residential and commercial sectors, while the utility-scale sector shows the highest growth potential. Technological disruptions, such as the emergence of advanced inverter topologies and smart grid integration solutions, are reshaping the market landscape. Changing consumer preferences are reflected in higher demand for high-efficiency and intelligent inverters with integrated monitoring capabilities.
Dominant Regions, Countries, or Segments in Europe Solar Inverters Industry
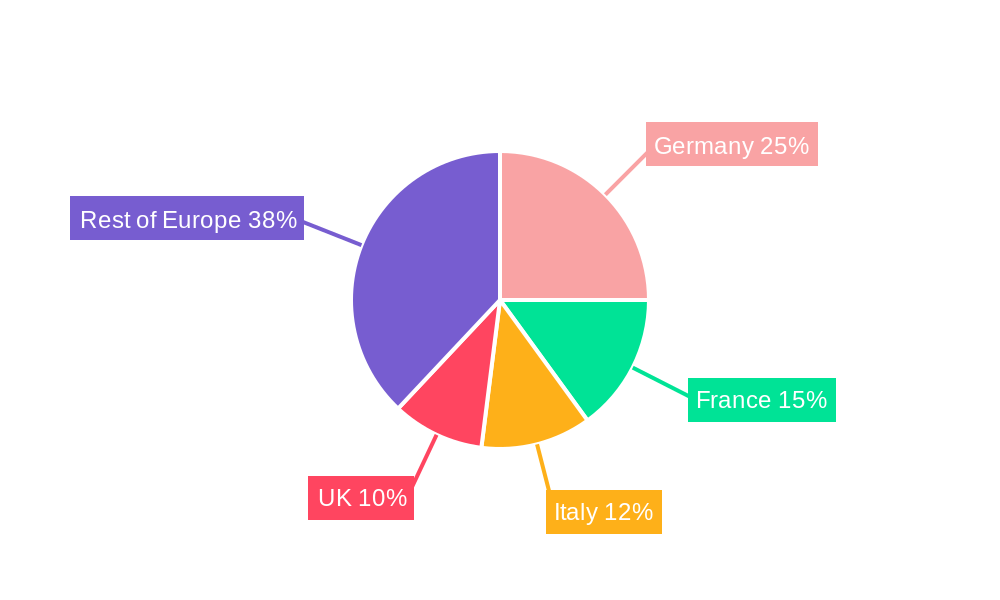
Germany, France, and Italy are the leading markets for solar inverters within Europe. These countries benefit from supportive renewable energy policies, favorable solar irradiation levels, and well-established PV infrastructure. The utility-scale segment demonstrates the most significant growth potential, driven by large-scale solar park developments.
- Germany: Strong government support for renewables, a mature solar industry, and substantial investments in utility-scale projects make Germany a key market.
- France: Increasing adoption of solar PV in both residential and commercial sectors fuels inverter demand.
- Italy: Significant growth in the utility-scale segment is boosting market expansion.
- Inverter Types: String inverters currently dominate the market due to their cost-effectiveness and suitability for various applications. However, microinverters are gaining traction due to their modularity and enhanced performance. Central inverters maintain a substantial share in the utility-scale segment.
- Applications: The utility-scale segment is the fastest-growing, closely followed by the commercial & industrial sector. Residential installations contribute a substantial share but exhibit a comparatively slower growth rate.
Europe Solar Inverters Industry Product Landscape
The European solar inverter market offers a diverse range of products catering to different applications and customer needs. String inverters remain popular for their cost-effectiveness, while central inverters are favored for large-scale projects. Microinverters offer enhanced performance and safety features but command a higher price point. Significant advancements are observed in areas such as increased efficiency, improved power density, and enhanced grid-integration capabilities. Many leading companies offer inverters with smart features like remote monitoring and optimized energy management, adding value to their products. The focus is on energy efficiency, grid compatibility, and enhanced performance, along with integrated monitoring and control capabilities.
Key Drivers, Barriers & Challenges in Europe Solar Inverters Industry
Key Drivers:
- Strong government support for renewable energy through subsidies, tax incentives, and feed-in tariffs.
- Falling solar PV system costs making solar energy more affordable.
- Increasing awareness about environmental sustainability and the need for clean energy.
Challenges and Restraints:
- Supply chain disruptions affecting the availability of raw materials and components. (Impact: xx% increase in inverter costs in 2024)
- Stringent grid integration standards and certification processes increase development costs and time-to-market.
- Intense competition amongst manufacturers leads to price pressure.
Emerging Opportunities in Europe Solar Inverters Industry
- Growing demand for energy storage solutions creating opportunities for inverters with integrated battery management systems.
- Increased focus on smart grid integration opens opportunities for advanced inverters with grid services capabilities.
- Expansion into rural and underserved regions presents untapped market potential.
Growth Accelerators in the Europe Solar Inverters Industry
The long-term growth of the European solar inverter market will be fueled by continued advancements in inverter technology, resulting in higher efficiency, greater power density, and enhanced grid-integration capabilities. Strategic partnerships between inverter manufacturers and solar PV developers will accelerate market penetration. Expansion into new markets and emerging applications, such as electric vehicle charging and energy storage systems, will further drive growth.
Key Players Shaping the Europe Solar Inverters Industry Market
- Delta Energy Systems Inc
- FIMER SpA
- Mitsubishi Electric Corporation
- Siemens AG
- Schneider Electric SE
- Omron Corporation
- KACO New Energy GmbH
- Huawei Technologies Co Ltd
- General Electric Company
- SMA Solar Technology AG
Notable Milestones in Europe Solar Inverters Industry Sector
- June 2022: SMA Solar Technology AG announced plans to build a new gigawatt solar inverter manufacturing facility in Niestetal, Germany, aiming to double production capacity by 2024. This significantly increases manufacturing capacity and reinforces SMA’s market position.
- April 2022: SMA Solar Technology AG launched four new Sunny Tripower-X inverter models (12kW, 15kW, 20kW, and 25kW) for commercial and residential applications, enhancing product offerings and competitiveness.
In-Depth Europe Solar Inverters Industry Market Outlook
The European solar inverter market is poised for sustained growth driven by favorable government policies, increasing renewable energy targets, and technological advancements. Significant opportunities exist in the utility-scale segment, energy storage integration, and smart grid applications. Strategic partnerships and investments in R&D will play a crucial role in shaping the future of this dynamic market. The market’s expansion will be significantly influenced by the continued evolution of inverter technology, resulting in enhanced efficiency, cost reductions, and improved integration with smart grid infrastructure. Companies that adapt quickly to these trends and invest in innovative technologies are expected to capture the lion's share of market opportunities.
Europe Solar Inverters Industry Segmentation
-
1. Inverter Type
- 1.1. Central Inverters
- 1.2. String Inverters
- 1.3. Micro Inverters
-
2. Application
- 2.1. Residential
- 2.2. Commercial and Industrial
- 2.3. Utility-scale
Europe Solar Inverters Industry Segmentation By Geography
- 1. Germany
- 2. United Kingdom
- 3. France
- 4. Spain
- 5. Italy
- 6. Nordic Countries
- 7. Turkey
- 8. Russia
- 9. Rest of Europe
Europe Solar Inverters Industry REPORT HIGHLIGHTS
| Aspects | Details |
|---|---|
| Study Period | 2019-2033 |
| Base Year | 2024 |
| Estimated Year | 2025 |
| Forecast Period | 2025-2033 |
| Historical Period | 2019-2024 |
| Growth Rate | CAGR of 5.06% from 2019-2033 |
| Segmentation |
|
Table of Contents
- 1. Introduction
- 1.1. Research Scope
- 1.2. Market Segmentation
- 1.3. Research Methodology
- 1.4. Definitions and Assumptions
- 2. Executive Summary
- 2.1. Introduction
- 3. Market Dynamics
- 3.1. Introduction
- 3.2. Market Drivers
- 3.2.1. 4.; Supportive Government Initiatives4.; Investment in Electrification Using Solar Energy
- 3.3. Market Restrains
- 3.3.1 4.; Lack of General Awareness
- 3.3.2 Infrastructure Development Costs
- 3.3.3 and Recent Subsidy Cuts on Solar Panels
- 3.4. Market Trends
- 3.4.1. Central Inverters Expected to Dominate the Market
- 4. Market Factor Analysis
- 4.1. Porters Five Forces
- 4.2. Supply/Value Chain
- 4.3. PESTEL analysis
- 4.4. Market Entropy
- 4.5. Patent/Trademark Analysis
- 5. Europe Solar Inverters Industry Analysis, Insights and Forecast, 2019-2031
- 5.1. Market Analysis, Insights and Forecast - by Inverter Type
- 5.1.1. Central Inverters
- 5.1.2. String Inverters
- 5.1.3. Micro Inverters
- 5.2. Market Analysis, Insights and Forecast - by Application
- 5.2.1. Residential
- 5.2.2. Commercial and Industrial
- 5.2.3. Utility-scale
- 5.3. Market Analysis, Insights and Forecast - by Region
- 5.3.1. Germany
- 5.3.2. United Kingdom
- 5.3.3. France
- 5.3.4. Spain
- 5.3.5. Italy
- 5.3.6. Nordic Countries
- 5.3.7. Turkey
- 5.3.8. Russia
- 5.3.9. Rest of Europe
- 5.1. Market Analysis, Insights and Forecast - by Inverter Type
- 6. Germany Europe Solar Inverters Industry Analysis, Insights and Forecast, 2019-2031
- 6.1. Market Analysis, Insights and Forecast - by Inverter Type
- 6.1.1. Central Inverters
- 6.1.2. String Inverters
- 6.1.3. Micro Inverters
- 6.2. Market Analysis, Insights and Forecast - by Application
- 6.2.1. Residential
- 6.2.2. Commercial and Industrial
- 6.2.3. Utility-scale
- 6.1. Market Analysis, Insights and Forecast - by Inverter Type
- 7. United Kingdom Europe Solar Inverters Industry Analysis, Insights and Forecast, 2019-2031
- 7.1. Market Analysis, Insights and Forecast - by Inverter Type
- 7.1.1. Central Inverters
- 7.1.2. String Inverters
- 7.1.3. Micro Inverters
- 7.2. Market Analysis, Insights and Forecast - by Application
- 7.2.1. Residential
- 7.2.2. Commercial and Industrial
- 7.2.3. Utility-scale
- 7.1. Market Analysis, Insights and Forecast - by Inverter Type
- 8. France Europe Solar Inverters Industry Analysis, Insights and Forecast, 2019-2031
- 8.1. Market Analysis, Insights and Forecast - by Inverter Type
- 8.1.1. Central Inverters
- 8.1.2. String Inverters
- 8.1.3. Micro Inverters
- 8.2. Market Analysis, Insights and Forecast - by Application
- 8.2.1. Residential
- 8.2.2. Commercial and Industrial
- 8.2.3. Utility-scale
- 8.1. Market Analysis, Insights and Forecast - by Inverter Type
- 9. Spain Europe Solar Inverters Industry Analysis, Insights and Forecast, 2019-2031
- 9.1. Market Analysis, Insights and Forecast - by Inverter Type
- 9.1.1. Central Inverters
- 9.1.2. String Inverters
- 9.1.3. Micro Inverters
- 9.2. Market Analysis, Insights and Forecast - by Application
- 9.2.1. Residential
- 9.2.2. Commercial and Industrial
- 9.2.3. Utility-scale
- 9.1. Market Analysis, Insights and Forecast - by Inverter Type
- 10. Italy Europe Solar Inverters Industry Analysis, Insights and Forecast, 2019-2031
- 10.1. Market Analysis, Insights and Forecast - by Inverter Type
- 10.1.1. Central Inverters
- 10.1.2. String Inverters
- 10.1.3. Micro Inverters
- 10.2. Market Analysis, Insights and Forecast - by Application
- 10.2.1. Residential
- 10.2.2. Commercial and Industrial
- 10.2.3. Utility-scale
- 10.1. Market Analysis, Insights and Forecast - by Inverter Type
- 11. Nordic Countries Europe Solar Inverters Industry Analysis, Insights and Forecast, 2019-2031
- 11.1. Market Analysis, Insights and Forecast - by Inverter Type
- 11.1.1. Central Inverters
- 11.1.2. String Inverters
- 11.1.3. Micro Inverters
- 11.2. Market Analysis, Insights and Forecast - by Application
- 11.2.1. Residential
- 11.2.2. Commercial and Industrial
- 11.2.3. Utility-scale
- 11.1. Market Analysis, Insights and Forecast - by Inverter Type
- 12. Turkey Europe Solar Inverters Industry Analysis, Insights and Forecast, 2019-2031
- 12.1. Market Analysis, Insights and Forecast - by Inverter Type
- 12.1.1. Central Inverters
- 12.1.2. String Inverters
- 12.1.3. Micro Inverters
- 12.2. Market Analysis, Insights and Forecast - by Application
- 12.2.1. Residential
- 12.2.2. Commercial and Industrial
- 12.2.3. Utility-scale
- 12.1. Market Analysis, Insights and Forecast - by Inverter Type
- 13. Russia Europe Solar Inverters Industry Analysis, Insights and Forecast, 2019-2031
- 13.1. Market Analysis, Insights and Forecast - by Inverter Type
- 13.1.1. Central Inverters
- 13.1.2. String Inverters
- 13.1.3. Micro Inverters
- 13.2. Market Analysis, Insights and Forecast - by Application
- 13.2.1. Residential
- 13.2.2. Commercial and Industrial
- 13.2.3. Utility-scale
- 13.1. Market Analysis, Insights and Forecast - by Inverter Type
- 14. Rest of Europe Europe Solar Inverters Industry Analysis, Insights and Forecast, 2019-2031
- 14.1. Market Analysis, Insights and Forecast - by Inverter Type
- 14.1.1. Central Inverters
- 14.1.2. String Inverters
- 14.1.3. Micro Inverters
- 14.2. Market Analysis, Insights and Forecast - by Application
- 14.2.1. Residential
- 14.2.2. Commercial and Industrial
- 14.2.3. Utility-scale
- 14.1. Market Analysis, Insights and Forecast - by Inverter Type
- 15. Germany Europe Solar Inverters Industry Analysis, Insights and Forecast, 2019-2031
- 16. France Europe Solar Inverters Industry Analysis, Insights and Forecast, 2019-2031
- 17. Italy Europe Solar Inverters Industry Analysis, Insights and Forecast, 2019-2031
- 18. United Kingdom Europe Solar Inverters Industry Analysis, Insights and Forecast, 2019-2031
- 19. Netherlands Europe Solar Inverters Industry Analysis, Insights and Forecast, 2019-2031
- 20. Sweden Europe Solar Inverters Industry Analysis, Insights and Forecast, 2019-2031
- 21. Rest of Europe Europe Solar Inverters Industry Analysis, Insights and Forecast, 2019-2031
- 22. Competitive Analysis
- 22.1. Market Share Analysis 2024
- 22.2. Company Profiles
- 22.2.1 Delta Energy Systems Inc
- 22.2.1.1. Overview
- 22.2.1.2. Products
- 22.2.1.3. SWOT Analysis
- 22.2.1.4. Recent Developments
- 22.2.1.5. Financials (Based on Availability)
- 22.2.2 FIMER SpA
- 22.2.2.1. Overview
- 22.2.2.2. Products
- 22.2.2.3. SWOT Analysis
- 22.2.2.4. Recent Developments
- 22.2.2.5. Financials (Based on Availability)
- 22.2.3 Mitsubishi Electric Corporation
- 22.2.3.1. Overview
- 22.2.3.2. Products
- 22.2.3.3. SWOT Analysis
- 22.2.3.4. Recent Developments
- 22.2.3.5. Financials (Based on Availability)
- 22.2.4 Siemens AG
- 22.2.4.1. Overview
- 22.2.4.2. Products
- 22.2.4.3. SWOT Analysis
- 22.2.4.4. Recent Developments
- 22.2.4.5. Financials (Based on Availability)
- 22.2.5 Schneider Electric SE
- 22.2.5.1. Overview
- 22.2.5.2. Products
- 22.2.5.3. SWOT Analysis
- 22.2.5.4. Recent Developments
- 22.2.5.5. Financials (Based on Availability)
- 22.2.6 Omron Corporation
- 22.2.6.1. Overview
- 22.2.6.2. Products
- 22.2.6.3. SWOT Analysis
- 22.2.6.4. Recent Developments
- 22.2.6.5. Financials (Based on Availability)
- 22.2.7 KACO New Energy GmbH*List Not Exhaustive 6 4 Market Ranking/Share Analysi
- 22.2.7.1. Overview
- 22.2.7.2. Products
- 22.2.7.3. SWOT Analysis
- 22.2.7.4. Recent Developments
- 22.2.7.5. Financials (Based on Availability)
- 22.2.8 Huawei Technologies Co Ltd
- 22.2.8.1. Overview
- 22.2.8.2. Products
- 22.2.8.3. SWOT Analysis
- 22.2.8.4. Recent Developments
- 22.2.8.5. Financials (Based on Availability)
- 22.2.9 General Electric Company
- 22.2.9.1. Overview
- 22.2.9.2. Products
- 22.2.9.3. SWOT Analysis
- 22.2.9.4. Recent Developments
- 22.2.9.5. Financials (Based on Availability)
- 22.2.10 SMA Solar Technology AG
- 22.2.10.1. Overview
- 22.2.10.2. Products
- 22.2.10.3. SWOT Analysis
- 22.2.10.4. Recent Developments
- 22.2.10.5. Financials (Based on Availability)
- 22.2.1 Delta Energy Systems Inc
List of Figures
- Figure 1: Europe Solar Inverters Industry Revenue Breakdown (Million, %) by Product 2024 & 2032
- Figure 2: Europe Solar Inverters Industry Share (%) by Company 2024
List of Tables
- Table 1: Europe Solar Inverters Industry Revenue Million Forecast, by Region 2019 & 2032
- Table 2: Europe Solar Inverters Industry Volume K Unit Forecast, by Region 2019 & 2032
- Table 3: Europe Solar Inverters Industry Revenue Million Forecast, by Inverter Type 2019 & 2032
- Table 4: Europe Solar Inverters Industry Volume K Unit Forecast, by Inverter Type 2019 & 2032
- Table 5: Europe Solar Inverters Industry Revenue Million Forecast, by Application 2019 & 2032
- Table 6: Europe Solar Inverters Industry Volume K Unit Forecast, by Application 2019 & 2032
- Table 7: Europe Solar Inverters Industry Revenue Million Forecast, by Region 2019 & 2032
- Table 8: Europe Solar Inverters Industry Volume K Unit Forecast, by Region 2019 & 2032
- Table 9: Europe Solar Inverters Industry Revenue Million Forecast, by Country 2019 & 2032
- Table 10: Europe Solar Inverters Industry Volume K Unit Forecast, by Country 2019 & 2032
- Table 11: Germany Europe Solar Inverters Industry Revenue (Million) Forecast, by Application 2019 & 2032
- Table 12: Germany Europe Solar Inverters Industry Volume (K Unit) Forecast, by Application 2019 & 2032
- Table 13: France Europe Solar Inverters Industry Revenue (Million) Forecast, by Application 2019 & 2032
- Table 14: France Europe Solar Inverters Industry Volume (K Unit) Forecast, by Application 2019 & 2032
- Table 15: Italy Europe Solar Inverters Industry Revenue (Million) Forecast, by Application 2019 & 2032
- Table 16: Italy Europe Solar Inverters Industry Volume (K Unit) Forecast, by Application 2019 & 2032
- Table 17: United Kingdom Europe Solar Inverters Industry Revenue (Million) Forecast, by Application 2019 & 2032
- Table 18: United Kingdom Europe Solar Inverters Industry Volume (K Unit) Forecast, by Application 2019 & 2032
- Table 19: Netherlands Europe Solar Inverters Industry Revenue (Million) Forecast, by Application 2019 & 2032
- Table 20: Netherlands Europe Solar Inverters Industry Volume (K Unit) Forecast, by Application 2019 & 2032
- Table 21: Sweden Europe Solar Inverters Industry Revenue (Million) Forecast, by Application 2019 & 2032
- Table 22: Sweden Europe Solar Inverters Industry Volume (K Unit) Forecast, by Application 2019 & 2032
- Table 23: Rest of Europe Europe Solar Inverters Industry Revenue (Million) Forecast, by Application 2019 & 2032
- Table 24: Rest of Europe Europe Solar Inverters Industry Volume (K Unit) Forecast, by Application 2019 & 2032
- Table 25: Europe Solar Inverters Industry Revenue Million Forecast, by Inverter Type 2019 & 2032
- Table 26: Europe Solar Inverters Industry Volume K Unit Forecast, by Inverter Type 2019 & 2032
- Table 27: Europe Solar Inverters Industry Revenue Million Forecast, by Application 2019 & 2032
- Table 28: Europe Solar Inverters Industry Volume K Unit Forecast, by Application 2019 & 2032
- Table 29: Europe Solar Inverters Industry Revenue Million Forecast, by Country 2019 & 2032
- Table 30: Europe Solar Inverters Industry Volume K Unit Forecast, by Country 2019 & 2032
- Table 31: Europe Solar Inverters Industry Revenue Million Forecast, by Inverter Type 2019 & 2032
- Table 32: Europe Solar Inverters Industry Volume K Unit Forecast, by Inverter Type 2019 & 2032
- Table 33: Europe Solar Inverters Industry Revenue Million Forecast, by Application 2019 & 2032
- Table 34: Europe Solar Inverters Industry Volume K Unit Forecast, by Application 2019 & 2032
- Table 35: Europe Solar Inverters Industry Revenue Million Forecast, by Country 2019 & 2032
- Table 36: Europe Solar Inverters Industry Volume K Unit Forecast, by Country 2019 & 2032
- Table 37: Europe Solar Inverters Industry Revenue Million Forecast, by Inverter Type 2019 & 2032
- Table 38: Europe Solar Inverters Industry Volume K Unit Forecast, by Inverter Type 2019 & 2032
- Table 39: Europe Solar Inverters Industry Revenue Million Forecast, by Application 2019 & 2032
- Table 40: Europe Solar Inverters Industry Volume K Unit Forecast, by Application 2019 & 2032
- Table 41: Europe Solar Inverters Industry Revenue Million Forecast, by Country 2019 & 2032
- Table 42: Europe Solar Inverters Industry Volume K Unit Forecast, by Country 2019 & 2032
- Table 43: Europe Solar Inverters Industry Revenue Million Forecast, by Inverter Type 2019 & 2032
- Table 44: Europe Solar Inverters Industry Volume K Unit Forecast, by Inverter Type 2019 & 2032
- Table 45: Europe Solar Inverters Industry Revenue Million Forecast, by Application 2019 & 2032
- Table 46: Europe Solar Inverters Industry Volume K Unit Forecast, by Application 2019 & 2032
- Table 47: Europe Solar Inverters Industry Revenue Million Forecast, by Country 2019 & 2032
- Table 48: Europe Solar Inverters Industry Volume K Unit Forecast, by Country 2019 & 2032
- Table 49: Europe Solar Inverters Industry Revenue Million Forecast, by Inverter Type 2019 & 2032
- Table 50: Europe Solar Inverters Industry Volume K Unit Forecast, by Inverter Type 2019 & 2032
- Table 51: Europe Solar Inverters Industry Revenue Million Forecast, by Application 2019 & 2032
- Table 52: Europe Solar Inverters Industry Volume K Unit Forecast, by Application 2019 & 2032
- Table 53: Europe Solar Inverters Industry Revenue Million Forecast, by Country 2019 & 2032
- Table 54: Europe Solar Inverters Industry Volume K Unit Forecast, by Country 2019 & 2032
- Table 55: Europe Solar Inverters Industry Revenue Million Forecast, by Inverter Type 2019 & 2032
- Table 56: Europe Solar Inverters Industry Volume K Unit Forecast, by Inverter Type 2019 & 2032
- Table 57: Europe Solar Inverters Industry Revenue Million Forecast, by Application 2019 & 2032
- Table 58: Europe Solar Inverters Industry Volume K Unit Forecast, by Application 2019 & 2032
- Table 59: Europe Solar Inverters Industry Revenue Million Forecast, by Country 2019 & 2032
- Table 60: Europe Solar Inverters Industry Volume K Unit Forecast, by Country 2019 & 2032
- Table 61: Europe Solar Inverters Industry Revenue Million Forecast, by Inverter Type 2019 & 2032
- Table 62: Europe Solar Inverters Industry Volume K Unit Forecast, by Inverter Type 2019 & 2032
- Table 63: Europe Solar Inverters Industry Revenue Million Forecast, by Application 2019 & 2032
- Table 64: Europe Solar Inverters Industry Volume K Unit Forecast, by Application 2019 & 2032
- Table 65: Europe Solar Inverters Industry Revenue Million Forecast, by Country 2019 & 2032
- Table 66: Europe Solar Inverters Industry Volume K Unit Forecast, by Country 2019 & 2032
- Table 67: Europe Solar Inverters Industry Revenue Million Forecast, by Inverter Type 2019 & 2032
- Table 68: Europe Solar Inverters Industry Volume K Unit Forecast, by Inverter Type 2019 & 2032
- Table 69: Europe Solar Inverters Industry Revenue Million Forecast, by Application 2019 & 2032
- Table 70: Europe Solar Inverters Industry Volume K Unit Forecast, by Application 2019 & 2032
- Table 71: Europe Solar Inverters Industry Revenue Million Forecast, by Country 2019 & 2032
- Table 72: Europe Solar Inverters Industry Volume K Unit Forecast, by Country 2019 & 2032
- Table 73: Europe Solar Inverters Industry Revenue Million Forecast, by Inverter Type 2019 & 2032
- Table 74: Europe Solar Inverters Industry Volume K Unit Forecast, by Inverter Type 2019 & 2032
- Table 75: Europe Solar Inverters Industry Revenue Million Forecast, by Application 2019 & 2032
- Table 76: Europe Solar Inverters Industry Volume K Unit Forecast, by Application 2019 & 2032
- Table 77: Europe Solar Inverters Industry Revenue Million Forecast, by Country 2019 & 2032
- Table 78: Europe Solar Inverters Industry Volume K Unit Forecast, by Country 2019 & 2032
Frequently Asked Questions
1. What is the projected Compound Annual Growth Rate (CAGR) of the Europe Solar Inverters Industry?
The projected CAGR is approximately 5.06%.
2. Which companies are prominent players in the Europe Solar Inverters Industry?
Key companies in the market include Delta Energy Systems Inc, FIMER SpA, Mitsubishi Electric Corporation, Siemens AG, Schneider Electric SE, Omron Corporation, KACO New Energy GmbH*List Not Exhaustive 6 4 Market Ranking/Share Analysi, Huawei Technologies Co Ltd, General Electric Company, SMA Solar Technology AG.
3. What are the main segments of the Europe Solar Inverters Industry?
The market segments include Inverter Type, Application.
4. Can you provide details about the market size?
The market size is estimated to be USD 2.85 Million as of 2022.
5. What are some drivers contributing to market growth?
4.; Supportive Government Initiatives4.; Investment in Electrification Using Solar Energy.
6. What are the notable trends driving market growth?
Central Inverters Expected to Dominate the Market.
7. Are there any restraints impacting market growth?
4.; Lack of General Awareness. Infrastructure Development Costs. and Recent Subsidy Cuts on Solar Panels.
8. Can you provide examples of recent developments in the market?
June 2022: SMA Solar Technology AG announced plans to build a solar inverter manufacturing facility in Niestetal, Germany. The new gigawatt factory is a part of the company’s target to double the production capacity from 21GW (present) to 40GW by 2024. The construction was expected to begin by the end of 2022.
9. What pricing options are available for accessing the report?
Pricing options include single-user, multi-user, and enterprise licenses priced at USD 4750, USD 5250, and USD 8750 respectively.
10. Is the market size provided in terms of value or volume?
The market size is provided in terms of value, measured in Million and volume, measured in K Unit.
11. Are there any specific market keywords associated with the report?
Yes, the market keyword associated with the report is "Europe Solar Inverters Industry," which aids in identifying and referencing the specific market segment covered.
12. How do I determine which pricing option suits my needs best?
The pricing options vary based on user requirements and access needs. Individual users may opt for single-user licenses, while businesses requiring broader access may choose multi-user or enterprise licenses for cost-effective access to the report.
13. Are there any additional resources or data provided in the Europe Solar Inverters Industry report?
While the report offers comprehensive insights, it's advisable to review the specific contents or supplementary materials provided to ascertain if additional resources or data are available.
14. How can I stay updated on further developments or reports in the Europe Solar Inverters Industry?
To stay informed about further developments, trends, and reports in the Europe Solar Inverters Industry, consider subscribing to industry newsletters, following relevant companies and organizations, or regularly checking reputable industry news sources and publications.
Methodology
Step 1 - Identification of Relevant Samples Size from Population Database


Step 2 - Approaches for Defining Global Market Size (Value, Volume* & Price*)

Note*: In applicable scenarios
Step 3 - Data Sources
Primary Research
- Web Analytics
- Survey Reports
- Research Institute
- Latest Research Reports
- Opinion Leaders
Secondary Research
- Annual Reports
- White Paper
- Latest Press Release
- Industry Association
- Paid Database
- Investor Presentations

Step 4 - Data Triangulation
Involves using different sources of information in order to increase the validity of a study
These sources are likely to be stakeholders in a program - participants, other researchers, program staff, other community members, and so on.
Then we put all data in single framework & apply various statistical tools to find out the dynamic on the market.
During the analysis stage, feedback from the stakeholder groups would be compared to determine areas of agreement as well as areas of divergence


