
Key Insights
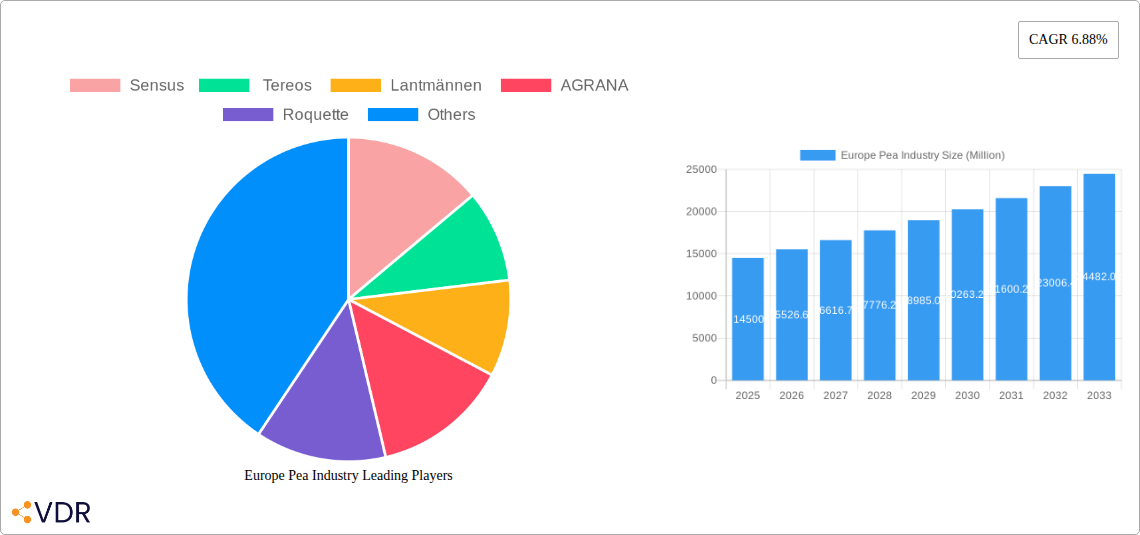
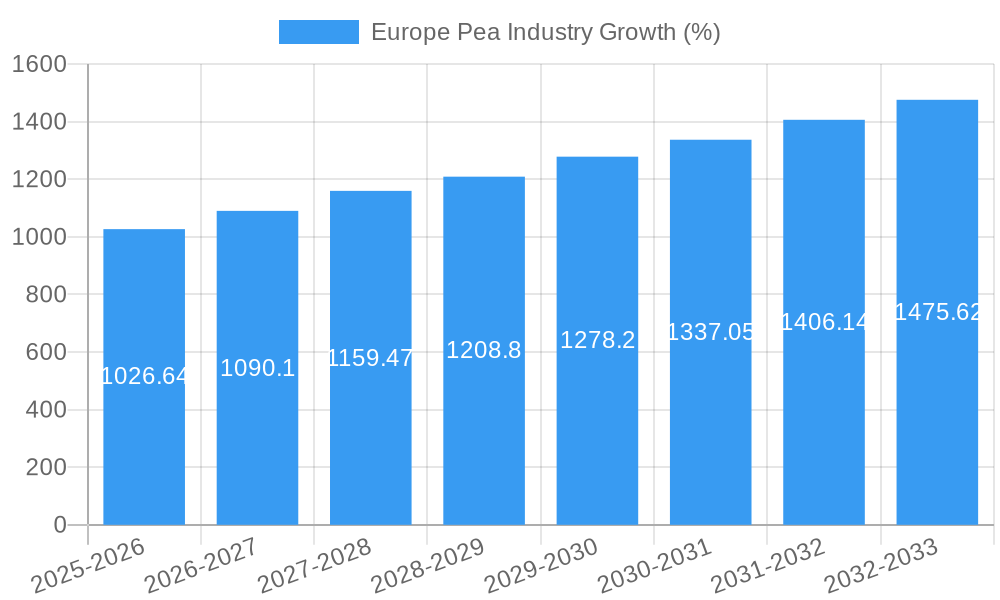
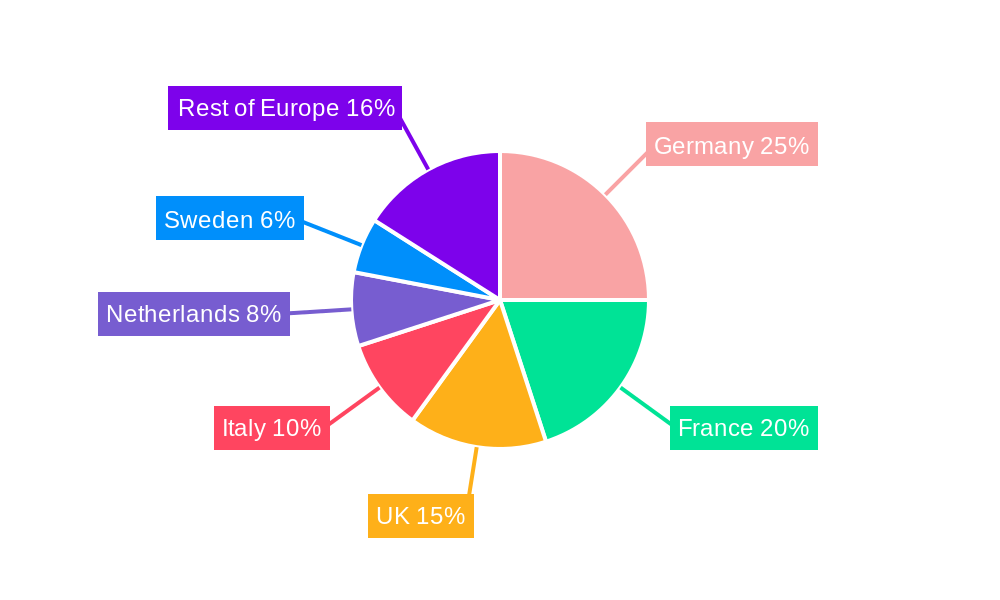
The European pea industry, valued at €14.50 billion in 2025, is projected to experience robust growth, driven by increasing consumer demand for plant-based protein and the expanding use of peas in food and non-food applications. A Compound Annual Growth Rate (CAGR) of 6.88% is anticipated from 2025 to 2033, indicating a substantial market expansion. Key drivers include the rising popularity of vegan and vegetarian diets, growing awareness of pea protein's health benefits, and the increasing utilization of peas in diverse sectors such as food processing, animal feed, and biomaterials. This growth is further fueled by continuous innovation in pea processing technologies, leading to improved product quality and efficiency. While challenges like fluctuating agricultural yields and potential competition from other protein sources exist, the overall outlook for the European pea market remains positive. Germany, France, and the United Kingdom represent the largest national markets within the region, exhibiting significant growth potential. The presence of established players like Sensus, Tereos, Lantmännen, AGRANA, and Roquette indicates a competitive yet innovative landscape.
Regional variations in production and pricing are expected, with countries like Russia and Ukraine contributing significantly to production while others, like France and the Netherlands, may show stronger price fluctuations due to differing production levels and market dynamics. The analysis considers factors like weather patterns, government policies supporting sustainable agriculture, and evolving consumer preferences in its projection of future market trends. Competition among major players, coupled with the entrance of smaller regional processors, is driving innovation and offering consumers a diverse range of pea-based products. The long-term outlook for this industry hinges on sustained consumer demand and the continued development of sustainable and efficient production methods.
Europe Pea Industry Market Report: 2019-2033
This comprehensive report provides an in-depth analysis of the Europe pea industry, encompassing market dynamics, growth trends, regional performance, product landscape, and key players. With a focus on the parent market (agricultural commodities) and child markets (food processing, animal feed), this report is essential for industry professionals, investors, and strategic decision-makers. The study period covers 2019-2033, with a base year of 2025 and a forecast period of 2025-2033. Market values are presented in million units.
Europe Pea Industry Market Dynamics & Structure
This section analyzes the competitive landscape of the European pea industry, encompassing market concentration, technological advancements, regulatory influences, and market trends. The report delves into the interplay of factors shaping the market, including:
- Market Concentration: The European pea market exhibits a moderately concentrated structure with a few dominant players controlling a significant share. The top five companies (Sensus, Tereos, Lantmännen, AGRANA, and Roquette) collectively hold an estimated xx% market share in 2025. This concentration is anticipated to remain relatively stable over the forecast period.
- Technological Innovation: Ongoing technological advancements in pea processing, including improved extraction techniques for protein and starch, are driving efficiency gains and product diversification. However, high capital investments required for adopting new technologies pose a barrier to entry for smaller players.
- Regulatory Framework: EU regulations pertaining to food safety, labeling, and sustainability are crucial factors affecting market operations. Compliance costs and evolving regulations present both challenges and opportunities for industry participants.
- Competitive Product Substitutes: The pea industry faces competition from other protein sources like soy, lentils, and wheat. However, the rising demand for plant-based alternatives and the functional properties of pea protein are expected to offset some of this competitive pressure.
- End-User Demographics: The growth of the plant-based food and feed sector is the primary driver of demand for peas in Europe. Changing consumer preferences towards healthier and sustainable diets are significantly influencing pea consumption patterns.
- M&A Trends: Recent years have witnessed a moderate level of mergers and acquisitions activity within the European pea industry, reflecting consolidation efforts and strategic expansion moves. An estimated xx M&A deals occurred between 2019 and 2024, predominantly focused on consolidating processing capabilities and expanding market reach.
Europe Pea Industry Growth Trends & Insights
Utilizing comprehensive market data, this section provides a detailed analysis of the European pea industry’s growth trajectory. The report examines historical growth patterns (2019-2024) and projects future trends (2025-2033). Key metrics analyzed include:
- Market Size Evolution: The European pea market experienced a CAGR of xx% between 2019 and 2024, reaching a value of xx million units in 2024. The market is projected to continue its growth trajectory, with a forecasted CAGR of xx% from 2025 to 2033, reaching a value of xx million units by 2033.
- Adoption Rates: The increasing adoption of pea-based ingredients in food products like meat alternatives, dairy substitutes, and snacks is a key driver of market growth. The market penetration rate for pea protein is projected to increase from xx% in 2025 to xx% by 2033.
- Technological Disruptions: Advancements in pea processing technologies, particularly in the extraction and purification of pea protein and starch, are enhancing the functionality and value proposition of pea-based ingredients, further fueling market expansion.
- Consumer Behavior Shifts: The rising awareness of the environmental and health benefits of plant-based diets, along with increasing vegan and vegetarian lifestyles, is driving consumer demand for pea-based products.
Dominant Regions, Countries, or Segments in Europe Pea Industry
This section pinpoints the key regions and countries contributing most significantly to the European pea market’s growth, including:
- Russia: Production Analysis: Russia is a significant producer of peas in Europe, contributing xx million units to the overall regional production in 2024. Production is expected to grow at a CAGR of xx% from 2025 to 2033. Key drivers include favorable climatic conditions and government support for agricultural production.
- Price Trend Analysis: Ukraine, France, Spain, Netherlands, and Rest of Europe exhibit varying price trends influenced by factors like weather patterns, production levels, and international trade dynamics. For example, Ukraine's pea prices showed significant volatility in 2022 due to geopolitical factors. The report provides a detailed analysis of price fluctuations in each region, highlighting the impact on producers and consumers.
- France: France stands out as a major consumer of peas, driven by a thriving food processing industry and a growing demand for plant-based products. Its well-developed agricultural infrastructure and government support for the sector contribute to its dominance.
- Other Key Regions: The report analyzes the market dynamics in Spain, the Netherlands, and the rest of Europe, offering insights into specific growth drivers and challenges in each region. Factors such as government policies promoting sustainable agriculture, the availability of land suitable for pea cultivation, and consumer preferences play a significant role.
Europe Pea Industry Product Landscape
The European pea industry offers a diverse range of products, primarily categorized into pea protein, pea starch, and whole peas. Pea protein finds application in various food products including meat alternatives, protein bars, and beverages. Pea starch is utilized as a thickening agent and stabilizer in various food applications. Whole peas are primarily utilized in the food processing industry and as animal feed. Recent innovations focus on enhancing the functionalities of pea protein and starch, particularly its solubility, emulsification properties, and digestibility. These advancements aim to expand pea-based ingredients' applications and broaden market appeal.
Key Drivers, Barriers & Challenges in Europe Pea Industry
Key Drivers: The growing popularity of plant-based diets, increasing health awareness, favorable government policies promoting sustainable agriculture, and technological advancements in pea processing are among the primary growth drivers. The rise in demand for plant-based protein sources to replace traditional animal-derived proteins is another major contributor to industry growth.
Key Challenges & Restraints: Fluctuations in pea production due to weather conditions, intense competition from other protein sources, potential supply chain disruptions, and stringent regulatory compliance requirements constitute significant challenges for the European pea industry. The dependence on favorable weather conditions for pea cultivation poses a major risk and limits the industry's ability to meet ever-growing demand in some years. The high capital investment required for implementing advanced pea processing technologies may deter smaller players from entering the market.
Emerging Opportunities in Europe Pea Industry
Emerging opportunities lie in expanding the application of pea ingredients in novel food products and non-food sectors. This includes exploring the use of pea protein in cosmetics, pharmaceuticals, and bioplastics. Moreover, increasing consumer demand for organic and sustainably sourced food products presents a significant opportunity for pea producers who prioritize ethical sourcing and eco-friendly practices. Further exploration of untapped markets in Eastern Europe and growing exports into non-traditional regions could significantly accelerate market expansion.
Growth Accelerators in the Europe Pea Industry Industry
Technological advancements in pea processing, strategic partnerships between pea producers and food manufacturers, and market expansion into new geographical regions and product applications are critical growth accelerators. The development of new, functional pea ingredients catering to specific dietary requirements and preferences will further propel market growth. Government support in the form of subsidies and research funding aimed at improving pea production efficiency and quality will also continue to fuel expansion.
Key Players Shaping the Europe Pea Industry Market
Notable Milestones in Europe Pea Industry Sector
- October 2022: Roquette launched a new line of organic pea ingredients in the European market.
- September 2022: Lantmännen invested USD 95.7 million in a new pea protein production facility in Sweden.
- May 2022: China and Russia signed a phytosanitary protocol for peas, potentially increasing competition in global pea markets.
In-Depth Europe Pea Industry Market Outlook
The European pea industry is poised for robust growth in the coming years, driven by favorable market dynamics and ongoing technological advancements. Strategic partnerships, expansion into new markets, and the development of innovative pea-based products will be critical for achieving long-term success. The industry’s ability to address environmental concerns through sustainable farming practices and efficient resource management will also contribute significantly to its future outlook. The continued rise of plant-based diets promises substantial growth potential for pea producers and processors alike.
Europe Pea Industry Segmentation
-
1. Russia
-
1.1. Production Analysis
- 1.1.1. Consumption Analysis and Market Value
- 1.1.2. Import Market Analysis (Volume and Value)
- 1.1.3. Export Market Analysis (Volume and Value)
- 1.1.4. Price Trend Analysis
- 1.2. Ukraine
- 1.3. France
- 1.4. Spain
- 1.5. Netherlands
- 1.6. Rest of Europe
-
1.1. Production Analysis
-
2. Russia
-
2.1. Production Analysis
- 2.1.1. Consumption Analysis and Market Value
- 2.1.2. Import Market Analysis (Volume and Value)
- 2.1.3. Export Market Analysis (Volume and Value)
- 2.1.4. Price Trend Analysis
- 2.2. Ukraine
- 2.3. France
- 2.4. Spain
- 2.5. Netherlands
- 2.6. Rest of Europe
-
2.1. Production Analysis
Europe Pea Industry Segmentation By Geography
-
1. Europe
- 1.1. United Kingdom
- 1.2. Germany
- 1.3. France
- 1.4. Italy
- 1.5. Spain
- 1.6. Netherlands
- 1.7. Belgium
- 1.8. Sweden
- 1.9. Norway
- 1.10. Poland
- 1.11. Denmark
Europe Pea Industry REPORT HIGHLIGHTS
| Aspects | Details |
|---|---|
| Study Period | 2019-2033 |
| Base Year | 2024 |
| Estimated Year | 2025 |
| Forecast Period | 2025-2033 |
| Historical Period | 2019-2024 |
| Growth Rate | CAGR of 6.88% from 2019-2033 |
| Segmentation |
|
Table of Contents
- 1. Introduction
- 1.1. Research Scope
- 1.2. Market Segmentation
- 1.3. Research Methodology
- 1.4. Definitions and Assumptions
- 2. Executive Summary
- 2.1. Introduction
- 3. Market Dynamics
- 3.1. Introduction
- 3.2. Market Drivers
- 3.2.1. Rising Consumption of Cashew Nuts in the Country; Favorable Government Initiatives
- 3.3. Market Restrains
- 3.3.1. Hazardous Climatic Condition Hinders Cashew Production; Stringent Regulations Related to Food Quality Standards
- 3.4. Market Trends
- 3.4.1. Growing Export Opportunity
- 4. Market Factor Analysis
- 4.1. Porters Five Forces
- 4.2. Supply/Value Chain
- 4.3. PESTEL analysis
- 4.4. Market Entropy
- 4.5. Patent/Trademark Analysis
- 5. Europe Pea Industry Analysis, Insights and Forecast, 2019-2031
- 5.1. Market Analysis, Insights and Forecast - by Russia
- 5.1.1. Production Analysis
- 5.1.1.1. Consumption Analysis and Market Value
- 5.1.1.2. Import Market Analysis (Volume and Value)
- 5.1.1.3. Export Market Analysis (Volume and Value)
- 5.1.1.4. Price Trend Analysis
- 5.1.2. Ukraine
- 5.1.3. France
- 5.1.4. Spain
- 5.1.5. Netherlands
- 5.1.6. Rest of Europe
- 5.1.1. Production Analysis
- 5.2. Market Analysis, Insights and Forecast - by Russia
- 5.2.1. Production Analysis
- 5.2.1.1. Consumption Analysis and Market Value
- 5.2.1.2. Import Market Analysis (Volume and Value)
- 5.2.1.3. Export Market Analysis (Volume and Value)
- 5.2.1.4. Price Trend Analysis
- 5.2.2. Ukraine
- 5.2.3. France
- 5.2.4. Spain
- 5.2.5. Netherlands
- 5.2.6. Rest of Europe
- 5.2.1. Production Analysis
- 5.3. Market Analysis, Insights and Forecast - by Region
- 5.3.1. Europe
- 5.1. Market Analysis, Insights and Forecast - by Russia
- 6. Germany Europe Pea Industry Analysis, Insights and Forecast, 2019-2031
- 7. France Europe Pea Industry Analysis, Insights and Forecast, 2019-2031
- 8. Italy Europe Pea Industry Analysis, Insights and Forecast, 2019-2031
- 9. United Kingdom Europe Pea Industry Analysis, Insights and Forecast, 2019-2031
- 10. Netherlands Europe Pea Industry Analysis, Insights and Forecast, 2019-2031
- 11. Sweden Europe Pea Industry Analysis, Insights and Forecast, 2019-2031
- 12. Rest of Europe Europe Pea Industry Analysis, Insights and Forecast, 2019-2031
- 13. Competitive Analysis
- 13.1. Market Share Analysis 2024
- 13.2. Company Profiles
- 13.2.1 Sensus
- 13.2.1.1. Overview
- 13.2.1.2. Products
- 13.2.1.3. SWOT Analysis
- 13.2.1.4. Recent Developments
- 13.2.1.5. Financials (Based on Availability)
- 13.2.2 Tereos
- 13.2.2.1. Overview
- 13.2.2.2. Products
- 13.2.2.3. SWOT Analysis
- 13.2.2.4. Recent Developments
- 13.2.2.5. Financials (Based on Availability)
- 13.2.3 Lantmännen
- 13.2.3.1. Overview
- 13.2.3.2. Products
- 13.2.3.3. SWOT Analysis
- 13.2.3.4. Recent Developments
- 13.2.3.5. Financials (Based on Availability)
- 13.2.4 AGRANA
- 13.2.4.1. Overview
- 13.2.4.2. Products
- 13.2.4.3. SWOT Analysis
- 13.2.4.4. Recent Developments
- 13.2.4.5. Financials (Based on Availability)
- 13.2.5 Roquette
- 13.2.5.1. Overview
- 13.2.5.2. Products
- 13.2.5.3. SWOT Analysis
- 13.2.5.4. Recent Developments
- 13.2.5.5. Financials (Based on Availability)
- 13.2.1 Sensus
List of Figures
- Figure 1: Europe Pea Industry Revenue Breakdown (Million, %) by Product 2024 & 2032
- Figure 2: Europe Pea Industry Share (%) by Company 2024
List of Tables
- Table 1: Europe Pea Industry Revenue Million Forecast, by Region 2019 & 2032
- Table 2: Europe Pea Industry Volume million units Forecast, by Region 2019 & 2032
- Table 3: Europe Pea Industry Revenue Million Forecast, by Russia 2019 & 2032
- Table 4: Europe Pea Industry Volume million units Forecast, by Russia 2019 & 2032
- Table 5: Europe Pea Industry Revenue Million Forecast, by Russia 2019 & 2032
- Table 6: Europe Pea Industry Volume million units Forecast, by Russia 2019 & 2032
- Table 7: Europe Pea Industry Revenue Million Forecast, by Region 2019 & 2032
- Table 8: Europe Pea Industry Volume million units Forecast, by Region 2019 & 2032
- Table 9: Europe Pea Industry Revenue Million Forecast, by Country 2019 & 2032
- Table 10: Europe Pea Industry Volume million units Forecast, by Country 2019 & 2032
- Table 11: Germany Europe Pea Industry Revenue (Million) Forecast, by Application 2019 & 2032
- Table 12: Germany Europe Pea Industry Volume (million units) Forecast, by Application 2019 & 2032
- Table 13: France Europe Pea Industry Revenue (Million) Forecast, by Application 2019 & 2032
- Table 14: France Europe Pea Industry Volume (million units) Forecast, by Application 2019 & 2032
- Table 15: Italy Europe Pea Industry Revenue (Million) Forecast, by Application 2019 & 2032
- Table 16: Italy Europe Pea Industry Volume (million units) Forecast, by Application 2019 & 2032
- Table 17: United Kingdom Europe Pea Industry Revenue (Million) Forecast, by Application 2019 & 2032
- Table 18: United Kingdom Europe Pea Industry Volume (million units) Forecast, by Application 2019 & 2032
- Table 19: Netherlands Europe Pea Industry Revenue (Million) Forecast, by Application 2019 & 2032
- Table 20: Netherlands Europe Pea Industry Volume (million units) Forecast, by Application 2019 & 2032
- Table 21: Sweden Europe Pea Industry Revenue (Million) Forecast, by Application 2019 & 2032
- Table 22: Sweden Europe Pea Industry Volume (million units) Forecast, by Application 2019 & 2032
- Table 23: Rest of Europe Europe Pea Industry Revenue (Million) Forecast, by Application 2019 & 2032
- Table 24: Rest of Europe Europe Pea Industry Volume (million units) Forecast, by Application 2019 & 2032
- Table 25: Europe Pea Industry Revenue Million Forecast, by Russia 2019 & 2032
- Table 26: Europe Pea Industry Volume million units Forecast, by Russia 2019 & 2032
- Table 27: Europe Pea Industry Revenue Million Forecast, by Russia 2019 & 2032
- Table 28: Europe Pea Industry Volume million units Forecast, by Russia 2019 & 2032
- Table 29: Europe Pea Industry Revenue Million Forecast, by Country 2019 & 2032
- Table 30: Europe Pea Industry Volume million units Forecast, by Country 2019 & 2032
- Table 31: United Kingdom Europe Pea Industry Revenue (Million) Forecast, by Application 2019 & 2032
- Table 32: United Kingdom Europe Pea Industry Volume (million units) Forecast, by Application 2019 & 2032
- Table 33: Germany Europe Pea Industry Revenue (Million) Forecast, by Application 2019 & 2032
- Table 34: Germany Europe Pea Industry Volume (million units) Forecast, by Application 2019 & 2032
- Table 35: France Europe Pea Industry Revenue (Million) Forecast, by Application 2019 & 2032
- Table 36: France Europe Pea Industry Volume (million units) Forecast, by Application 2019 & 2032
- Table 37: Italy Europe Pea Industry Revenue (Million) Forecast, by Application 2019 & 2032
- Table 38: Italy Europe Pea Industry Volume (million units) Forecast, by Application 2019 & 2032
- Table 39: Spain Europe Pea Industry Revenue (Million) Forecast, by Application 2019 & 2032
- Table 40: Spain Europe Pea Industry Volume (million units) Forecast, by Application 2019 & 2032
- Table 41: Netherlands Europe Pea Industry Revenue (Million) Forecast, by Application 2019 & 2032
- Table 42: Netherlands Europe Pea Industry Volume (million units) Forecast, by Application 2019 & 2032
- Table 43: Belgium Europe Pea Industry Revenue (Million) Forecast, by Application 2019 & 2032
- Table 44: Belgium Europe Pea Industry Volume (million units) Forecast, by Application 2019 & 2032
- Table 45: Sweden Europe Pea Industry Revenue (Million) Forecast, by Application 2019 & 2032
- Table 46: Sweden Europe Pea Industry Volume (million units) Forecast, by Application 2019 & 2032
- Table 47: Norway Europe Pea Industry Revenue (Million) Forecast, by Application 2019 & 2032
- Table 48: Norway Europe Pea Industry Volume (million units) Forecast, by Application 2019 & 2032
- Table 49: Poland Europe Pea Industry Revenue (Million) Forecast, by Application 2019 & 2032
- Table 50: Poland Europe Pea Industry Volume (million units) Forecast, by Application 2019 & 2032
- Table 51: Denmark Europe Pea Industry Revenue (Million) Forecast, by Application 2019 & 2032
- Table 52: Denmark Europe Pea Industry Volume (million units) Forecast, by Application 2019 & 2032
Frequently Asked Questions
1. What is the projected Compound Annual Growth Rate (CAGR) of the Europe Pea Industry?
The projected CAGR is approximately 6.88%.
2. Which companies are prominent players in the Europe Pea Industry?
Key companies in the market include Sensus, Tereos , Lantmännen , AGRANA, Roquette .
3. What are the main segments of the Europe Pea Industry?
The market segments include Russia, Russia.
4. Can you provide details about the market size?
The market size is estimated to be USD 14.50 Million as of 2022.
5. What are some drivers contributing to market growth?
Rising Consumption of Cashew Nuts in the Country; Favorable Government Initiatives.
6. What are the notable trends driving market growth?
Growing Export Opportunity.
7. Are there any restraints impacting market growth?
Hazardous Climatic Condition Hinders Cashew Production; Stringent Regulations Related to Food Quality Standards.
8. Can you provide examples of recent developments in the market?
October 2022: Roquette, a global leader in plant-based ingredients and a pioneer of plant proteins, launched a new line of organic pea ingredients: organic pea starch and organic pea protein to the Europe market.
9. What pricing options are available for accessing the report?
Pricing options include single-user, multi-user, and enterprise licenses priced at USD 4750, USD 4950, and USD 6800 respectively.
10. Is the market size provided in terms of value or volume?
The market size is provided in terms of value, measured in Million and volume, measured in million units.
11. Are there any specific market keywords associated with the report?
Yes, the market keyword associated with the report is "Europe Pea Industry," which aids in identifying and referencing the specific market segment covered.
12. How do I determine which pricing option suits my needs best?
The pricing options vary based on user requirements and access needs. Individual users may opt for single-user licenses, while businesses requiring broader access may choose multi-user or enterprise licenses for cost-effective access to the report.
13. Are there any additional resources or data provided in the Europe Pea Industry report?
While the report offers comprehensive insights, it's advisable to review the specific contents or supplementary materials provided to ascertain if additional resources or data are available.
14. How can I stay updated on further developments or reports in the Europe Pea Industry?
To stay informed about further developments, trends, and reports in the Europe Pea Industry, consider subscribing to industry newsletters, following relevant companies and organizations, or regularly checking reputable industry news sources and publications.
Methodology
Step 1 - Identification of Relevant Samples Size from Population Database


Step 2 - Approaches for Defining Global Market Size (Value, Volume* & Price*)

Note*: In applicable scenarios
Step 3 - Data Sources
Primary Research
- Web Analytics
- Survey Reports
- Research Institute
- Latest Research Reports
- Opinion Leaders
Secondary Research
- Annual Reports
- White Paper
- Latest Press Release
- Industry Association
- Paid Database
- Investor Presentations

Step 4 - Data Triangulation
Involves using different sources of information in order to increase the validity of a study
These sources are likely to be stakeholders in a program - participants, other researchers, program staff, other community members, and so on.
Then we put all data in single framework & apply various statistical tools to find out the dynamic on the market.
During the analysis stage, feedback from the stakeholder groups would be compared to determine areas of agreement as well as areas of divergence


