

Key Insights
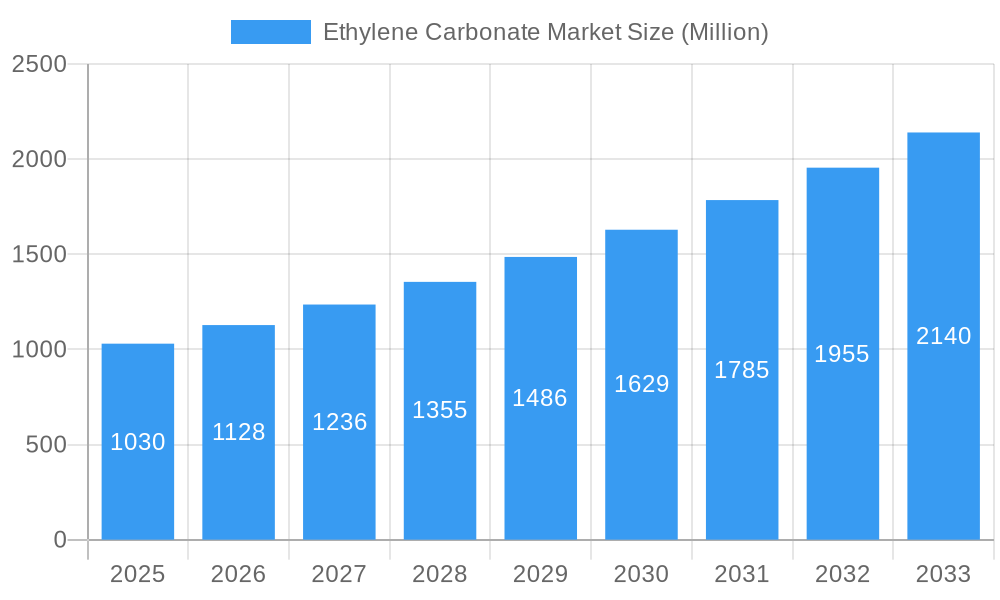
The Ethylene Carbonate market, valued at $1.03 billion in 2025, is projected to experience robust growth, driven by the increasing demand for lithium-ion batteries in electric vehicles and energy storage systems. This surge is further amplified by the expanding pharmaceutical and medical device industries, which utilize ethylene carbonate as a crucial solvent and intermediate in various manufacturing processes. The automotive sector's shift towards electric mobility is a significant catalyst, with battery manufacturers representing a substantial portion of the market demand. Growth is also fueled by advancements in lubricant formulations utilizing ethylene carbonate for enhanced performance and sustainability. While the market faces some restraints, including price fluctuations in raw materials and stringent environmental regulations, the overall trajectory remains positive. The Asia-Pacific region, particularly China and Japan, currently dominates the market due to strong manufacturing bases in key industries. However, North America and Europe are expected to witness significant growth driven by increasing adoption of electric vehicles and expansion of the pharmaceutical sector. This growth will likely be fueled by continued research and development leading to innovative applications of ethylene carbonate in diverse sectors. Competition among established chemical companies and emerging players is intensifying, leading to innovations in production efficiency and product diversification.
Ethylene Carbonate Market Market Size (In Billion)
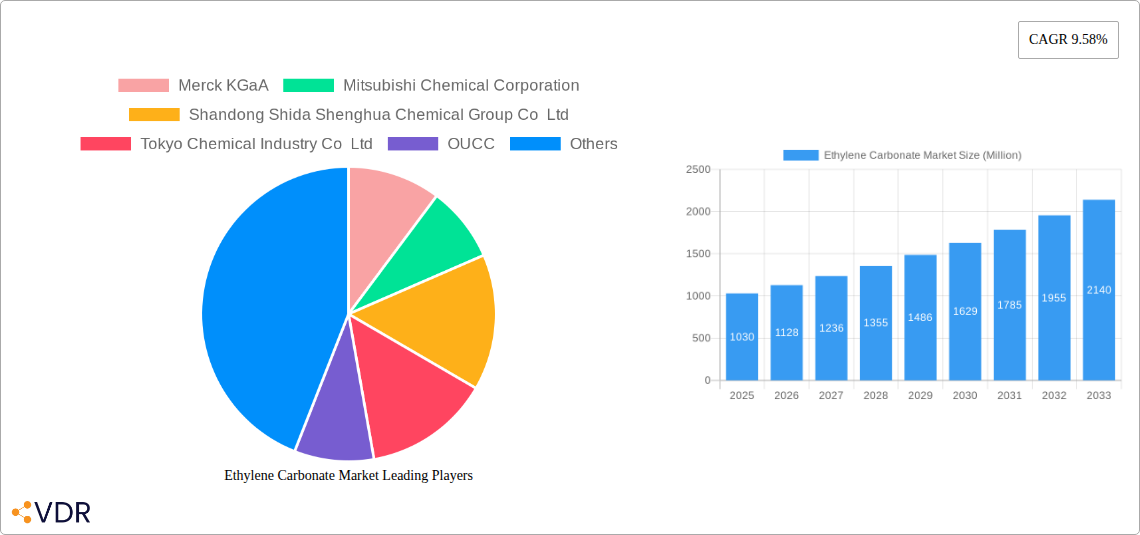
The forecast period (2025-2033) anticipates a Compound Annual Growth Rate (CAGR) of 9.58%, indicating substantial market expansion. This growth will be distributed across various segments, with the lithium-ion battery application segment expected to maintain its dominance. However, the lubricants and medical products segments are also poised for substantial growth due to ongoing technological developments and the rising demand for advanced materials in these industries. Geographic expansion will primarily focus on regions with robust industrial growth and increasing investments in electric vehicle infrastructure, ensuring steady market expansion throughout the forecast period. Strategies for market players will likely revolve around technological advancements, vertical integration, and targeted expansion into high-growth regions.
Ethylene Carbonate Market Company Market Share
Ethylene Carbonate Market Report: 2019-2033
This comprehensive report provides a detailed analysis of the Ethylene Carbonate market, encompassing market dynamics, growth trends, regional dominance, product landscape, key players, and future outlook. The study period spans 2019-2033, with 2025 serving as the base and estimated year. This report is invaluable for industry professionals, investors, and strategic decision-makers seeking a deep understanding of this vital chemical market. The parent market is the Chemical Intermediates market, while the child market is specifically the Electrolyte Solvents market (within the lithium-ion battery sector).
Ethylene Carbonate Market Dynamics & Structure
The Ethylene Carbonate market is characterized by moderate concentration, with key players holding significant market share, but also a number of smaller regional players contributing to the overall market volume. Technological innovation, particularly in improving production efficiency and purity, is a major driver. Stringent regulatory frameworks regarding environmental impact and safety standards significantly influence production and application. Competitive product substitutes, such as propylene carbonate, exert pressure on pricing and market share. The end-user demographics are diverse, encompassing automotive, pharmaceutical, and oil & gas industries. Recent years have witnessed several M&A activities, reflecting consolidation and expansion strategies within the sector.
- Market Concentration: Moderately concentrated, with top 5 players holding approximately xx% of market share in 2024.
- Technological Innovation: Focus on improving process efficiency and reducing production costs; development of high-purity grades for specialized applications.
- Regulatory Landscape: Stringent environmental regulations impacting production methods and waste management.
- Competitive Substitutes: Propylene carbonate and other electrolyte solvents present competitive challenges.
- M&A Activity: xx major mergers and acquisitions recorded between 2019 and 2024.
- End-User Demographics: Automotive industry is projected to dominate the demand in the forecast period, followed by the pharmaceutical industry.
Ethylene Carbonate Market Growth Trends & Insights
The global Ethylene Carbonate market is experiencing robust growth, driven by the burgeoning demand from the lithium-ion battery sector. The market size reached xx million units in 2024 and is projected to reach xx million units by 2033, exhibiting a CAGR of xx% during the forecast period (2025-2033). This growth is primarily fueled by the increasing adoption of electric vehicles (EVs) and hybrid electric vehicles (HEVs), which significantly increases the demand for high-purity ethylene carbonate in lithium-ion battery electrolytes. Technological advancements in battery chemistry and increasing energy storage needs are further propelling market expansion. Consumer behavior shifts towards sustainable energy solutions are also significantly contributing to the overall market expansion. Market penetration in emerging economies is also expected to drive significant growth.
Dominant Regions, Countries, or Segments in Ethylene Carbonate Market
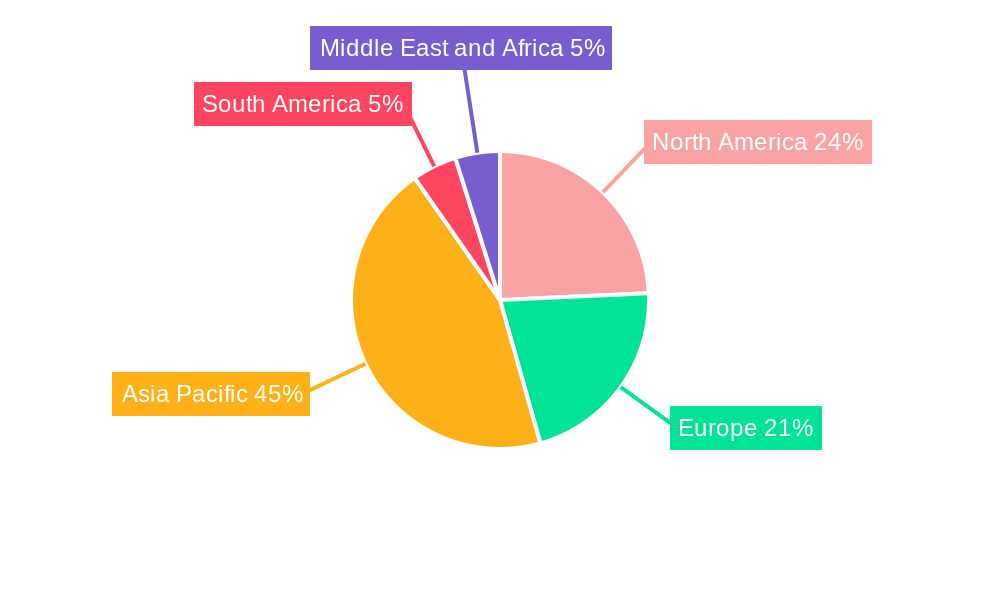
Asia-Pacific, particularly China and South Korea, currently dominates the Ethylene Carbonate market, driven by the robust growth of the electronics and automotive industries in these regions. The region's substantial manufacturing capacity and supportive government policies favoring electric vehicle adoption contribute significantly to its dominance. Within applications, the Lithium Batteries segment holds the largest market share, closely followed by the Lubricants segment.
- Asia-Pacific: Largest market share, driven by robust growth of the electric vehicle sector and strong manufacturing capabilities.
- North America: Steady growth driven by increasing demand from the automotive and pharmaceutical industries.
- Europe: Moderate growth, influenced by stringent environmental regulations and the expanding renewable energy sector.
- Application: Lithium batteries accounts for the largest market share (xx%), followed by Lubricants (xx%).
- End-user Industry: Automotive sector is the leading consumer of ethylene carbonate, followed by pharmaceuticals.
Ethylene Carbonate Market Product Landscape
The Ethylene Carbonate market offers various product grades differing in purity and specifications, catering to diverse applications. High-purity grades are predominantly used in lithium-ion batteries, while lower-purity grades are suitable for applications such as lubricants and intermediates. Technological advancements focus on improving production efficiency, reducing impurities, and enhancing product consistency to meet the stringent quality requirements of various applications. The unique selling propositions of different manufacturers include specialized purification techniques, cost-effective production processes, and customized product offerings to meet specific customer needs.
Key Drivers, Barriers & Challenges in Ethylene Carbonate Market
Key Drivers: The booming electric vehicle industry is the primary driver, creating an immense demand for high-purity ethylene carbonate in lithium-ion batteries. Government incentives and policies promoting electric vehicle adoption further accelerate market growth. Technological advancements in battery technology and increasing energy storage needs contribute to sustained market expansion.
Key Challenges: Fluctuations in raw material prices (ethylene oxide) can impact production costs and profitability. Stringent environmental regulations can add to operational complexity and cost. Intense competition from existing and emerging players presents a challenge to maintaining market share and pricing. Supply chain disruptions may lead to production delays and increased costs.
Emerging Opportunities in Ethylene Carbonate Market
Untapped markets in developing economies present substantial growth opportunities. The increasing demand for high-energy density batteries for grid-scale energy storage opens new avenues for market expansion. Innovative applications of ethylene carbonate in emerging technologies, such as fuel cells and advanced materials, create further market potential. The growing awareness of sustainable manufacturing practices and environmentally friendly chemicals creates an opportunity for companies to focus on developing sustainable production processes.
Growth Accelerators in the Ethylene Carbonate Market Industry
Technological advancements in production processes, leading to higher efficiency and lower costs, are key growth accelerators. Strategic partnerships and collaborations between chemical companies and battery manufacturers will drive market expansion. Government support through subsidies and incentives for renewable energy technologies further fuels market growth. Expanding into new geographical markets and developing niche applications for ethylene carbonate will unlock new avenues for growth.
Key Players Shaping the Ethylene Carbonate Market Market
- Merck KGaA
- Mitsubishi Chemical Corporation
- Shandong Shida Shenghua Chemical Group Co Ltd
- Tokyo Chemical Industry Co Ltd
- OUCC
- BASF SE
- Huntsman International LLC
- Taixing Taida Fine Chemical Co Ltd
- Zibo Donghai Industries Co Ltd
- Toagosei Co Ltd
- Lixing Chemical
- Shandong Senjie Cleantech Co Ltd
- Liaoning Ganglong Chemical Co Ltd
Notable Milestones in Ethylene Carbonate Market Sector
- February 2022: Lotte Chemical announces a KRW 602 billion (USD 502 million) investment to build a new plant for high-purity organic solvents, including ethylene carbonate, for lithium-ion battery electrolytes. This significantly expands production capacity and caters to the growing demand.
- June 2022: Lotte Chemical and Sasol collaborate to explore the construction of a joint plant for electrolyte solvents, further bolstering the supply chain for lithium-ion batteries. This strategic partnership enhances production capabilities and strengthens market position.
In-Depth Ethylene Carbonate Market Market Outlook
The Ethylene Carbonate market is poised for sustained growth, driven by the continued expansion of the electric vehicle market and advancements in battery technology. Strategic investments in production capacity, innovative process technologies, and strategic partnerships will be crucial for success. Companies focusing on sustainable and environmentally friendly production methods will gain a competitive advantage. The market presents significant opportunities for both established players and new entrants with innovative technologies and business models.
Ethylene Carbonate Market Segmentation
-
1. Application
- 1.1. Lithium Batteries
- 1.2. Lubricants
- 1.3. Medical Products
- 1.4. Intermediates and Agents
- 1.5. Other Applications
-
2. End-user Industry
- 2.1. Automotive
- 2.2. Pharmaceuticals
- 2.3. Oil and Gas
- 2.4. Other End-user Industries
Ethylene Carbonate Market Segmentation By Geography
-
1. Asia Pacific
- 1.1. China
- 1.2. India
- 1.3. Japan
- 1.4. South Korea
- 1.5. Rest of Asia Pacific
-
2. North America
- 2.1. United States
- 2.2. Canada
- 2.3. Mexico
-
3. Europe
- 3.1. Germany
- 3.2. United Kingdom
- 3.3. France
- 3.4. Italy
- 3.5. Rest of Europe
-
4. South America
- 4.1. Brazil
- 4.2. Argentina
- 4.3. Rest of South America
-
5. Middle East and Africa
- 5.1. Saudi Arabia
- 5.2. South Africa
- 5.3. Rest of Middle East and Africa
Ethylene Carbonate Market Regional Market Share
Geographic Coverage of Ethylene Carbonate Market
Ethylene Carbonate Market REPORT HIGHLIGHTS
| Aspects | Details |
|---|---|
| Study Period | 2020-2034 |
| Base Year | 2025 |
| Estimated Year | 2026 |
| Forecast Period | 2026-2034 |
| Historical Period | 2020-2025 |
| Growth Rate | CAGR of 9.58% from 2020-2034 |
| Segmentation |
|
Table of Contents
- 1. Introduction
- 1.1. Research Scope
- 1.2. Market Segmentation
- 1.3. Research Objective
- 1.4. Definitions and Assumptions
- 2. Executive Summary
- 2.1. Market Snapshot
- 3. Market Dynamics
- 3.1. Market Drivers
- 3.2. Market Restrains
- 3.3. Market Trends
- 3.4. Market Opportunities
- 4. Market Factor Analysis
- 4.1. Porters Five Forces
- 4.1.1. Bargaining Power of Suppliers
- 4.1.2. Bargaining Power of Buyers
- 4.1.3. Threat of New Entrants
- 4.1.4. Threat of Substitutes
- 4.1.5. Competitive Rivalry
- 4.2. PESTEL analysis
- 4.3. BCG Analysis
- 4.3.1. Stars (High Growth, High Market Share)
- 4.3.2. Cash Cows (Low Growth, High Market Share)
- 4.3.3. Question Mark (High Growth, Low Market Share)
- 4.3.4. Dogs (Low Growth, Low Market Share)
- 4.4. Ansoff Matrix Analysis
- 4.5. Supply Chain Analysis
- 4.6. Regulatory Landscape
- 4.7. Current Market Potential and Opportunity Assessment (TAM–SAM–SOM Framework)
- 4.8. VDR Analyst Note
- 4.1. Porters Five Forces
- 5. Market Analysis, Insights and Forecast 2021-2033
- 5.1. Market Analysis, Insights and Forecast - by Application
- 5.1.1. Lithium Batteries
- 5.1.2. Lubricants
- 5.1.3. Medical Products
- 5.1.4. Intermediates and Agents
- 5.1.5. Other Applications
- 5.2. Market Analysis, Insights and Forecast - by End-user Industry
- 5.2.1. Automotive
- 5.2.2. Pharmaceuticals
- 5.2.3. Oil and Gas
- 5.2.4. Other End-user Industries
- 5.3. Market Analysis, Insights and Forecast - by Region
- 5.3.1. Asia Pacific
- 5.3.2. North America
- 5.3.3. Europe
- 5.3.4. South America
- 5.3.5. Middle East and Africa
- 5.1. Market Analysis, Insights and Forecast - by Application
- 6. Global Ethylene Carbonate Market Analysis, Insights and Forecast, 2021-2033
- 6.1. Market Analysis, Insights and Forecast - by Application
- 6.1.1. Lithium Batteries
- 6.1.2. Lubricants
- 6.1.3. Medical Products
- 6.1.4. Intermediates and Agents
- 6.1.5. Other Applications
- 6.2. Market Analysis, Insights and Forecast - by End-user Industry
- 6.2.1. Automotive
- 6.2.2. Pharmaceuticals
- 6.2.3. Oil and Gas
- 6.2.4. Other End-user Industries
- 6.1. Market Analysis, Insights and Forecast - by Application
- 7. Asia Pacific Ethylene Carbonate Market Analysis, Insights and Forecast, 2021-2033
- 7.1. Market Analysis, Insights and Forecast - by Application
- 7.1.1. Lithium Batteries
- 7.1.2. Lubricants
- 7.1.3. Medical Products
- 7.1.4. Intermediates and Agents
- 7.1.5. Other Applications
- 7.2. Market Analysis, Insights and Forecast - by End-user Industry
- 7.2.1. Automotive
- 7.2.2. Pharmaceuticals
- 7.2.3. Oil and Gas
- 7.2.4. Other End-user Industries
- 7.1. Market Analysis, Insights and Forecast - by Application
- 8. North America Ethylene Carbonate Market Analysis, Insights and Forecast, 2021-2033
- 8.1. Market Analysis, Insights and Forecast - by Application
- 8.1.1. Lithium Batteries
- 8.1.2. Lubricants
- 8.1.3. Medical Products
- 8.1.4. Intermediates and Agents
- 8.1.5. Other Applications
- 8.2. Market Analysis, Insights and Forecast - by End-user Industry
- 8.2.1. Automotive
- 8.2.2. Pharmaceuticals
- 8.2.3. Oil and Gas
- 8.2.4. Other End-user Industries
- 8.1. Market Analysis, Insights and Forecast - by Application
- 9. Europe Ethylene Carbonate Market Analysis, Insights and Forecast, 2021-2033
- 9.1. Market Analysis, Insights and Forecast - by Application
- 9.1.1. Lithium Batteries
- 9.1.2. Lubricants
- 9.1.3. Medical Products
- 9.1.4. Intermediates and Agents
- 9.1.5. Other Applications
- 9.2. Market Analysis, Insights and Forecast - by End-user Industry
- 9.2.1. Automotive
- 9.2.2. Pharmaceuticals
- 9.2.3. Oil and Gas
- 9.2.4. Other End-user Industries
- 9.1. Market Analysis, Insights and Forecast - by Application
- 10. South America Ethylene Carbonate Market Analysis, Insights and Forecast, 2021-2033
- 10.1. Market Analysis, Insights and Forecast - by Application
- 10.1.1. Lithium Batteries
- 10.1.2. Lubricants
- 10.1.3. Medical Products
- 10.1.4. Intermediates and Agents
- 10.1.5. Other Applications
- 10.2. Market Analysis, Insights and Forecast - by End-user Industry
- 10.2.1. Automotive
- 10.2.2. Pharmaceuticals
- 10.2.3. Oil and Gas
- 10.2.4. Other End-user Industries
- 10.1. Market Analysis, Insights and Forecast - by Application
- 11. Middle East and Africa Ethylene Carbonate Market Analysis, Insights and Forecast, 2021-2033
- 11.1. Market Analysis, Insights and Forecast - by Application
- 11.1.1. Lithium Batteries
- 11.1.2. Lubricants
- 11.1.3. Medical Products
- 11.1.4. Intermediates and Agents
- 11.1.5. Other Applications
- 11.2. Market Analysis, Insights and Forecast - by End-user Industry
- 11.2.1. Automotive
- 11.2.2. Pharmaceuticals
- 11.2.3. Oil and Gas
- 11.2.4. Other End-user Industries
- 11.1. Market Analysis, Insights and Forecast - by Application
- 12. Competitive Analysis
- 12.1. Company Profiles
- 12.1.1 Merck KGaA
- 12.1.1.1. Company Overview
- 12.1.1.2. Products
- 12.1.1.3. Company Financials
- 12.1.1.4. SWOT Analysis
- 12.1.2 Mitsubishi Chemical Corporation
- 12.1.2.1. Company Overview
- 12.1.2.2. Products
- 12.1.2.3. Company Financials
- 12.1.2.4. SWOT Analysis
- 12.1.3 Shandong Shida Shenghua Chemical Group Co Ltd
- 12.1.3.1. Company Overview
- 12.1.3.2. Products
- 12.1.3.3. Company Financials
- 12.1.3.4. SWOT Analysis
- 12.1.4 Tokyo Chemical Industry Co Ltd
- 12.1.4.1. Company Overview
- 12.1.4.2. Products
- 12.1.4.3. Company Financials
- 12.1.4.4. SWOT Analysis
- 12.1.5 OUCC
- 12.1.5.1. Company Overview
- 12.1.5.2. Products
- 12.1.5.3. Company Financials
- 12.1.5.4. SWOT Analysis
- 12.1.6 BASF SE
- 12.1.6.1. Company Overview
- 12.1.6.2. Products
- 12.1.6.3. Company Financials
- 12.1.6.4. SWOT Analysis
- 12.1.7 Huntsman International LLC
- 12.1.7.1. Company Overview
- 12.1.7.2. Products
- 12.1.7.3. Company Financials
- 12.1.7.4. SWOT Analysis
- 12.1.8 Taixing Taida Fine Chemical Co Ltd
- 12.1.8.1. Company Overview
- 12.1.8.2. Products
- 12.1.8.3. Company Financials
- 12.1.8.4. SWOT Analysis
- 12.1.9 Zibo Donghai Industries Co Ltd
- 12.1.9.1. Company Overview
- 12.1.9.2. Products
- 12.1.9.3. Company Financials
- 12.1.9.4. SWOT Analysis
- 12.1.10 Toagosei Co Ltd
- 12.1.10.1. Company Overview
- 12.1.10.2. Products
- 12.1.10.3. Company Financials
- 12.1.10.4. SWOT Analysis
- 12.1.11 Lixing Chemical
- 12.1.11.1. Company Overview
- 12.1.11.2. Products
- 12.1.11.3. Company Financials
- 12.1.11.4. SWOT Analysis
- 12.1.12 Shandong Senjie Cleantech Co Ltd
- 12.1.12.1. Company Overview
- 12.1.12.2. Products
- 12.1.12.3. Company Financials
- 12.1.12.4. SWOT Analysis
- 12.1.13 Liaoning Ganglong Chemical Co Ltd
- 12.1.13.1. Company Overview
- 12.1.13.2. Products
- 12.1.13.3. Company Financials
- 12.1.13.4. SWOT Analysis
- 12.1.1 Merck KGaA
- 12.2. Market Entropy
- 12.2.1 Company's Key Areas Served
- 12.2.2 Recent Developments
- 12.3. Company Market Share Analysis 2025
- 12.3.1 Top 5 Companies Market Share Analysis
- 12.3.2 Top 3 Companies Market Share Analysis
- 12.4. List of Potential Customers
- 13. Research Methodology
List of Figures
- Figure 1: Global Ethylene Carbonate Market Revenue Breakdown (Million, %) by Region 2025 & 2033
- Figure 2: Global Ethylene Carbonate Market Volume Breakdown (grams per milliliter, %) by Region 2025 & 2033
- Figure 3: Asia Pacific Ethylene Carbonate Market Revenue (Million), by Application 2025 & 2033
- Figure 4: Asia Pacific Ethylene Carbonate Market Volume (grams per milliliter), by Application 2025 & 2033
- Figure 5: Asia Pacific Ethylene Carbonate Market Revenue Share (%), by Application 2025 & 2033
- Figure 6: Asia Pacific Ethylene Carbonate Market Volume Share (%), by Application 2025 & 2033
- Figure 7: Asia Pacific Ethylene Carbonate Market Revenue (Million), by End-user Industry 2025 & 2033
- Figure 8: Asia Pacific Ethylene Carbonate Market Volume (grams per milliliter), by End-user Industry 2025 & 2033
- Figure 9: Asia Pacific Ethylene Carbonate Market Revenue Share (%), by End-user Industry 2025 & 2033
- Figure 10: Asia Pacific Ethylene Carbonate Market Volume Share (%), by End-user Industry 2025 & 2033
- Figure 11: Asia Pacific Ethylene Carbonate Market Revenue (Million), by Country 2025 & 2033
- Figure 12: Asia Pacific Ethylene Carbonate Market Volume (grams per milliliter), by Country 2025 & 2033
- Figure 13: Asia Pacific Ethylene Carbonate Market Revenue Share (%), by Country 2025 & 2033
- Figure 14: Asia Pacific Ethylene Carbonate Market Volume Share (%), by Country 2025 & 2033
- Figure 15: North America Ethylene Carbonate Market Revenue (Million), by Application 2025 & 2033
- Figure 16: North America Ethylene Carbonate Market Volume (grams per milliliter), by Application 2025 & 2033
- Figure 17: North America Ethylene Carbonate Market Revenue Share (%), by Application 2025 & 2033
- Figure 18: North America Ethylene Carbonate Market Volume Share (%), by Application 2025 & 2033
- Figure 19: North America Ethylene Carbonate Market Revenue (Million), by End-user Industry 2025 & 2033
- Figure 20: North America Ethylene Carbonate Market Volume (grams per milliliter), by End-user Industry 2025 & 2033
- Figure 21: North America Ethylene Carbonate Market Revenue Share (%), by End-user Industry 2025 & 2033
- Figure 22: North America Ethylene Carbonate Market Volume Share (%), by End-user Industry 2025 & 2033
- Figure 23: North America Ethylene Carbonate Market Revenue (Million), by Country 2025 & 2033
- Figure 24: North America Ethylene Carbonate Market Volume (grams per milliliter), by Country 2025 & 2033
- Figure 25: North America Ethylene Carbonate Market Revenue Share (%), by Country 2025 & 2033
- Figure 26: North America Ethylene Carbonate Market Volume Share (%), by Country 2025 & 2033
- Figure 27: Europe Ethylene Carbonate Market Revenue (Million), by Application 2025 & 2033
- Figure 28: Europe Ethylene Carbonate Market Volume (grams per milliliter), by Application 2025 & 2033
- Figure 29: Europe Ethylene Carbonate Market Revenue Share (%), by Application 2025 & 2033
- Figure 30: Europe Ethylene Carbonate Market Volume Share (%), by Application 2025 & 2033
- Figure 31: Europe Ethylene Carbonate Market Revenue (Million), by End-user Industry 2025 & 2033
- Figure 32: Europe Ethylene Carbonate Market Volume (grams per milliliter), by End-user Industry 2025 & 2033
- Figure 33: Europe Ethylene Carbonate Market Revenue Share (%), by End-user Industry 2025 & 2033
- Figure 34: Europe Ethylene Carbonate Market Volume Share (%), by End-user Industry 2025 & 2033
- Figure 35: Europe Ethylene Carbonate Market Revenue (Million), by Country 2025 & 2033
- Figure 36: Europe Ethylene Carbonate Market Volume (grams per milliliter), by Country 2025 & 2033
- Figure 37: Europe Ethylene Carbonate Market Revenue Share (%), by Country 2025 & 2033
- Figure 38: Europe Ethylene Carbonate Market Volume Share (%), by Country 2025 & 2033
- Figure 39: South America Ethylene Carbonate Market Revenue (Million), by Application 2025 & 2033
- Figure 40: South America Ethylene Carbonate Market Volume (grams per milliliter), by Application 2025 & 2033
- Figure 41: South America Ethylene Carbonate Market Revenue Share (%), by Application 2025 & 2033
- Figure 42: South America Ethylene Carbonate Market Volume Share (%), by Application 2025 & 2033
- Figure 43: South America Ethylene Carbonate Market Revenue (Million), by End-user Industry 2025 & 2033
- Figure 44: South America Ethylene Carbonate Market Volume (grams per milliliter), by End-user Industry 2025 & 2033
- Figure 45: South America Ethylene Carbonate Market Revenue Share (%), by End-user Industry 2025 & 2033
- Figure 46: South America Ethylene Carbonate Market Volume Share (%), by End-user Industry 2025 & 2033
- Figure 47: South America Ethylene Carbonate Market Revenue (Million), by Country 2025 & 2033
- Figure 48: South America Ethylene Carbonate Market Volume (grams per milliliter), by Country 2025 & 2033
- Figure 49: South America Ethylene Carbonate Market Revenue Share (%), by Country 2025 & 2033
- Figure 50: South America Ethylene Carbonate Market Volume Share (%), by Country 2025 & 2033
- Figure 51: Middle East and Africa Ethylene Carbonate Market Revenue (Million), by Application 2025 & 2033
- Figure 52: Middle East and Africa Ethylene Carbonate Market Volume (grams per milliliter), by Application 2025 & 2033
- Figure 53: Middle East and Africa Ethylene Carbonate Market Revenue Share (%), by Application 2025 & 2033
- Figure 54: Middle East and Africa Ethylene Carbonate Market Volume Share (%), by Application 2025 & 2033
- Figure 55: Middle East and Africa Ethylene Carbonate Market Revenue (Million), by End-user Industry 2025 & 2033
- Figure 56: Middle East and Africa Ethylene Carbonate Market Volume (grams per milliliter), by End-user Industry 2025 & 2033
- Figure 57: Middle East and Africa Ethylene Carbonate Market Revenue Share (%), by End-user Industry 2025 & 2033
- Figure 58: Middle East and Africa Ethylene Carbonate Market Volume Share (%), by End-user Industry 2025 & 2033
- Figure 59: Middle East and Africa Ethylene Carbonate Market Revenue (Million), by Country 2025 & 2033
- Figure 60: Middle East and Africa Ethylene Carbonate Market Volume (grams per milliliter), by Country 2025 & 2033
- Figure 61: Middle East and Africa Ethylene Carbonate Market Revenue Share (%), by Country 2025 & 2033
- Figure 62: Middle East and Africa Ethylene Carbonate Market Volume Share (%), by Country 2025 & 2033
List of Tables
- Table 1: Global Ethylene Carbonate Market Revenue Million Forecast, by Application 2020 & 2033
- Table 2: Global Ethylene Carbonate Market Volume grams per milliliter Forecast, by Application 2020 & 2033
- Table 3: Global Ethylene Carbonate Market Revenue Million Forecast, by End-user Industry 2020 & 2033
- Table 4: Global Ethylene Carbonate Market Volume grams per milliliter Forecast, by End-user Industry 2020 & 2033
- Table 5: Global Ethylene Carbonate Market Revenue Million Forecast, by Region 2020 & 2033
- Table 6: Global Ethylene Carbonate Market Volume grams per milliliter Forecast, by Region 2020 & 2033
- Table 7: Global Ethylene Carbonate Market Revenue Million Forecast, by Application 2020 & 2033
- Table 8: Global Ethylene Carbonate Market Volume grams per milliliter Forecast, by Application 2020 & 2033
- Table 9: Global Ethylene Carbonate Market Revenue Million Forecast, by End-user Industry 2020 & 2033
- Table 10: Global Ethylene Carbonate Market Volume grams per milliliter Forecast, by End-user Industry 2020 & 2033
- Table 11: Global Ethylene Carbonate Market Revenue Million Forecast, by Country 2020 & 2033
- Table 12: Global Ethylene Carbonate Market Volume grams per milliliter Forecast, by Country 2020 & 2033
- Table 13: China Ethylene Carbonate Market Revenue (Million) Forecast, by Application 2020 & 2033
- Table 14: China Ethylene Carbonate Market Volume (grams per milliliter) Forecast, by Application 2020 & 2033
- Table 15: India Ethylene Carbonate Market Revenue (Million) Forecast, by Application 2020 & 2033
- Table 16: India Ethylene Carbonate Market Volume (grams per milliliter) Forecast, by Application 2020 & 2033
- Table 17: Japan Ethylene Carbonate Market Revenue (Million) Forecast, by Application 2020 & 2033
- Table 18: Japan Ethylene Carbonate Market Volume (grams per milliliter) Forecast, by Application 2020 & 2033
- Table 19: South Korea Ethylene Carbonate Market Revenue (Million) Forecast, by Application 2020 & 2033
- Table 20: South Korea Ethylene Carbonate Market Volume (grams per milliliter) Forecast, by Application 2020 & 2033
- Table 21: Rest of Asia Pacific Ethylene Carbonate Market Revenue (Million) Forecast, by Application 2020 & 2033
- Table 22: Rest of Asia Pacific Ethylene Carbonate Market Volume (grams per milliliter) Forecast, by Application 2020 & 2033
- Table 23: Global Ethylene Carbonate Market Revenue Million Forecast, by Application 2020 & 2033
- Table 24: Global Ethylene Carbonate Market Volume grams per milliliter Forecast, by Application 2020 & 2033
- Table 25: Global Ethylene Carbonate Market Revenue Million Forecast, by End-user Industry 2020 & 2033
- Table 26: Global Ethylene Carbonate Market Volume grams per milliliter Forecast, by End-user Industry 2020 & 2033
- Table 27: Global Ethylene Carbonate Market Revenue Million Forecast, by Country 2020 & 2033
- Table 28: Global Ethylene Carbonate Market Volume grams per milliliter Forecast, by Country 2020 & 2033
- Table 29: United States Ethylene Carbonate Market Revenue (Million) Forecast, by Application 2020 & 2033
- Table 30: United States Ethylene Carbonate Market Volume (grams per milliliter) Forecast, by Application 2020 & 2033
- Table 31: Canada Ethylene Carbonate Market Revenue (Million) Forecast, by Application 2020 & 2033
- Table 32: Canada Ethylene Carbonate Market Volume (grams per milliliter) Forecast, by Application 2020 & 2033
- Table 33: Mexico Ethylene Carbonate Market Revenue (Million) Forecast, by Application 2020 & 2033
- Table 34: Mexico Ethylene Carbonate Market Volume (grams per milliliter) Forecast, by Application 2020 & 2033
- Table 35: Global Ethylene Carbonate Market Revenue Million Forecast, by Application 2020 & 2033
- Table 36: Global Ethylene Carbonate Market Volume grams per milliliter Forecast, by Application 2020 & 2033
- Table 37: Global Ethylene Carbonate Market Revenue Million Forecast, by End-user Industry 2020 & 2033
- Table 38: Global Ethylene Carbonate Market Volume grams per milliliter Forecast, by End-user Industry 2020 & 2033
- Table 39: Global Ethylene Carbonate Market Revenue Million Forecast, by Country 2020 & 2033
- Table 40: Global Ethylene Carbonate Market Volume grams per milliliter Forecast, by Country 2020 & 2033
- Table 41: Germany Ethylene Carbonate Market Revenue (Million) Forecast, by Application 2020 & 2033
- Table 42: Germany Ethylene Carbonate Market Volume (grams per milliliter) Forecast, by Application 2020 & 2033
- Table 43: United Kingdom Ethylene Carbonate Market Revenue (Million) Forecast, by Application 2020 & 2033
- Table 44: United Kingdom Ethylene Carbonate Market Volume (grams per milliliter) Forecast, by Application 2020 & 2033
- Table 45: France Ethylene Carbonate Market Revenue (Million) Forecast, by Application 2020 & 2033
- Table 46: France Ethylene Carbonate Market Volume (grams per milliliter) Forecast, by Application 2020 & 2033
- Table 47: Italy Ethylene Carbonate Market Revenue (Million) Forecast, by Application 2020 & 2033
- Table 48: Italy Ethylene Carbonate Market Volume (grams per milliliter) Forecast, by Application 2020 & 2033
- Table 49: Rest of Europe Ethylene Carbonate Market Revenue (Million) Forecast, by Application 2020 & 2033
- Table 50: Rest of Europe Ethylene Carbonate Market Volume (grams per milliliter) Forecast, by Application 2020 & 2033
- Table 51: Global Ethylene Carbonate Market Revenue Million Forecast, by Application 2020 & 2033
- Table 52: Global Ethylene Carbonate Market Volume grams per milliliter Forecast, by Application 2020 & 2033
- Table 53: Global Ethylene Carbonate Market Revenue Million Forecast, by End-user Industry 2020 & 2033
- Table 54: Global Ethylene Carbonate Market Volume grams per milliliter Forecast, by End-user Industry 2020 & 2033
- Table 55: Global Ethylene Carbonate Market Revenue Million Forecast, by Country 2020 & 2033
- Table 56: Global Ethylene Carbonate Market Volume grams per milliliter Forecast, by Country 2020 & 2033
- Table 57: Brazil Ethylene Carbonate Market Revenue (Million) Forecast, by Application 2020 & 2033
- Table 58: Brazil Ethylene Carbonate Market Volume (grams per milliliter) Forecast, by Application 2020 & 2033
- Table 59: Argentina Ethylene Carbonate Market Revenue (Million) Forecast, by Application 2020 & 2033
- Table 60: Argentina Ethylene Carbonate Market Volume (grams per milliliter) Forecast, by Application 2020 & 2033
- Table 61: Rest of South America Ethylene Carbonate Market Revenue (Million) Forecast, by Application 2020 & 2033
- Table 62: Rest of South America Ethylene Carbonate Market Volume (grams per milliliter) Forecast, by Application 2020 & 2033
- Table 63: Global Ethylene Carbonate Market Revenue Million Forecast, by Application 2020 & 2033
- Table 64: Global Ethylene Carbonate Market Volume grams per milliliter Forecast, by Application 2020 & 2033
- Table 65: Global Ethylene Carbonate Market Revenue Million Forecast, by End-user Industry 2020 & 2033
- Table 66: Global Ethylene Carbonate Market Volume grams per milliliter Forecast, by End-user Industry 2020 & 2033
- Table 67: Global Ethylene Carbonate Market Revenue Million Forecast, by Country 2020 & 2033
- Table 68: Global Ethylene Carbonate Market Volume grams per milliliter Forecast, by Country 2020 & 2033
- Table 69: Saudi Arabia Ethylene Carbonate Market Revenue (Million) Forecast, by Application 2020 & 2033
- Table 70: Saudi Arabia Ethylene Carbonate Market Volume (grams per milliliter) Forecast, by Application 2020 & 2033
- Table 71: South Africa Ethylene Carbonate Market Revenue (Million) Forecast, by Application 2020 & 2033
- Table 72: South Africa Ethylene Carbonate Market Volume (grams per milliliter) Forecast, by Application 2020 & 2033
- Table 73: Rest of Middle East and Africa Ethylene Carbonate Market Revenue (Million) Forecast, by Application 2020 & 2033
- Table 74: Rest of Middle East and Africa Ethylene Carbonate Market Volume (grams per milliliter) Forecast, by Application 2020 & 2033
Frequently Asked Questions
1. What is the projected Compound Annual Growth Rate (CAGR) of the Ethylene Carbonate Market?
The projected CAGR is approximately 9.58%.
2. Which companies are prominent players in the Ethylene Carbonate Market?
Key companies in the market include Merck KGaA, Mitsubishi Chemical Corporation, Shandong Shida Shenghua Chemical Group Co Ltd, Tokyo Chemical Industry Co Ltd, OUCC, BASF SE, Huntsman International LLC, Taixing Taida Fine Chemical Co Ltd, Zibo Donghai Industries Co Ltd, Toagosei Co Ltd, Lixing Chemical, Shandong Senjie Cleantech Co Ltd, Liaoning Ganglong Chemical Co Ltd.
3. What are the main segments of the Ethylene Carbonate Market?
The market segments include Application, End-user Industry.
4. Can you provide details about the market size?
The market size is estimated to be USD 1.03 Million as of 2022.
5. What are some drivers contributing to market growth?
Increasing Demand from Electric Vehicle Manufacturers; Increasing Applications of Chemical Intermediates.
6. What are the notable trends driving market growth?
Increasing Demand for Lithium Batteries.
7. Are there any restraints impacting market growth?
Toxicity and Replacement Prospects by New Substitutes.
8. Can you provide examples of recent developments in the market?
June 2022: Lotte Chemical, a major South Korean chemical company, will collaborate with a chemical division of Sasol, a South African energy and chemical company, to evaluate the viability of constructing and operating a joint plant to produce electrolyte solvents, which are essential components of lithium-ion batteries for electric vehicles. The two companies will conduct a pre-feasibility study to determine whether Sasol's locations near Lake Charles, Louisiana, and Marl, Germany, are suitable for a facility that produces electrolyte solvents using feedstock from Sasol and third parties and technologies from LOTTE and third-party licensors.
9. What pricing options are available for accessing the report?
Pricing options include single-user, multi-user, and enterprise licenses priced at USD 4750, USD 5250, and USD 8750 respectively.
10. Is the market size provided in terms of value or volume?
The market size is provided in terms of value, measured in Million and volume, measured in grams per milliliter.
11. Are there any specific market keywords associated with the report?
Yes, the market keyword associated with the report is "Ethylene Carbonate Market," which aids in identifying and referencing the specific market segment covered.
12. How do I determine which pricing option suits my needs best?
The pricing options vary based on user requirements and access needs. Individual users may opt for single-user licenses, while businesses requiring broader access may choose multi-user or enterprise licenses for cost-effective access to the report.
13. Are there any additional resources or data provided in the Ethylene Carbonate Market report?
While the report offers comprehensive insights, it's advisable to review the specific contents or supplementary materials provided to ascertain if additional resources or data are available.
14. How can I stay updated on further developments or reports in the Ethylene Carbonate Market?
To stay informed about further developments, trends, and reports in the Ethylene Carbonate Market, consider subscribing to industry newsletters, following relevant companies and organizations, or regularly checking reputable industry news sources and publications.
Methodology
Step 1 - Identification of Relevant Samples Size from Population Database


Step 2 - Approaches for Defining Global Market Size (Value, Volume* & Price*)

Note*: In applicable scenarios
Step 3 - Data Sources
Primary Research
- Web Analytics
- Survey Reports
- Research Institute
- Latest Research Reports
- Opinion Leaders
Secondary Research
- Annual Reports
- White Paper
- Latest Press Release
- Industry Association
- Paid Database
- Investor Presentations

Step 4 - Data Triangulation
Involves using different sources of information in order to increase the validity of a study
These sources are likely to be stakeholders in a program - participants, other researchers, program staff, other community members, and so on.
Then we put all data in single framework & apply various statistical tools to find out the dynamic on the market.
During the analysis stage, feedback from the stakeholder groups would be compared to determine areas of agreement as well as areas of divergence