
Key Insights
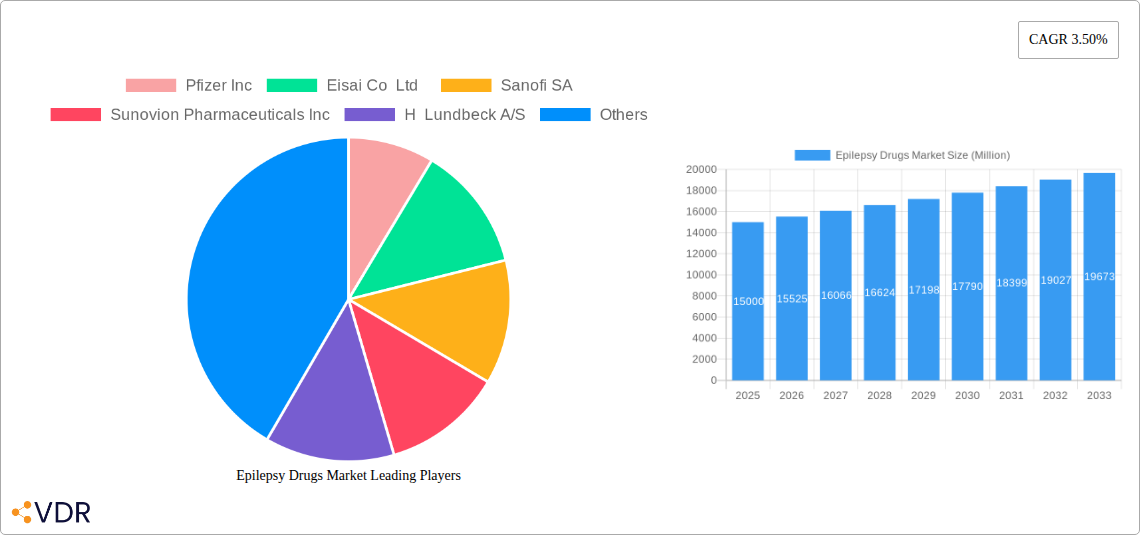
The global epilepsy drugs market, valued at approximately $XX million in 2025, is projected to experience steady growth, driven by a rising prevalence of epilepsy, particularly in developing nations, and the increasing availability of advanced therapies. The market's 3.50% CAGR from 2019 to 2033 indicates a consistent demand for effective treatment options. Several factors contribute to this growth, including improved diagnostics, increased awareness, and the ongoing development of novel anti-epileptic drugs (AEDs) targeting specific epilepsy subtypes. The market is segmented by drug generation (first, second, and third generation AEDs) reflecting the evolution of treatment approaches. First-generation AEDs, while still prevalent, are gradually losing market share to newer, second and third-generation drugs offering improved efficacy and reduced side effects. The distribution channels are primarily hospital pharmacies and retail pharmacies, with hospital pharmacies holding a significant share due to the complexity of epilepsy management. Key players, including Pfizer, Eisai, Sanofi, and others, are actively involved in research and development, driving innovation within the market and contributing to its growth trajectory. Competition is intense, with companies focusing on developing targeted therapies, improving drug delivery systems, and expanding their market presence geographically.
The North American and European markets currently dominate the epilepsy drug market, benefiting from robust healthcare infrastructure and high per capita healthcare expenditure. However, the Asia-Pacific region is expected to witness significant growth in the coming years, driven by increasing healthcare spending, rising prevalence of epilepsy, and growing awareness about the disease. This growth will be influenced by factors such as expanding healthcare access, rising disposable incomes, and increasing awareness campaigns focused on early diagnosis and treatment. Despite the overall positive outlook, market growth may be restrained by factors such as the high cost of treatment, particularly for newer generation AEDs, and the potential for drug resistance in some patients. Further challenges include managing adverse effects associated with certain AEDs and the need for personalized treatment approaches to optimize patient outcomes.
Epilepsy Drugs Market: A Comprehensive Report (2019-2033)
This comprehensive report provides a detailed analysis of the Epilepsy Drugs market, encompassing market dynamics, growth trends, regional dominance, product landscape, key players, and future outlook. The report covers the period from 2019 to 2033, with 2025 as the base year and a forecast period from 2025 to 2033. The parent market is the pharmaceutical market, and the child market is the epilepsy treatment segment. The market size is estimated at xx Million units in 2025. This report is invaluable for pharmaceutical companies, investors, researchers, and healthcare professionals seeking insights into this crucial sector.
Epilepsy Drugs Market Dynamics & Structure
The Epilepsy Drugs market is characterized by moderate concentration, with several multinational pharmaceutical companies holding significant market share. Technological innovation, particularly in the development of novel therapies targeting specific epilepsy subtypes, is a major growth driver. Stringent regulatory frameworks governing drug approvals and safety standards influence market entry and product lifecycle management. Competitive product substitutes, including newer generation anti-epileptics, are continuously emerging, impacting market dynamics. The end-user demographic comprises individuals of all ages with varying epilepsy severities. M&A activity in the market is steady, with larger companies acquiring smaller innovative firms to expand their product portfolios and enhance their market presence.
- Market Concentration: Moderately concentrated, with top 5 players holding approximately xx% market share in 2025.
- Technological Innovation: Focus on developing targeted therapies, improving efficacy, and reducing side effects.
- Regulatory Landscape: Stringent FDA and EMA approvals impact market entry and timelines.
- Competitive Substitutes: Emergence of newer generation AEDs creates competitive pressure.
- End-User Demographics: Patients across all age groups and epilepsy severities.
- M&A Trends: Consistent M&A activity, driven by portfolio expansion and innovation access. xx major deals observed between 2019-2024.
Epilepsy Drugs Market Growth Trends & Insights
The Epilepsy Drugs market experienced a CAGR of xx% during the historical period (2019-2024), driven by increasing prevalence of epilepsy, growing awareness, and improved diagnosis rates. Adoption rates of newer generation anti-epileptic drugs (AEDs) are increasing due to their enhanced efficacy and reduced side effect profiles. Technological disruptions, such as the development of personalized medicine approaches, are creating new opportunities. Shifting consumer behavior towards seeking more effective and personalized treatments further fuels market growth. The market is projected to maintain a CAGR of xx% during the forecast period (2025-2033), reaching an estimated xx Million units by 2033. Market penetration of newer generation AEDs is expected to increase significantly.

Dominant Regions, Countries, or Segments in Epilepsy Drugs Market
North America currently holds the largest market share in the Epilepsy Drugs market, driven by high prevalence rates, advanced healthcare infrastructure, and robust research and development activities. Within the drug segments, second-generation anti-epileptics constitute the largest market share, followed by third-generation AEDs, reflecting the continuous innovation and adoption of newer therapies. Hospital pharmacies are the primary distribution channel, due to the specialized nature of epilepsy treatment.
- Key Drivers: High epilepsy prevalence, advanced healthcare systems, robust R&D.
- North America Dominance: Largest market share, driven by factors listed above.
- Second-Generation AEDs: Largest drug segment due to established efficacy and availability.
- Hospital Pharmacies: Primary distribution channel due to specialized care requirements.
Epilepsy Drugs Market Product Landscape
The Epilepsy Drugs market features a diverse range of products, including first, second, and third-generation anti-epileptic drugs, each with unique mechanisms of action, efficacy profiles, and side effect profiles. Recent innovations focus on developing targeted therapies for specific epilepsy subtypes, improving drug delivery systems, and enhancing patient compliance. These advancements aim to optimize treatment outcomes and improve patients’ quality of life.
Key Drivers, Barriers & Challenges in Epilepsy Drugs Market
Key Drivers:
- Rising prevalence of epilepsy globally.
- Growing awareness and improved diagnosis rates.
- Development of more effective and targeted therapies.
Challenges & Restraints:
- High cost of treatment can limit accessibility, especially in developing countries.
- Drug resistance and side effects remain significant challenges.
- Stringent regulatory processes can slow down drug development and market entry. Estimated xx% of new drug applications are rejected annually due to safety and efficacy concerns.
Emerging Opportunities in Epilepsy Drugs Market
- Development of personalized medicine approaches targeting specific epilepsy subtypes.
- Exploration of novel drug delivery systems to improve patient compliance.
- Expansion into untapped markets in developing countries.
- Focus on digital health solutions for improved patient monitoring and management.
Growth Accelerators in the Epilepsy Drugs Market Industry
Strategic partnerships between pharmaceutical companies and research institutions are accelerating innovation in the development of new AEDs. Technological advancements, such as the use of artificial intelligence in drug discovery, are streamlining the development process. Expanding market access in developing countries with high unmet needs presents a significant growth opportunity.
Key Players Shaping the Epilepsy Drugs Market Market
- Pfizer Inc
- Eisai Co Ltd
- Sanofi SA
- Sunovion Pharmaceuticals Inc
- H Lundbeck A/S
- Novartis AG
- Alkem Labs
- Takeda Pharmaceutical Company Limited
- Abbott Laboratories
- UCB S A
- Johnson & Johnson
- GW Pharmaceuticals plc
- Sun Pharmaceutical Industries Limited
- GlaxoSmithKline PLC
Notable Milestones in Epilepsy Drugs Market Sector
- March 2022: Lupin received FDA approval for its Vigabatrin ANDA.
- March 2022: Marinus Pharmaceuticals' Ztalmy received FDA approval for treating seizures in patients with CDKL5 deficiency.
In-Depth Epilepsy Drugs Market Market Outlook
The Epilepsy Drugs market is poised for significant growth in the coming years, driven by continuous innovation in drug development, increasing awareness, and improved access to treatment. Strategic partnerships and expansion into new markets will further accelerate growth. Companies focusing on personalized medicine and innovative drug delivery systems are expected to gain a competitive edge. The market presents lucrative opportunities for pharmaceutical companies and investors alike.
Epilepsy Drugs Market Segmentation
-
1. Drugs
- 1.1. First Generation Anti-epileptics
- 1.2. Second Generation Anti-epileptics
- 1.3. Third Generation Anti-epileptics
-
2. Distribution Channel
- 2.1. Hospital Pharmacy
- 2.2. Retail Pharmacies
- 2.3. Other Distribution Channels
Epilepsy Drugs Market Segmentation By Geography
-
1. North America
- 1.1. United States
- 1.2. Canada
- 1.3. Mexico
-
2. Europe
- 2.1. Germany
- 2.2. United Kingdom
- 2.3. France
- 2.4. Italy
- 2.5. Spain
- 2.6. Rest of Europe
-
3. Asia Pacific
- 3.1. China
- 3.2. Japan
- 3.3. India
- 3.4. Australia
- 3.5. South Korea
- 3.6. Rest of Asia Pacific
-
4. Middle East and Africa
- 4.1. GCC
- 4.2. South Africa
- 4.3. Rest of Middle East and Africa
-
5. South America
- 5.1. Brazil
- 5.2. Argentina
- 5.3. Rest of South America

Epilepsy Drugs Market REPORT HIGHLIGHTS
| Aspects | Details |
|---|---|
| Study Period | 2019-2033 |
| Base Year | 2024 |
| Estimated Year | 2025 |
| Forecast Period | 2025-2033 |
| Historical Period | 2019-2024 |
| Growth Rate | CAGR of 3.50% from 2019-2033 |
| Segmentation |
|
Table of Contents
- 1. Introduction
- 1.1. Research Scope
- 1.2. Market Segmentation
- 1.3. Research Methodology
- 1.4. Definitions and Assumptions
- 2. Executive Summary
- 2.1. Introduction
- 3. Market Dynamics
- 3.1. Introduction
- 3.2. Market Drivers
- 3.2.1. Rise in the New Drug Approvals over the Past Few Years; Increase in the Cases of Epilepsy
- 3.3. Market Restrains
- 3.3.1. Side Effects Associated With the Drugs; Recent Patent Expiration of Major Brands
- 3.4. Market Trends
- 3.4.1. Second Generation Anti-epileptics is Expected to Hold a Significant Market Share Over the Forecast Period
- 4. Market Factor Analysis
- 4.1. Porters Five Forces
- 4.2. Supply/Value Chain
- 4.3. PESTEL analysis
- 4.4. Market Entropy
- 4.5. Patent/Trademark Analysis
- 5. Global Epilepsy Drugs Market Analysis, Insights and Forecast, 2019-2031
- 5.1. Market Analysis, Insights and Forecast - by Drugs
- 5.1.1. First Generation Anti-epileptics
- 5.1.2. Second Generation Anti-epileptics
- 5.1.3. Third Generation Anti-epileptics
- 5.2. Market Analysis, Insights and Forecast - by Distribution Channel
- 5.2.1. Hospital Pharmacy
- 5.2.2. Retail Pharmacies
- 5.2.3. Other Distribution Channels
- 5.3. Market Analysis, Insights and Forecast - by Region
- 5.3.1. North America
- 5.3.2. Europe
- 5.3.3. Asia Pacific
- 5.3.4. Middle East and Africa
- 5.3.5. South America
- 5.1. Market Analysis, Insights and Forecast - by Drugs
- 6. North America Epilepsy Drugs Market Analysis, Insights and Forecast, 2019-2031
- 6.1. Market Analysis, Insights and Forecast - by Drugs
- 6.1.1. First Generation Anti-epileptics
- 6.1.2. Second Generation Anti-epileptics
- 6.1.3. Third Generation Anti-epileptics
- 6.2. Market Analysis, Insights and Forecast - by Distribution Channel
- 6.2.1. Hospital Pharmacy
- 6.2.2. Retail Pharmacies
- 6.2.3. Other Distribution Channels
- 6.1. Market Analysis, Insights and Forecast - by Drugs
- 7. Europe Epilepsy Drugs Market Analysis, Insights and Forecast, 2019-2031
- 7.1. Market Analysis, Insights and Forecast - by Drugs
- 7.1.1. First Generation Anti-epileptics
- 7.1.2. Second Generation Anti-epileptics
- 7.1.3. Third Generation Anti-epileptics
- 7.2. Market Analysis, Insights and Forecast - by Distribution Channel
- 7.2.1. Hospital Pharmacy
- 7.2.2. Retail Pharmacies
- 7.2.3. Other Distribution Channels
- 7.1. Market Analysis, Insights and Forecast - by Drugs
- 8. Asia Pacific Epilepsy Drugs Market Analysis, Insights and Forecast, 2019-2031
- 8.1. Market Analysis, Insights and Forecast - by Drugs
- 8.1.1. First Generation Anti-epileptics
- 8.1.2. Second Generation Anti-epileptics
- 8.1.3. Third Generation Anti-epileptics
- 8.2. Market Analysis, Insights and Forecast - by Distribution Channel
- 8.2.1. Hospital Pharmacy
- 8.2.2. Retail Pharmacies
- 8.2.3. Other Distribution Channels
- 8.1. Market Analysis, Insights and Forecast - by Drugs
- 9. Middle East and Africa Epilepsy Drugs Market Analysis, Insights and Forecast, 2019-2031
- 9.1. Market Analysis, Insights and Forecast - by Drugs
- 9.1.1. First Generation Anti-epileptics
- 9.1.2. Second Generation Anti-epileptics
- 9.1.3. Third Generation Anti-epileptics
- 9.2. Market Analysis, Insights and Forecast - by Distribution Channel
- 9.2.1. Hospital Pharmacy
- 9.2.2. Retail Pharmacies
- 9.2.3. Other Distribution Channels
- 9.1. Market Analysis, Insights and Forecast - by Drugs
- 10. South America Epilepsy Drugs Market Analysis, Insights and Forecast, 2019-2031
- 10.1. Market Analysis, Insights and Forecast - by Drugs
- 10.1.1. First Generation Anti-epileptics
- 10.1.2. Second Generation Anti-epileptics
- 10.1.3. Third Generation Anti-epileptics
- 10.2. Market Analysis, Insights and Forecast - by Distribution Channel
- 10.2.1. Hospital Pharmacy
- 10.2.2. Retail Pharmacies
- 10.2.3. Other Distribution Channels
- 10.1. Market Analysis, Insights and Forecast - by Drugs
- 11. North America Epilepsy Drugs Market Analysis, Insights and Forecast, 2019-2031
- 11.1. Market Analysis, Insights and Forecast - By Country/Sub-region
- 11.1.1. undefined
- 12. Europe Epilepsy Drugs Market Analysis, Insights and Forecast, 2019-2031
- 12.1. Market Analysis, Insights and Forecast - By Country/Sub-region
- 12.1.1. undefined
- 13. Asia Pacific Epilepsy Drugs Market Analysis, Insights and Forecast, 2019-2031
- 13.1. Market Analysis, Insights and Forecast - By Country/Sub-region
- 13.1.1. undefined
- 14. Middle East and Africa Epilepsy Drugs Market Analysis, Insights and Forecast, 2019-2031
- 14.1. Market Analysis, Insights and Forecast - By Country/Sub-region
- 14.1.1. undefined
- 15. South America Epilepsy Drugs Market Analysis, Insights and Forecast, 2019-2031
- 15.1. Market Analysis, Insights and Forecast - By Country/Sub-region
- 15.1.1. undefined
- 16. Competitive Analysis
- 16.1. Global Market Share Analysis 2024
- 16.2. Company Profiles
- 16.2.1 Pfizer Inc
- 16.2.1.1. Overview
- 16.2.1.2. Products
- 16.2.1.3. SWOT Analysis
- 16.2.1.4. Recent Developments
- 16.2.1.5. Financials (Based on Availability)
- 16.2.2 Eisai Co Ltd
- 16.2.2.1. Overview
- 16.2.2.2. Products
- 16.2.2.3. SWOT Analysis
- 16.2.2.4. Recent Developments
- 16.2.2.5. Financials (Based on Availability)
- 16.2.3 Sanofi SA
- 16.2.3.1. Overview
- 16.2.3.2. Products
- 16.2.3.3. SWOT Analysis
- 16.2.3.4. Recent Developments
- 16.2.3.5. Financials (Based on Availability)
- 16.2.4 Sunovion Pharmaceuticals Inc
- 16.2.4.1. Overview
- 16.2.4.2. Products
- 16.2.4.3. SWOT Analysis
- 16.2.4.4. Recent Developments
- 16.2.4.5. Financials (Based on Availability)
- 16.2.5 H Lundbeck A/S
- 16.2.5.1. Overview
- 16.2.5.2. Products
- 16.2.5.3. SWOT Analysis
- 16.2.5.4. Recent Developments
- 16.2.5.5. Financials (Based on Availability)
- 16.2.6 Novartis AG
- 16.2.6.1. Overview
- 16.2.6.2. Products
- 16.2.6.3. SWOT Analysis
- 16.2.6.4. Recent Developments
- 16.2.6.5. Financials (Based on Availability)
- 16.2.7 Alkem Labs
- 16.2.7.1. Overview
- 16.2.7.2. Products
- 16.2.7.3. SWOT Analysis
- 16.2.7.4. Recent Developments
- 16.2.7.5. Financials (Based on Availability)
- 16.2.8 Takeda Pharmaceutical Company Limited
- 16.2.8.1. Overview
- 16.2.8.2. Products
- 16.2.8.3. SWOT Analysis
- 16.2.8.4. Recent Developments
- 16.2.8.5. Financials (Based on Availability)
- 16.2.9 Abbott Laboratories
- 16.2.9.1. Overview
- 16.2.9.2. Products
- 16.2.9.3. SWOT Analysis
- 16.2.9.4. Recent Developments
- 16.2.9.5. Financials (Based on Availability)
- 16.2.10 UCB S A
- 16.2.10.1. Overview
- 16.2.10.2. Products
- 16.2.10.3. SWOT Analysis
- 16.2.10.4. Recent Developments
- 16.2.10.5. Financials (Based on Availability)
- 16.2.11 Johnson & Johnson
- 16.2.11.1. Overview
- 16.2.11.2. Products
- 16.2.11.3. SWOT Analysis
- 16.2.11.4. Recent Developments
- 16.2.11.5. Financials (Based on Availability)
- 16.2.12 GW Pharmaceuticals plc
- 16.2.12.1. Overview
- 16.2.12.2. Products
- 16.2.12.3. SWOT Analysis
- 16.2.12.4. Recent Developments
- 16.2.12.5. Financials (Based on Availability)
- 16.2.13 Sun Pharmaceutical Industries Limited
- 16.2.13.1. Overview
- 16.2.13.2. Products
- 16.2.13.3. SWOT Analysis
- 16.2.13.4. Recent Developments
- 16.2.13.5. Financials (Based on Availability)
- 16.2.14 GlaxoSmithKline PLC
- 16.2.14.1. Overview
- 16.2.14.2. Products
- 16.2.14.3. SWOT Analysis
- 16.2.14.4. Recent Developments
- 16.2.14.5. Financials (Based on Availability)
- 16.2.1 Pfizer Inc
List of Figures
- Figure 1: Global Epilepsy Drugs Market Revenue Breakdown (Million, %) by Region 2024 & 2032
- Figure 2: Global Epilepsy Drugs Market Volume Breakdown (K Unit, %) by Region 2024 & 2032
- Figure 3: North America Epilepsy Drugs Market Revenue (Million), by Country 2024 & 2032
- Figure 4: North America Epilepsy Drugs Market Volume (K Unit), by Country 2024 & 2032
- Figure 5: North America Epilepsy Drugs Market Revenue Share (%), by Country 2024 & 2032
- Figure 6: North America Epilepsy Drugs Market Volume Share (%), by Country 2024 & 2032
- Figure 7: Europe Epilepsy Drugs Market Revenue (Million), by Country 2024 & 2032
- Figure 8: Europe Epilepsy Drugs Market Volume (K Unit), by Country 2024 & 2032
- Figure 9: Europe Epilepsy Drugs Market Revenue Share (%), by Country 2024 & 2032
- Figure 10: Europe Epilepsy Drugs Market Volume Share (%), by Country 2024 & 2032
- Figure 11: Asia Pacific Epilepsy Drugs Market Revenue (Million), by Country 2024 & 2032
- Figure 12: Asia Pacific Epilepsy Drugs Market Volume (K Unit), by Country 2024 & 2032
- Figure 13: Asia Pacific Epilepsy Drugs Market Revenue Share (%), by Country 2024 & 2032
- Figure 14: Asia Pacific Epilepsy Drugs Market Volume Share (%), by Country 2024 & 2032
- Figure 15: Middle East and Africa Epilepsy Drugs Market Revenue (Million), by Country 2024 & 2032
- Figure 16: Middle East and Africa Epilepsy Drugs Market Volume (K Unit), by Country 2024 & 2032
- Figure 17: Middle East and Africa Epilepsy Drugs Market Revenue Share (%), by Country 2024 & 2032
- Figure 18: Middle East and Africa Epilepsy Drugs Market Volume Share (%), by Country 2024 & 2032
- Figure 19: South America Epilepsy Drugs Market Revenue (Million), by Country 2024 & 2032
- Figure 20: South America Epilepsy Drugs Market Volume (K Unit), by Country 2024 & 2032
- Figure 21: South America Epilepsy Drugs Market Revenue Share (%), by Country 2024 & 2032
- Figure 22: South America Epilepsy Drugs Market Volume Share (%), by Country 2024 & 2032
- Figure 23: North America Epilepsy Drugs Market Revenue (Million), by Drugs 2024 & 2032
- Figure 24: North America Epilepsy Drugs Market Volume (K Unit), by Drugs 2024 & 2032
- Figure 25: North America Epilepsy Drugs Market Revenue Share (%), by Drugs 2024 & 2032
- Figure 26: North America Epilepsy Drugs Market Volume Share (%), by Drugs 2024 & 2032
- Figure 27: North America Epilepsy Drugs Market Revenue (Million), by Distribution Channel 2024 & 2032
- Figure 28: North America Epilepsy Drugs Market Volume (K Unit), by Distribution Channel 2024 & 2032
- Figure 29: North America Epilepsy Drugs Market Revenue Share (%), by Distribution Channel 2024 & 2032
- Figure 30: North America Epilepsy Drugs Market Volume Share (%), by Distribution Channel 2024 & 2032
- Figure 31: North America Epilepsy Drugs Market Revenue (Million), by Country 2024 & 2032
- Figure 32: North America Epilepsy Drugs Market Volume (K Unit), by Country 2024 & 2032
- Figure 33: North America Epilepsy Drugs Market Revenue Share (%), by Country 2024 & 2032
- Figure 34: North America Epilepsy Drugs Market Volume Share (%), by Country 2024 & 2032
- Figure 35: Europe Epilepsy Drugs Market Revenue (Million), by Drugs 2024 & 2032
- Figure 36: Europe Epilepsy Drugs Market Volume (K Unit), by Drugs 2024 & 2032
- Figure 37: Europe Epilepsy Drugs Market Revenue Share (%), by Drugs 2024 & 2032
- Figure 38: Europe Epilepsy Drugs Market Volume Share (%), by Drugs 2024 & 2032
- Figure 39: Europe Epilepsy Drugs Market Revenue (Million), by Distribution Channel 2024 & 2032
- Figure 40: Europe Epilepsy Drugs Market Volume (K Unit), by Distribution Channel 2024 & 2032
- Figure 41: Europe Epilepsy Drugs Market Revenue Share (%), by Distribution Channel 2024 & 2032
- Figure 42: Europe Epilepsy Drugs Market Volume Share (%), by Distribution Channel 2024 & 2032
- Figure 43: Europe Epilepsy Drugs Market Revenue (Million), by Country 2024 & 2032
- Figure 44: Europe Epilepsy Drugs Market Volume (K Unit), by Country 2024 & 2032
- Figure 45: Europe Epilepsy Drugs Market Revenue Share (%), by Country 2024 & 2032
- Figure 46: Europe Epilepsy Drugs Market Volume Share (%), by Country 2024 & 2032
- Figure 47: Asia Pacific Epilepsy Drugs Market Revenue (Million), by Drugs 2024 & 2032
- Figure 48: Asia Pacific Epilepsy Drugs Market Volume (K Unit), by Drugs 2024 & 2032
- Figure 49: Asia Pacific Epilepsy Drugs Market Revenue Share (%), by Drugs 2024 & 2032
- Figure 50: Asia Pacific Epilepsy Drugs Market Volume Share (%), by Drugs 2024 & 2032
- Figure 51: Asia Pacific Epilepsy Drugs Market Revenue (Million), by Distribution Channel 2024 & 2032
- Figure 52: Asia Pacific Epilepsy Drugs Market Volume (K Unit), by Distribution Channel 2024 & 2032
- Figure 53: Asia Pacific Epilepsy Drugs Market Revenue Share (%), by Distribution Channel 2024 & 2032
- Figure 54: Asia Pacific Epilepsy Drugs Market Volume Share (%), by Distribution Channel 2024 & 2032
- Figure 55: Asia Pacific Epilepsy Drugs Market Revenue (Million), by Country 2024 & 2032
- Figure 56: Asia Pacific Epilepsy Drugs Market Volume (K Unit), by Country 2024 & 2032
- Figure 57: Asia Pacific Epilepsy Drugs Market Revenue Share (%), by Country 2024 & 2032
- Figure 58: Asia Pacific Epilepsy Drugs Market Volume Share (%), by Country 2024 & 2032
- Figure 59: Middle East and Africa Epilepsy Drugs Market Revenue (Million), by Drugs 2024 & 2032
- Figure 60: Middle East and Africa Epilepsy Drugs Market Volume (K Unit), by Drugs 2024 & 2032
- Figure 61: Middle East and Africa Epilepsy Drugs Market Revenue Share (%), by Drugs 2024 & 2032
- Figure 62: Middle East and Africa Epilepsy Drugs Market Volume Share (%), by Drugs 2024 & 2032
- Figure 63: Middle East and Africa Epilepsy Drugs Market Revenue (Million), by Distribution Channel 2024 & 2032
- Figure 64: Middle East and Africa Epilepsy Drugs Market Volume (K Unit), by Distribution Channel 2024 & 2032
- Figure 65: Middle East and Africa Epilepsy Drugs Market Revenue Share (%), by Distribution Channel 2024 & 2032
- Figure 66: Middle East and Africa Epilepsy Drugs Market Volume Share (%), by Distribution Channel 2024 & 2032
- Figure 67: Middle East and Africa Epilepsy Drugs Market Revenue (Million), by Country 2024 & 2032
- Figure 68: Middle East and Africa Epilepsy Drugs Market Volume (K Unit), by Country 2024 & 2032
- Figure 69: Middle East and Africa Epilepsy Drugs Market Revenue Share (%), by Country 2024 & 2032
- Figure 70: Middle East and Africa Epilepsy Drugs Market Volume Share (%), by Country 2024 & 2032
- Figure 71: South America Epilepsy Drugs Market Revenue (Million), by Drugs 2024 & 2032
- Figure 72: South America Epilepsy Drugs Market Volume (K Unit), by Drugs 2024 & 2032
- Figure 73: South America Epilepsy Drugs Market Revenue Share (%), by Drugs 2024 & 2032
- Figure 74: South America Epilepsy Drugs Market Volume Share (%), by Drugs 2024 & 2032
- Figure 75: South America Epilepsy Drugs Market Revenue (Million), by Distribution Channel 2024 & 2032
- Figure 76: South America Epilepsy Drugs Market Volume (K Unit), by Distribution Channel 2024 & 2032
- Figure 77: South America Epilepsy Drugs Market Revenue Share (%), by Distribution Channel 2024 & 2032
- Figure 78: South America Epilepsy Drugs Market Volume Share (%), by Distribution Channel 2024 & 2032
- Figure 79: South America Epilepsy Drugs Market Revenue (Million), by Country 2024 & 2032
- Figure 80: South America Epilepsy Drugs Market Volume (K Unit), by Country 2024 & 2032
- Figure 81: South America Epilepsy Drugs Market Revenue Share (%), by Country 2024 & 2032
- Figure 82: South America Epilepsy Drugs Market Volume Share (%), by Country 2024 & 2032
List of Tables
- Table 1: Global Epilepsy Drugs Market Revenue Million Forecast, by Region 2019 & 2032
- Table 2: Global Epilepsy Drugs Market Volume K Unit Forecast, by Region 2019 & 2032
- Table 3: Global Epilepsy Drugs Market Revenue Million Forecast, by Drugs 2019 & 2032
- Table 4: Global Epilepsy Drugs Market Volume K Unit Forecast, by Drugs 2019 & 2032
- Table 5: Global Epilepsy Drugs Market Revenue Million Forecast, by Distribution Channel 2019 & 2032
- Table 6: Global Epilepsy Drugs Market Volume K Unit Forecast, by Distribution Channel 2019 & 2032
- Table 7: Global Epilepsy Drugs Market Revenue Million Forecast, by Region 2019 & 2032
- Table 8: Global Epilepsy Drugs Market Volume K Unit Forecast, by Region 2019 & 2032
- Table 9: Global Epilepsy Drugs Market Revenue Million Forecast, by Country 2019 & 2032
- Table 10: Global Epilepsy Drugs Market Volume K Unit Forecast, by Country 2019 & 2032
- Table 11: Global Epilepsy Drugs Market Revenue Million Forecast, by Country 2019 & 2032
- Table 12: Global Epilepsy Drugs Market Volume K Unit Forecast, by Country 2019 & 2032
- Table 13: Global Epilepsy Drugs Market Revenue Million Forecast, by Country 2019 & 2032
- Table 14: Global Epilepsy Drugs Market Volume K Unit Forecast, by Country 2019 & 2032
- Table 15: Global Epilepsy Drugs Market Revenue Million Forecast, by Country 2019 & 2032
- Table 16: Global Epilepsy Drugs Market Volume K Unit Forecast, by Country 2019 & 2032
- Table 17: Global Epilepsy Drugs Market Revenue Million Forecast, by Country 2019 & 2032
- Table 18: Global Epilepsy Drugs Market Volume K Unit Forecast, by Country 2019 & 2032
- Table 19: Global Epilepsy Drugs Market Revenue Million Forecast, by Drugs 2019 & 2032
- Table 20: Global Epilepsy Drugs Market Volume K Unit Forecast, by Drugs 2019 & 2032
- Table 21: Global Epilepsy Drugs Market Revenue Million Forecast, by Distribution Channel 2019 & 2032
- Table 22: Global Epilepsy Drugs Market Volume K Unit Forecast, by Distribution Channel 2019 & 2032
- Table 23: Global Epilepsy Drugs Market Revenue Million Forecast, by Country 2019 & 2032
- Table 24: Global Epilepsy Drugs Market Volume K Unit Forecast, by Country 2019 & 2032
- Table 25: United States Epilepsy Drugs Market Revenue (Million) Forecast, by Application 2019 & 2032
- Table 26: United States Epilepsy Drugs Market Volume (K Unit) Forecast, by Application 2019 & 2032
- Table 27: Canada Epilepsy Drugs Market Revenue (Million) Forecast, by Application 2019 & 2032
- Table 28: Canada Epilepsy Drugs Market Volume (K Unit) Forecast, by Application 2019 & 2032
- Table 29: Mexico Epilepsy Drugs Market Revenue (Million) Forecast, by Application 2019 & 2032
- Table 30: Mexico Epilepsy Drugs Market Volume (K Unit) Forecast, by Application 2019 & 2032
- Table 31: Global Epilepsy Drugs Market Revenue Million Forecast, by Drugs 2019 & 2032
- Table 32: Global Epilepsy Drugs Market Volume K Unit Forecast, by Drugs 2019 & 2032
- Table 33: Global Epilepsy Drugs Market Revenue Million Forecast, by Distribution Channel 2019 & 2032
- Table 34: Global Epilepsy Drugs Market Volume K Unit Forecast, by Distribution Channel 2019 & 2032
- Table 35: Global Epilepsy Drugs Market Revenue Million Forecast, by Country 2019 & 2032
- Table 36: Global Epilepsy Drugs Market Volume K Unit Forecast, by Country 2019 & 2032
- Table 37: Germany Epilepsy Drugs Market Revenue (Million) Forecast, by Application 2019 & 2032
- Table 38: Germany Epilepsy Drugs Market Volume (K Unit) Forecast, by Application 2019 & 2032
- Table 39: United Kingdom Epilepsy Drugs Market Revenue (Million) Forecast, by Application 2019 & 2032
- Table 40: United Kingdom Epilepsy Drugs Market Volume (K Unit) Forecast, by Application 2019 & 2032
- Table 41: France Epilepsy Drugs Market Revenue (Million) Forecast, by Application 2019 & 2032
- Table 42: France Epilepsy Drugs Market Volume (K Unit) Forecast, by Application 2019 & 2032
- Table 43: Italy Epilepsy Drugs Market Revenue (Million) Forecast, by Application 2019 & 2032
- Table 44: Italy Epilepsy Drugs Market Volume (K Unit) Forecast, by Application 2019 & 2032
- Table 45: Spain Epilepsy Drugs Market Revenue (Million) Forecast, by Application 2019 & 2032
- Table 46: Spain Epilepsy Drugs Market Volume (K Unit) Forecast, by Application 2019 & 2032
- Table 47: Rest of Europe Epilepsy Drugs Market Revenue (Million) Forecast, by Application 2019 & 2032
- Table 48: Rest of Europe Epilepsy Drugs Market Volume (K Unit) Forecast, by Application 2019 & 2032
- Table 49: Global Epilepsy Drugs Market Revenue Million Forecast, by Drugs 2019 & 2032
- Table 50: Global Epilepsy Drugs Market Volume K Unit Forecast, by Drugs 2019 & 2032
- Table 51: Global Epilepsy Drugs Market Revenue Million Forecast, by Distribution Channel 2019 & 2032
- Table 52: Global Epilepsy Drugs Market Volume K Unit Forecast, by Distribution Channel 2019 & 2032
- Table 53: Global Epilepsy Drugs Market Revenue Million Forecast, by Country 2019 & 2032
- Table 54: Global Epilepsy Drugs Market Volume K Unit Forecast, by Country 2019 & 2032
- Table 55: China Epilepsy Drugs Market Revenue (Million) Forecast, by Application 2019 & 2032
- Table 56: China Epilepsy Drugs Market Volume (K Unit) Forecast, by Application 2019 & 2032
- Table 57: Japan Epilepsy Drugs Market Revenue (Million) Forecast, by Application 2019 & 2032
- Table 58: Japan Epilepsy Drugs Market Volume (K Unit) Forecast, by Application 2019 & 2032
- Table 59: India Epilepsy Drugs Market Revenue (Million) Forecast, by Application 2019 & 2032
- Table 60: India Epilepsy Drugs Market Volume (K Unit) Forecast, by Application 2019 & 2032
- Table 61: Australia Epilepsy Drugs Market Revenue (Million) Forecast, by Application 2019 & 2032
- Table 62: Australia Epilepsy Drugs Market Volume (K Unit) Forecast, by Application 2019 & 2032
- Table 63: South Korea Epilepsy Drugs Market Revenue (Million) Forecast, by Application 2019 & 2032
- Table 64: South Korea Epilepsy Drugs Market Volume (K Unit) Forecast, by Application 2019 & 2032
- Table 65: Rest of Asia Pacific Epilepsy Drugs Market Revenue (Million) Forecast, by Application 2019 & 2032
- Table 66: Rest of Asia Pacific Epilepsy Drugs Market Volume (K Unit) Forecast, by Application 2019 & 2032
- Table 67: Global Epilepsy Drugs Market Revenue Million Forecast, by Drugs 2019 & 2032
- Table 68: Global Epilepsy Drugs Market Volume K Unit Forecast, by Drugs 2019 & 2032
- Table 69: Global Epilepsy Drugs Market Revenue Million Forecast, by Distribution Channel 2019 & 2032
- Table 70: Global Epilepsy Drugs Market Volume K Unit Forecast, by Distribution Channel 2019 & 2032
- Table 71: Global Epilepsy Drugs Market Revenue Million Forecast, by Country 2019 & 2032
- Table 72: Global Epilepsy Drugs Market Volume K Unit Forecast, by Country 2019 & 2032
- Table 73: GCC Epilepsy Drugs Market Revenue (Million) Forecast, by Application 2019 & 2032
- Table 74: GCC Epilepsy Drugs Market Volume (K Unit) Forecast, by Application 2019 & 2032
- Table 75: South Africa Epilepsy Drugs Market Revenue (Million) Forecast, by Application 2019 & 2032
- Table 76: South Africa Epilepsy Drugs Market Volume (K Unit) Forecast, by Application 2019 & 2032
- Table 77: Rest of Middle East and Africa Epilepsy Drugs Market Revenue (Million) Forecast, by Application 2019 & 2032
- Table 78: Rest of Middle East and Africa Epilepsy Drugs Market Volume (K Unit) Forecast, by Application 2019 & 2032
- Table 79: Global Epilepsy Drugs Market Revenue Million Forecast, by Drugs 2019 & 2032
- Table 80: Global Epilepsy Drugs Market Volume K Unit Forecast, by Drugs 2019 & 2032
- Table 81: Global Epilepsy Drugs Market Revenue Million Forecast, by Distribution Channel 2019 & 2032
- Table 82: Global Epilepsy Drugs Market Volume K Unit Forecast, by Distribution Channel 2019 & 2032
- Table 83: Global Epilepsy Drugs Market Revenue Million Forecast, by Country 2019 & 2032
- Table 84: Global Epilepsy Drugs Market Volume K Unit Forecast, by Country 2019 & 2032
- Table 85: Brazil Epilepsy Drugs Market Revenue (Million) Forecast, by Application 2019 & 2032
- Table 86: Brazil Epilepsy Drugs Market Volume (K Unit) Forecast, by Application 2019 & 2032
- Table 87: Argentina Epilepsy Drugs Market Revenue (Million) Forecast, by Application 2019 & 2032
- Table 88: Argentina Epilepsy Drugs Market Volume (K Unit) Forecast, by Application 2019 & 2032
- Table 89: Rest of South America Epilepsy Drugs Market Revenue (Million) Forecast, by Application 2019 & 2032
- Table 90: Rest of South America Epilepsy Drugs Market Volume (K Unit) Forecast, by Application 2019 & 2032
Frequently Asked Questions
1. What is the projected Compound Annual Growth Rate (CAGR) of the Epilepsy Drugs Market?
The projected CAGR is approximately 3.50%.
2. Which companies are prominent players in the Epilepsy Drugs Market?
Key companies in the market include Pfizer Inc, Eisai Co Ltd , Sanofi SA, Sunovion Pharmaceuticals Inc, H Lundbeck A/S, Novartis AG, Alkem Labs, Takeda Pharmaceutical Company Limited, Abbott Laboratories, UCB S A, Johnson & Johnson, GW Pharmaceuticals plc, Sun Pharmaceutical Industries Limited, GlaxoSmithKline PLC.
3. What are the main segments of the Epilepsy Drugs Market?
The market segments include Drugs, Distribution Channel.
4. Can you provide details about the market size?
The market size is estimated to be USD XX Million as of 2022.
5. What are some drivers contributing to market growth?
Rise in the New Drug Approvals over the Past Few Years; Increase in the Cases of Epilepsy.
6. What are the notable trends driving market growth?
Second Generation Anti-epileptics is Expected to Hold a Significant Market Share Over the Forecast Period.
7. Are there any restraints impacting market growth?
Side Effects Associated With the Drugs; Recent Patent Expiration of Major Brands.
8. Can you provide examples of recent developments in the market?
March 2022: Lupin received approval from the United States Food and Drug Administration for its abbreviated new Vigabatrin application (ANDA). It is an anti-epileptic drug available as an oral solution USP (500 mg).
9. What pricing options are available for accessing the report?
Pricing options include single-user, multi-user, and enterprise licenses priced at USD 4750, USD 5250, and USD 8750 respectively.
10. Is the market size provided in terms of value or volume?
The market size is provided in terms of value, measured in Million and volume, measured in K Unit.
11. Are there any specific market keywords associated with the report?
Yes, the market keyword associated with the report is "Epilepsy Drugs Market," which aids in identifying and referencing the specific market segment covered.
12. How do I determine which pricing option suits my needs best?
The pricing options vary based on user requirements and access needs. Individual users may opt for single-user licenses, while businesses requiring broader access may choose multi-user or enterprise licenses for cost-effective access to the report.
13. Are there any additional resources or data provided in the Epilepsy Drugs Market report?
While the report offers comprehensive insights, it's advisable to review the specific contents or supplementary materials provided to ascertain if additional resources or data are available.
14. How can I stay updated on further developments or reports in the Epilepsy Drugs Market?
To stay informed about further developments, trends, and reports in the Epilepsy Drugs Market, consider subscribing to industry newsletters, following relevant companies and organizations, or regularly checking reputable industry news sources and publications.
Methodology
Step 1 - Identification of Relevant Samples Size from Population Database


Step 2 - Approaches for Defining Global Market Size (Value, Volume* & Price*)

Note*: In applicable scenarios
Step 3 - Data Sources
Primary Research
- Web Analytics
- Survey Reports
- Research Institute
- Latest Research Reports
- Opinion Leaders
Secondary Research
- Annual Reports
- White Paper
- Latest Press Release
- Industry Association
- Paid Database
- Investor Presentations

Step 4 - Data Triangulation
Involves using different sources of information in order to increase the validity of a study
These sources are likely to be stakeholders in a program - participants, other researchers, program staff, other community members, and so on.
Then we put all data in single framework & apply various statistical tools to find out the dynamic on the market.
During the analysis stage, feedback from the stakeholder groups would be compared to determine areas of agreement as well as areas of divergence


