

Key Insights
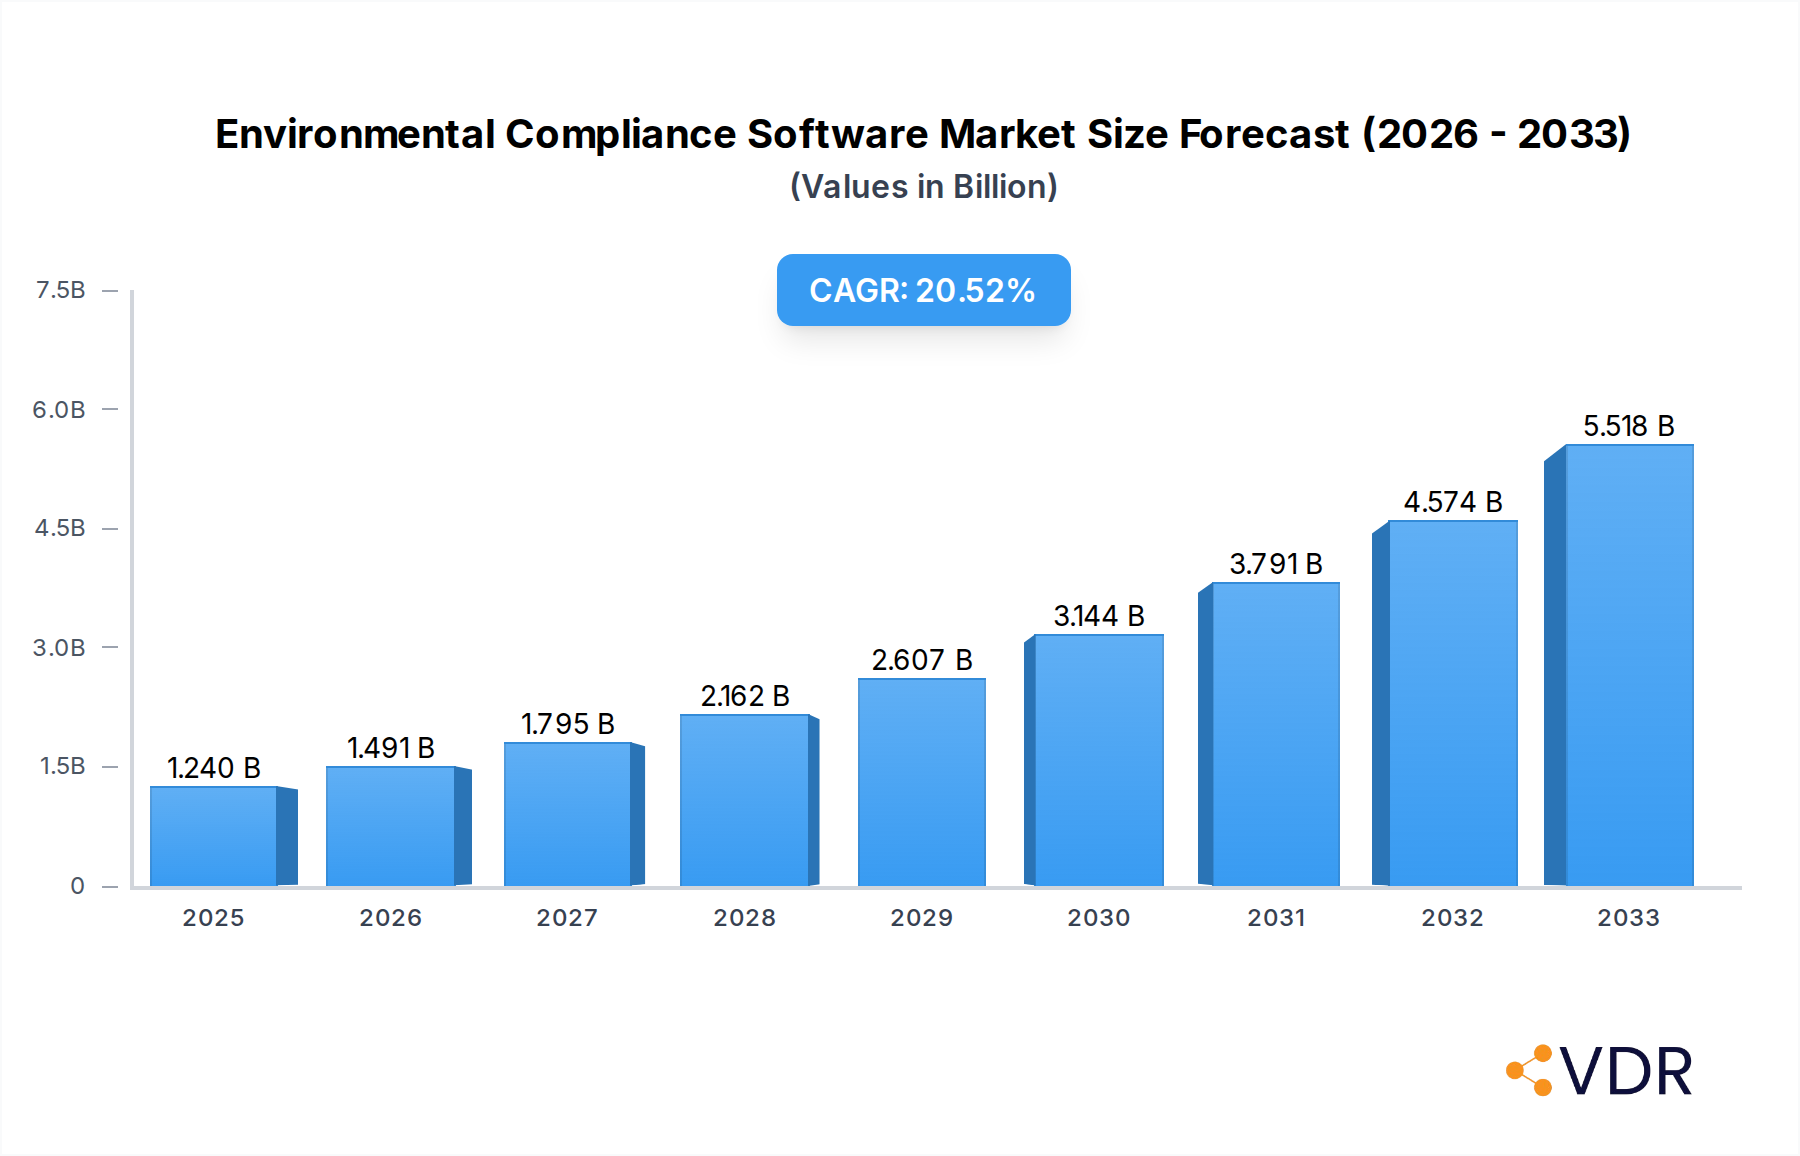
The Environmental Compliance Software market is poised for significant expansion, projected to reach a valuation of $1.24 billion in 2025, driven by a robust Compound Annual Growth Rate (CAGR) of 20.1% through 2033. This impressive growth trajectory is fueled by an increasing global emphasis on environmental stewardship and stringent regulatory landscapes. Organizations worldwide are recognizing the indispensable role of dedicated software solutions in navigating complex environmental laws, managing sustainability initiatives, and mitigating operational risks. The escalating need for efficient data management, streamlined reporting processes, and proactive risk assessment in areas such as emissions tracking, waste management, and chemical handling are key accelerators for market adoption. Furthermore, the growing corporate responsibility movement and the push for Environmental, Social, and Governance (ESG) reporting are creating a fertile ground for the widespread deployment of these advanced software platforms.

Environmental Compliance Software Market Size (In Billion)
The market's dynamism is further underscored by the dual segmentation into cloud-based and on-premises solutions, catering to diverse organizational needs and IT infrastructures. Cloud-based offerings are experiencing particularly strong demand due to their scalability, accessibility, and reduced upfront costs, making them attractive for Small and Medium Enterprises (SMEs) as well as large corporations. Conversely, on-premises solutions continue to hold relevance for organizations with specific data security and control requirements. Key market players like Enviance, Gensuite, Cority, and SAP are innovating and expanding their portfolios to address evolving customer demands. Emerging trends such as the integration of AI and machine learning for predictive analytics and the increasing focus on supply chain sustainability are expected to shape the market landscape, presenting both opportunities and challenges for established and new entrants alike.
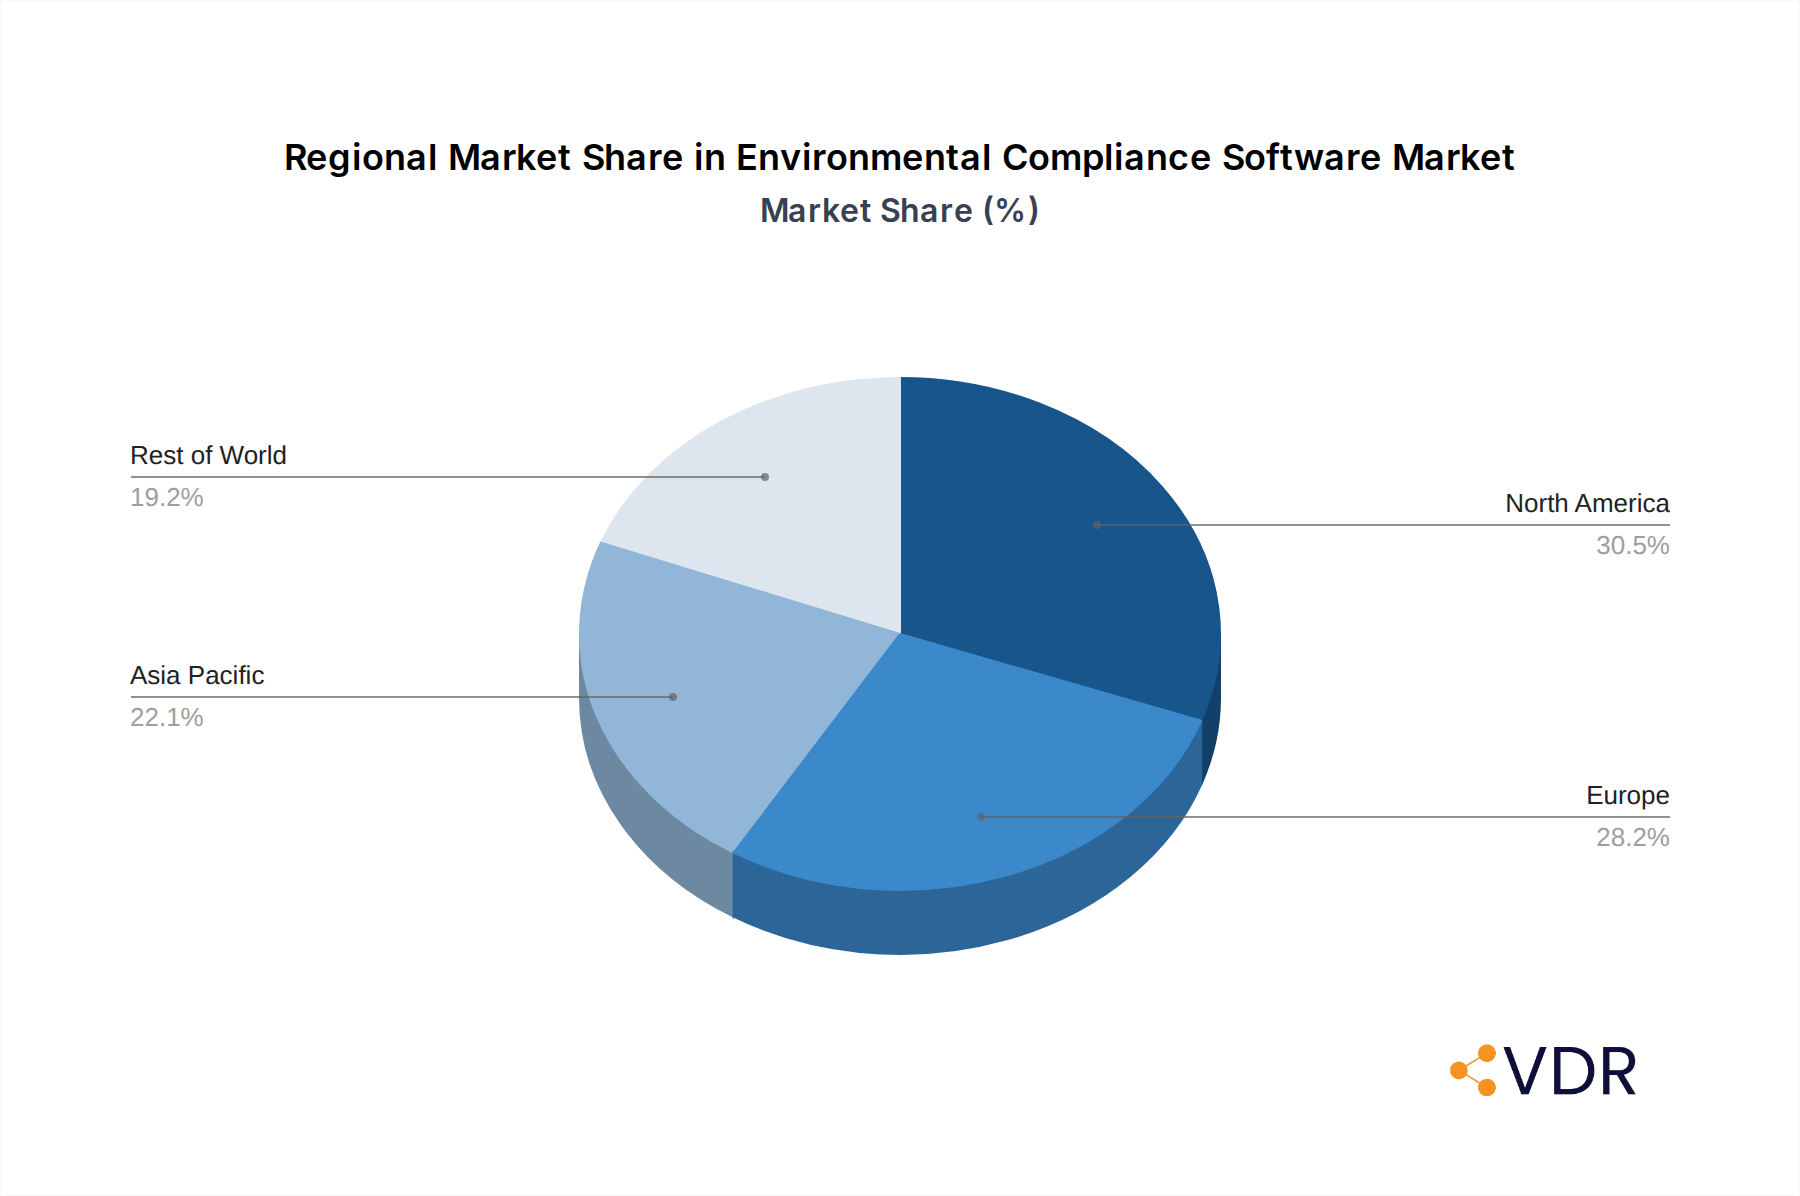
Environmental Compliance Software Company Market Share
Environmental Compliance Software Market Dynamics & Structure
The Environmental Compliance Software market is characterized by a moderate to highly concentrated landscape, with key players like Siemens, SAP, Cority, Gensuite, and VelocityEHS dominating market share. Technological innovation is a primary driver, with continuous advancements in AI, IoT integration, and data analytics enhancing software capabilities for real-time monitoring, predictive analytics, and automated reporting. Regulatory frameworks, such as the EU's REACH, ISO 14001, and EPA regulations in the US, are pivotal in shaping market demand, compelling organizations to adopt robust compliance solutions. Competitive product substitutes are evolving, moving beyond basic reporting tools to integrated Environmental, Social, and Governance (ESG) platforms. End-user demographics are expanding, encompassing manufacturing, energy, chemical, and pharmaceutical sectors, with a growing focus on SMEs adopting cloud-based solutions. Mergers and acquisitions (M&A) are actively shaping the market, with strategic consolidations aiming to expand product portfolios and geographical reach. For instance, the past few years have seen an estimated XX M&A deal volume within the environmental software domain, indicating active consolidation. Innovation barriers include the high cost of R&D and the complexity of adapting to diverse and ever-changing global regulations.
- Market Concentration: Moderate to High, with a few dominant global players and a growing number of specialized vendors.
- Technological Innovation Drivers: AI, IoT, Big Data Analytics, Blockchain for data integrity, Mobile accessibility.
- Regulatory Frameworks: EU REACH, ISO 14001, EPA, OSHA, California Prop 65, global sustainability reporting standards (e.g., GRI, SASB).
- Competitive Product Substitutes: Traditional manual reporting, in-house developed systems, broader ESG management platforms.
- End-User Demographics: Manufacturing, Energy, Chemical, Pharmaceutical, Mining, Construction, Agriculture, Retail, Financial Services.
- M&A Trends: Strategic acquisitions to gain market share, expand product offerings, and enter new geographies. Estimated XX deal volume in the historical period.
Environmental Compliance Software Growth Trends & Insights
The Environmental Compliance Software market is projected for significant growth, with a projected market size of approximately $XX billion by 2025, expanding to an estimated $XX billion by 2033. This robust expansion is driven by an increasing global emphasis on sustainability and stringent environmental regulations. Adoption rates for environmental compliance software are steadily climbing across all enterprise sizes, fueled by the need for enhanced operational efficiency, reduced risk of penalties, and improved corporate social responsibility. The base year of 2025 is anticipated to witness a market penetration rate of XX%, a figure expected to rise to XX% by the end of the forecast period. Technological disruptions, particularly the integration of Artificial Intelligence (AI) and Machine Learning (ML), are revolutionizing how businesses manage environmental data, enabling predictive insights into compliance issues and optimizing resource management. These advancements allow for proactive identification of potential non-compliance, thereby averting significant financial and reputational damage.
Consumer behavior shifts are also playing a crucial role. Stakeholders, including investors, customers, and employees, are increasingly demanding transparency and accountability in environmental practices. This pressure compels organizations to invest in sophisticated compliance solutions that can provide verifiable data and demonstrate commitment to environmental stewardship. The Compound Annual Growth Rate (CAGR) for the environmental compliance software market is estimated at a healthy XX% between 2025 and 2033. The shift towards cloud-based solutions continues to accelerate due to their scalability, accessibility, and cost-effectiveness, particularly for Small and Medium Enterprises (SMEs). On-premises solutions, while still relevant for organizations with specific data security or integration needs, are witnessing a slower adoption pace. The market is also seeing a growing demand for integrated solutions that go beyond basic compliance to encompass broader ESG reporting and sustainability management, reflecting a maturing market that anticipates future regulatory trends and stakeholder expectations. The historical period (2019-2024) saw substantial groundwork laid, with an estimated market size of $XX billion in 2019 reaching approximately $XX billion by 2024, setting a strong foundation for future expansion.
Dominant Regions, Countries, or Segments in Environmental Compliance Software
The Cloud-based segment is emerging as the dominant force within the Environmental Compliance Software market, poised to drive significant growth across the forecast period. This dominance is underpinned by its inherent scalability, flexibility, and cost-effectiveness, making sophisticated compliance solutions accessible to a broader range of businesses, including Small and Medium Enterprises (SMEs) that may have previously found on-premises solutions prohibitive. By 2025, the cloud-based segment is projected to capture an estimated XX% of the total market share, a figure expected to expand to XX% by 2033. North America, particularly the United States, continues to lead in market adoption, driven by stringent environmental regulations, a mature industrial base, and significant investment in technology. The estimated market size for environmental compliance software in North America is $XX billion in 2025, projected to reach $XX billion by 2033, with a CAGR of XX%.
Key drivers in this region include ongoing regulatory enforcement by bodies like the EPA, coupled with a proactive corporate approach to sustainability reporting and risk management. Europe follows closely, with stringent directives like REACH and the EU Green Deal acting as powerful catalysts. Germany, the UK, and France are at the forefront of adoption in the region, collectively contributing an estimated $XX billion to the market in 2025. Asia Pacific, particularly China and India, presents a rapidly growing market. While currently having a smaller market share, its high growth potential, driven by increasing industrialization and a growing awareness of environmental issues, is noteworthy. The region's market is estimated at $XX billion in 2025, with a projected CAGR of XX%. The increasing adoption of cloud infrastructure in these developing economies further bolsters the growth of cloud-based compliance solutions.
- Dominant Segment (Type): Cloud-based solutions, driven by accessibility, scalability, and cost-effectiveness.
- Projected Market Share: XX% (2025) to XX% (2033).
- Key Drivers: Reduced upfront investment, ease of implementation, automatic updates, remote accessibility.
- Dominant Region: North America, with the United States leading adoption.
- Estimated Market Size (2025): $XX billion.
- Growth Potential: Driven by strong regulatory frameworks and corporate ESG focus.
- Leading Country in North America: United States, with robust EPA enforcement and corporate sustainability initiatives.
- Emerging Region: Asia Pacific, showcasing rapid growth due to industrialization and increasing environmental awareness.
- Projected CAGR (2025-2033): XX%.
Environmental Compliance Software Product Landscape
The Environmental Compliance Software product landscape is defined by continuous innovation focused on enhancing data accuracy, automating reporting, and providing actionable insights. Leading solutions now integrate advanced analytics, IoT sensor data for real-time monitoring, and AI-driven predictive capabilities to anticipate potential compliance breaches. Unique selling propositions revolve around comprehensive modules for air, water, waste management, chemical tracking, and permit management, all accessible through intuitive, user-friendly interfaces. Technological advancements include the deployment of mobile applications for field data collection, blockchain for secure and immutable record-keeping, and sophisticated dashboarding for clear visualization of compliance status. Performance metrics are increasingly measured by reduction in compliance costs, faster reporting cycles, and demonstrable improvements in environmental performance, with software enabling an average reduction of XX% in reporting time.
Key Drivers, Barriers & Challenges in Environmental Compliance Software
The Environmental Compliance Software market is propelled by a confluence of critical drivers, predominantly the increasing stringency of global environmental regulations and a heightened societal demand for corporate sustainability and transparency. Organizations are compelled to invest in robust software to mitigate risks of hefty fines and reputational damage. Technological advancements, particularly in AI and IoT, enable more efficient data collection and analysis, further fueling adoption. The growing emphasis on ESG reporting by investors and consumers also acts as a significant growth accelerator.
However, the market faces several barriers and challenges. The initial cost of implementing sophisticated compliance software can be substantial, particularly for SMEs, creating a barrier to entry. Navigating the complex and often country-specific regulatory landscape requires continuous software updates and expertise, posing a significant challenge. Supply chain disruptions, impacting the availability of necessary hardware for data collection (e.g., sensors), can also slow down implementation. Furthermore, the competitive pressure from established players and the emergence of new niche providers necessitates constant innovation and differentiation.
Emerging Opportunities in Environmental Compliance Software
Emerging opportunities within the Environmental Compliance Software market lie in the expansion of integrated Environmental, Social, and Governance (ESG) platforms. As companies move beyond basic compliance, there's a growing demand for holistic solutions that manage sustainability initiatives, carbon footprint tracking, and supply chain ethics. Untapped markets in developing economies, where environmental regulations are evolving, present significant growth potential for scalable and affordable compliance solutions. Innovative applications leveraging AI for predictive compliance and automated remediation strategies are also gaining traction. Furthermore, the increasing focus on circular economy principles is creating demand for software that can manage waste reduction, resource efficiency, and material traceability.
Growth Accelerators in the Environmental Compliance Software Industry
The Environmental Compliance Software industry is experiencing significant growth acceleration driven by several key factors. Technological breakthroughs, such as the pervasive integration of Artificial Intelligence (AI) for predictive analytics and automated compliance workflows, are revolutionizing efficiency. Strategic partnerships between software providers and environmental consultancies are expanding market reach and offering integrated service packages. Market expansion strategies, including penetration into underserved SMEs and emerging economies, are creating new revenue streams. The increasing demand for robust ESG reporting capabilities, driven by investor pressure and consumer awareness, is a major catalyst, pushing companies to adopt comprehensive compliance and sustainability management platforms.
Key Players Shaping the Environmental Compliance Software Market
- Enviance
- Gensuite
- ERA
- Cority
- Siemens
- SAP
- Dakota
- Intelex
- VelocityEHS
- Ecesis
Notable Milestones in Environmental Compliance Software Sector
- 2019: Siemens launches its comprehensive Sustainable Cities platform, integrating environmental compliance modules.
- 2020: Cority acquires Environmental Risk Management Inc. (ERM), significantly expanding its EHS software portfolio.
- 2021: VelocityEHS introduces AI-powered capabilities for proactive risk identification in its compliance software.
- 2022: SAP launches enhanced sustainability reporting solutions, building on its core ERP offerings.
- 2023: Gensuite announces strategic partnerships with leading IoT providers to enhance real-time data integration.
- 2024 (H1): Intelex expands its cloud infrastructure to accommodate growing global demand for its EHS solutions.
In-Depth Environmental Compliance Software Market Outlook
The Environmental Compliance Software market is poised for sustained and robust growth. Key growth accelerators include the relentless evolution of global environmental regulations, compelling organizations of all sizes to invest in compliant technologies. The increasing demand for integrated ESG management platforms, driven by investor and consumer scrutiny, presents a significant expansion opportunity beyond traditional compliance. Technological advancements, particularly in AI, machine learning, and IoT, will continue to enhance software capabilities, offering predictive insights and automated workflows. Strategic collaborations and market expansion into emerging economies will further fuel this growth trajectory, solidifying the essential role of environmental compliance software in a sustainable business future.
Environmental Compliance Software Segmentation
-
1. Application
- 1.1. Small and Medium Enterprises (SMEs)
- 1.2. Large Enterprises
-
2. Type
- 2.1. Cloud-based
- 2.2. On-premises
Environmental Compliance Software Segmentation By Geography
-
1. North America
- 1.1. United States
- 1.2. Canada
- 1.3. Mexico
-
2. South America
- 2.1. Brazil
- 2.2. Argentina
- 2.3. Rest of South America
-
3. Europe
- 3.1. United Kingdom
- 3.2. Germany
- 3.3. France
- 3.4. Italy
- 3.5. Spain
- 3.6. Russia
- 3.7. Benelux
- 3.8. Nordics
- 3.9. Rest of Europe
-
4. Middle East & Africa
- 4.1. Turkey
- 4.2. Israel
- 4.3. GCC
- 4.4. North Africa
- 4.5. South Africa
- 4.6. Rest of Middle East & Africa
-
5. Asia Pacific
- 5.1. China
- 5.2. India
- 5.3. Japan
- 5.4. South Korea
- 5.5. ASEAN
- 5.6. Oceania
- 5.7. Rest of Asia Pacific
Environmental Compliance Software Regional Market Share
Geographic Coverage of Environmental Compliance Software
Environmental Compliance Software REPORT HIGHLIGHTS
| Aspects | Details |
|---|---|
| Study Period | 2020-2034 |
| Base Year | 2025 |
| Estimated Year | 2026 |
| Forecast Period | 2026-2034 |
| Historical Period | 2020-2025 |
| Growth Rate | CAGR of 20.1% from 2020-2034 |
| Segmentation |
|
Table of Contents
- 1. Introduction
- 1.1. Research Scope
- 1.2. Market Segmentation
- 1.3. Research Methodology
- 1.4. Definitions and Assumptions
- 2. Executive Summary
- 2.1. Introduction
- 3. Market Dynamics
- 3.1. Introduction
- 3.2. Market Drivers
- 3.3. Market Restrains
- 3.4. Market Trends
- 4. Market Factor Analysis
- 4.1. Porters Five Forces
- 4.2. Supply/Value Chain
- 4.3. PESTEL analysis
- 4.4. Market Entropy
- 4.5. Patent/Trademark Analysis
- 5. Global Environmental Compliance Software Analysis, Insights and Forecast, 2020-2032
- 5.1. Market Analysis, Insights and Forecast - by Application
- 5.1.1. Small and Medium Enterprises (SMEs)
- 5.1.2. Large Enterprises
- 5.2. Market Analysis, Insights and Forecast - by Type
- 5.2.1. Cloud-based
- 5.2.2. On-premises
- 5.3. Market Analysis, Insights and Forecast - by Region
- 5.3.1. North America
- 5.3.2. South America
- 5.3.3. Europe
- 5.3.4. Middle East & Africa
- 5.3.5. Asia Pacific
- 5.1. Market Analysis, Insights and Forecast - by Application
- 6. North America Environmental Compliance Software Analysis, Insights and Forecast, 2020-2032
- 6.1. Market Analysis, Insights and Forecast - by Application
- 6.1.1. Small and Medium Enterprises (SMEs)
- 6.1.2. Large Enterprises
- 6.2. Market Analysis, Insights and Forecast - by Type
- 6.2.1. Cloud-based
- 6.2.2. On-premises
- 6.1. Market Analysis, Insights and Forecast - by Application
- 7. South America Environmental Compliance Software Analysis, Insights and Forecast, 2020-2032
- 7.1. Market Analysis, Insights and Forecast - by Application
- 7.1.1. Small and Medium Enterprises (SMEs)
- 7.1.2. Large Enterprises
- 7.2. Market Analysis, Insights and Forecast - by Type
- 7.2.1. Cloud-based
- 7.2.2. On-premises
- 7.1. Market Analysis, Insights and Forecast - by Application
- 8. Europe Environmental Compliance Software Analysis, Insights and Forecast, 2020-2032
- 8.1. Market Analysis, Insights and Forecast - by Application
- 8.1.1. Small and Medium Enterprises (SMEs)
- 8.1.2. Large Enterprises
- 8.2. Market Analysis, Insights and Forecast - by Type
- 8.2.1. Cloud-based
- 8.2.2. On-premises
- 8.1. Market Analysis, Insights and Forecast - by Application
- 9. Middle East & Africa Environmental Compliance Software Analysis, Insights and Forecast, 2020-2032
- 9.1. Market Analysis, Insights and Forecast - by Application
- 9.1.1. Small and Medium Enterprises (SMEs)
- 9.1.2. Large Enterprises
- 9.2. Market Analysis, Insights and Forecast - by Type
- 9.2.1. Cloud-based
- 9.2.2. On-premises
- 9.1. Market Analysis, Insights and Forecast - by Application
- 10. Asia Pacific Environmental Compliance Software Analysis, Insights and Forecast, 2020-2032
- 10.1. Market Analysis, Insights and Forecast - by Application
- 10.1.1. Small and Medium Enterprises (SMEs)
- 10.1.2. Large Enterprises
- 10.2. Market Analysis, Insights and Forecast - by Type
- 10.2.1. Cloud-based
- 10.2.2. On-premises
- 10.1. Market Analysis, Insights and Forecast - by Application
- 11. Competitive Analysis
- 11.1. Global Market Share Analysis 2025
- 11.2. Company Profiles
- 11.2.1 Enviance
- 11.2.1.1. Overview
- 11.2.1.2. Products
- 11.2.1.3. SWOT Analysis
- 11.2.1.4. Recent Developments
- 11.2.1.5. Financials (Based on Availability)
- 11.2.2 Gensuite
- 11.2.2.1. Overview
- 11.2.2.2. Products
- 11.2.2.3. SWOT Analysis
- 11.2.2.4. Recent Developments
- 11.2.2.5. Financials (Based on Availability)
- 11.2.3 ERA
- 11.2.3.1. Overview
- 11.2.3.2. Products
- 11.2.3.3. SWOT Analysis
- 11.2.3.4. Recent Developments
- 11.2.3.5. Financials (Based on Availability)
- 11.2.4 Cority
- 11.2.4.1. Overview
- 11.2.4.2. Products
- 11.2.4.3. SWOT Analysis
- 11.2.4.4. Recent Developments
- 11.2.4.5. Financials (Based on Availability)
- 11.2.5 Siemens
- 11.2.5.1. Overview
- 11.2.5.2. Products
- 11.2.5.3. SWOT Analysis
- 11.2.5.4. Recent Developments
- 11.2.5.5. Financials (Based on Availability)
- 11.2.6 SAP
- 11.2.6.1. Overview
- 11.2.6.2. Products
- 11.2.6.3. SWOT Analysis
- 11.2.6.4. Recent Developments
- 11.2.6.5. Financials (Based on Availability)
- 11.2.7 Dakota
- 11.2.7.1. Overview
- 11.2.7.2. Products
- 11.2.7.3. SWOT Analysis
- 11.2.7.4. Recent Developments
- 11.2.7.5. Financials (Based on Availability)
- 11.2.8 Intelex
- 11.2.8.1. Overview
- 11.2.8.2. Products
- 11.2.8.3. SWOT Analysis
- 11.2.8.4. Recent Developments
- 11.2.8.5. Financials (Based on Availability)
- 11.2.9 VelocityEHS
- 11.2.9.1. Overview
- 11.2.9.2. Products
- 11.2.9.3. SWOT Analysis
- 11.2.9.4. Recent Developments
- 11.2.9.5. Financials (Based on Availability)
- 11.2.10 Ecesis
- 11.2.10.1. Overview
- 11.2.10.2. Products
- 11.2.10.3. SWOT Analysis
- 11.2.10.4. Recent Developments
- 11.2.10.5. Financials (Based on Availability)
- 11.2.1 Enviance
List of Figures
- Figure 1: Global Environmental Compliance Software Revenue Breakdown (undefined, %) by Region 2025 & 2033
- Figure 2: North America Environmental Compliance Software Revenue (undefined), by Application 2025 & 2033
- Figure 3: North America Environmental Compliance Software Revenue Share (%), by Application 2025 & 2033
- Figure 4: North America Environmental Compliance Software Revenue (undefined), by Type 2025 & 2033
- Figure 5: North America Environmental Compliance Software Revenue Share (%), by Type 2025 & 2033
- Figure 6: North America Environmental Compliance Software Revenue (undefined), by Country 2025 & 2033
- Figure 7: North America Environmental Compliance Software Revenue Share (%), by Country 2025 & 2033
- Figure 8: South America Environmental Compliance Software Revenue (undefined), by Application 2025 & 2033
- Figure 9: South America Environmental Compliance Software Revenue Share (%), by Application 2025 & 2033
- Figure 10: South America Environmental Compliance Software Revenue (undefined), by Type 2025 & 2033
- Figure 11: South America Environmental Compliance Software Revenue Share (%), by Type 2025 & 2033
- Figure 12: South America Environmental Compliance Software Revenue (undefined), by Country 2025 & 2033
- Figure 13: South America Environmental Compliance Software Revenue Share (%), by Country 2025 & 2033
- Figure 14: Europe Environmental Compliance Software Revenue (undefined), by Application 2025 & 2033
- Figure 15: Europe Environmental Compliance Software Revenue Share (%), by Application 2025 & 2033
- Figure 16: Europe Environmental Compliance Software Revenue (undefined), by Type 2025 & 2033
- Figure 17: Europe Environmental Compliance Software Revenue Share (%), by Type 2025 & 2033
- Figure 18: Europe Environmental Compliance Software Revenue (undefined), by Country 2025 & 2033
- Figure 19: Europe Environmental Compliance Software Revenue Share (%), by Country 2025 & 2033
- Figure 20: Middle East & Africa Environmental Compliance Software Revenue (undefined), by Application 2025 & 2033
- Figure 21: Middle East & Africa Environmental Compliance Software Revenue Share (%), by Application 2025 & 2033
- Figure 22: Middle East & Africa Environmental Compliance Software Revenue (undefined), by Type 2025 & 2033
- Figure 23: Middle East & Africa Environmental Compliance Software Revenue Share (%), by Type 2025 & 2033
- Figure 24: Middle East & Africa Environmental Compliance Software Revenue (undefined), by Country 2025 & 2033
- Figure 25: Middle East & Africa Environmental Compliance Software Revenue Share (%), by Country 2025 & 2033
- Figure 26: Asia Pacific Environmental Compliance Software Revenue (undefined), by Application 2025 & 2033
- Figure 27: Asia Pacific Environmental Compliance Software Revenue Share (%), by Application 2025 & 2033
- Figure 28: Asia Pacific Environmental Compliance Software Revenue (undefined), by Type 2025 & 2033
- Figure 29: Asia Pacific Environmental Compliance Software Revenue Share (%), by Type 2025 & 2033
- Figure 30: Asia Pacific Environmental Compliance Software Revenue (undefined), by Country 2025 & 2033
- Figure 31: Asia Pacific Environmental Compliance Software Revenue Share (%), by Country 2025 & 2033
List of Tables
- Table 1: Global Environmental Compliance Software Revenue undefined Forecast, by Application 2020 & 2033
- Table 2: Global Environmental Compliance Software Revenue undefined Forecast, by Type 2020 & 2033
- Table 3: Global Environmental Compliance Software Revenue undefined Forecast, by Region 2020 & 2033
- Table 4: Global Environmental Compliance Software Revenue undefined Forecast, by Application 2020 & 2033
- Table 5: Global Environmental Compliance Software Revenue undefined Forecast, by Type 2020 & 2033
- Table 6: Global Environmental Compliance Software Revenue undefined Forecast, by Country 2020 & 2033
- Table 7: United States Environmental Compliance Software Revenue (undefined) Forecast, by Application 2020 & 2033
- Table 8: Canada Environmental Compliance Software Revenue (undefined) Forecast, by Application 2020 & 2033
- Table 9: Mexico Environmental Compliance Software Revenue (undefined) Forecast, by Application 2020 & 2033
- Table 10: Global Environmental Compliance Software Revenue undefined Forecast, by Application 2020 & 2033
- Table 11: Global Environmental Compliance Software Revenue undefined Forecast, by Type 2020 & 2033
- Table 12: Global Environmental Compliance Software Revenue undefined Forecast, by Country 2020 & 2033
- Table 13: Brazil Environmental Compliance Software Revenue (undefined) Forecast, by Application 2020 & 2033
- Table 14: Argentina Environmental Compliance Software Revenue (undefined) Forecast, by Application 2020 & 2033
- Table 15: Rest of South America Environmental Compliance Software Revenue (undefined) Forecast, by Application 2020 & 2033
- Table 16: Global Environmental Compliance Software Revenue undefined Forecast, by Application 2020 & 2033
- Table 17: Global Environmental Compliance Software Revenue undefined Forecast, by Type 2020 & 2033
- Table 18: Global Environmental Compliance Software Revenue undefined Forecast, by Country 2020 & 2033
- Table 19: United Kingdom Environmental Compliance Software Revenue (undefined) Forecast, by Application 2020 & 2033
- Table 20: Germany Environmental Compliance Software Revenue (undefined) Forecast, by Application 2020 & 2033
- Table 21: France Environmental Compliance Software Revenue (undefined) Forecast, by Application 2020 & 2033
- Table 22: Italy Environmental Compliance Software Revenue (undefined) Forecast, by Application 2020 & 2033
- Table 23: Spain Environmental Compliance Software Revenue (undefined) Forecast, by Application 2020 & 2033
- Table 24: Russia Environmental Compliance Software Revenue (undefined) Forecast, by Application 2020 & 2033
- Table 25: Benelux Environmental Compliance Software Revenue (undefined) Forecast, by Application 2020 & 2033
- Table 26: Nordics Environmental Compliance Software Revenue (undefined) Forecast, by Application 2020 & 2033
- Table 27: Rest of Europe Environmental Compliance Software Revenue (undefined) Forecast, by Application 2020 & 2033
- Table 28: Global Environmental Compliance Software Revenue undefined Forecast, by Application 2020 & 2033
- Table 29: Global Environmental Compliance Software Revenue undefined Forecast, by Type 2020 & 2033
- Table 30: Global Environmental Compliance Software Revenue undefined Forecast, by Country 2020 & 2033
- Table 31: Turkey Environmental Compliance Software Revenue (undefined) Forecast, by Application 2020 & 2033
- Table 32: Israel Environmental Compliance Software Revenue (undefined) Forecast, by Application 2020 & 2033
- Table 33: GCC Environmental Compliance Software Revenue (undefined) Forecast, by Application 2020 & 2033
- Table 34: North Africa Environmental Compliance Software Revenue (undefined) Forecast, by Application 2020 & 2033
- Table 35: South Africa Environmental Compliance Software Revenue (undefined) Forecast, by Application 2020 & 2033
- Table 36: Rest of Middle East & Africa Environmental Compliance Software Revenue (undefined) Forecast, by Application 2020 & 2033
- Table 37: Global Environmental Compliance Software Revenue undefined Forecast, by Application 2020 & 2033
- Table 38: Global Environmental Compliance Software Revenue undefined Forecast, by Type 2020 & 2033
- Table 39: Global Environmental Compliance Software Revenue undefined Forecast, by Country 2020 & 2033
- Table 40: China Environmental Compliance Software Revenue (undefined) Forecast, by Application 2020 & 2033
- Table 41: India Environmental Compliance Software Revenue (undefined) Forecast, by Application 2020 & 2033
- Table 42: Japan Environmental Compliance Software Revenue (undefined) Forecast, by Application 2020 & 2033
- Table 43: South Korea Environmental Compliance Software Revenue (undefined) Forecast, by Application 2020 & 2033
- Table 44: ASEAN Environmental Compliance Software Revenue (undefined) Forecast, by Application 2020 & 2033
- Table 45: Oceania Environmental Compliance Software Revenue (undefined) Forecast, by Application 2020 & 2033
- Table 46: Rest of Asia Pacific Environmental Compliance Software Revenue (undefined) Forecast, by Application 2020 & 2033
Frequently Asked Questions
1. What is the projected Compound Annual Growth Rate (CAGR) of the Environmental Compliance Software?
The projected CAGR is approximately 20.1%.
2. Which companies are prominent players in the Environmental Compliance Software?
Key companies in the market include Enviance, Gensuite, ERA, Cority, Siemens, SAP, Dakota, Intelex, VelocityEHS, Ecesis.
3. What are the main segments of the Environmental Compliance Software?
The market segments include Application, Type.
4. Can you provide details about the market size?
The market size is estimated to be USD XXX N/A as of 2022.
5. What are some drivers contributing to market growth?
N/A
6. What are the notable trends driving market growth?
N/A
7. Are there any restraints impacting market growth?
N/A
8. Can you provide examples of recent developments in the market?
N/A
9. What pricing options are available for accessing the report?
Pricing options include single-user, multi-user, and enterprise licenses priced at USD 4250.00, USD 6375.00, and USD 8500.00 respectively.
10. Is the market size provided in terms of value or volume?
The market size is provided in terms of value, measured in N/A.
11. Are there any specific market keywords associated with the report?
Yes, the market keyword associated with the report is "Environmental Compliance Software," which aids in identifying and referencing the specific market segment covered.
12. How do I determine which pricing option suits my needs best?
The pricing options vary based on user requirements and access needs. Individual users may opt for single-user licenses, while businesses requiring broader access may choose multi-user or enterprise licenses for cost-effective access to the report.
13. Are there any additional resources or data provided in the Environmental Compliance Software report?
While the report offers comprehensive insights, it's advisable to review the specific contents or supplementary materials provided to ascertain if additional resources or data are available.
14. How can I stay updated on further developments or reports in the Environmental Compliance Software?
To stay informed about further developments, trends, and reports in the Environmental Compliance Software, consider subscribing to industry newsletters, following relevant companies and organizations, or regularly checking reputable industry news sources and publications.
Methodology
Step 1 - Identification of Relevant Samples Size from Population Database


Step 2 - Approaches for Defining Global Market Size (Value, Volume* & Price*)

Note*: In applicable scenarios
Step 3 - Data Sources
Primary Research
- Web Analytics
- Survey Reports
- Research Institute
- Latest Research Reports
- Opinion Leaders
Secondary Research
- Annual Reports
- White Paper
- Latest Press Release
- Industry Association
- Paid Database
- Investor Presentations

Step 4 - Data Triangulation
Involves using different sources of information in order to increase the validity of a study
These sources are likely to be stakeholders in a program - participants, other researchers, program staff, other community members, and so on.
Then we put all data in single framework & apply various statistical tools to find out the dynamic on the market.
During the analysis stage, feedback from the stakeholder groups would be compared to determine areas of agreement as well as areas of divergence