
Key Insights
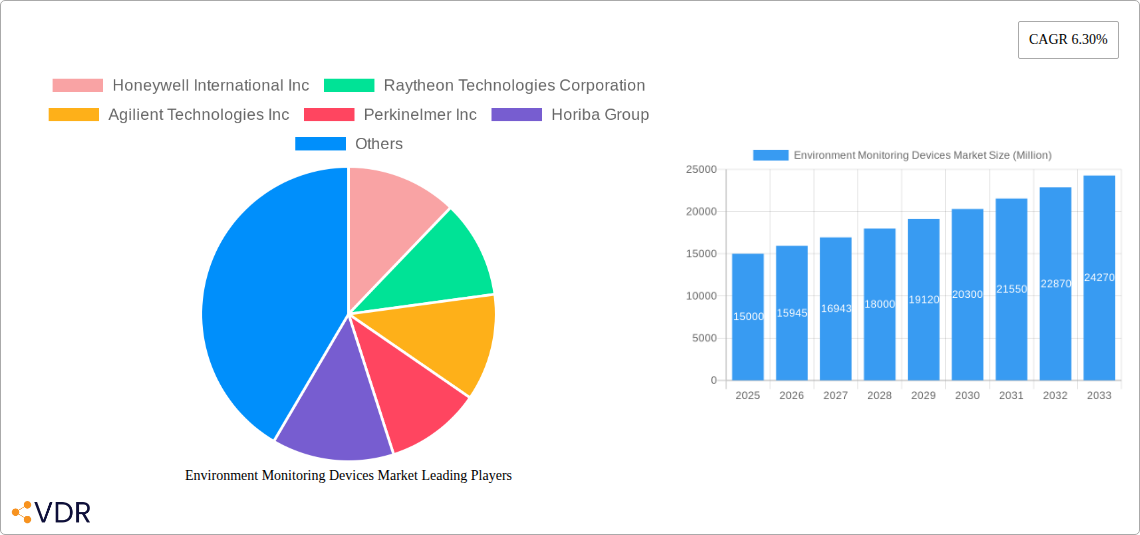
The global Environment Monitoring Devices market is experiencing robust growth, projected to reach a substantial size by 2033. A Compound Annual Growth Rate (CAGR) of 6.30% from 2025 to 2033 signifies a significant expansion driven by several key factors. Increasing environmental concerns, stringent government regulations aimed at curbing pollution, and a growing awareness of environmental sustainability are major catalysts. The rising adoption of smart cities and the Internet of Things (IoT) further fuels market growth, enabling real-time monitoring and data analysis for effective pollution control. Technological advancements in sensor technology, leading to smaller, more accurate, and cost-effective devices, are also significant contributors. Specific application segments, such as air and water pollution monitoring, are experiencing particularly rapid growth due to their immediate relevance to public health and safety. While challenges remain, including high initial investment costs for sophisticated monitoring systems and the need for skilled personnel for data interpretation and analysis, the overall market outlook remains positive.
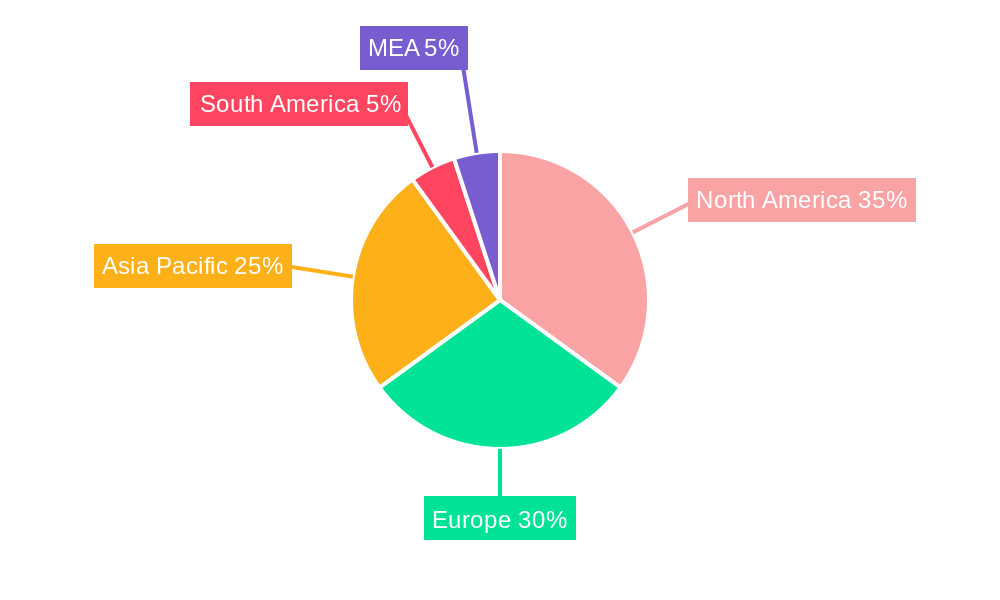
The market segmentation reveals significant opportunities across various product types and applications. Sensors, given their fundamental role in data acquisition, represent a substantial portion of the market. Within applications, air pollution monitoring consistently holds a significant share due to its direct impact on public health. However, water and soil pollution monitoring are witnessing accelerated growth, driven by increasing concerns about water scarcity and land degradation. Geographical distribution shows a strong presence in North America and Europe, fueled by advanced technological infrastructure and stringent environmental regulations. However, the Asia-Pacific region exhibits the highest growth potential, driven by rapid urbanization, industrialization, and a growing emphasis on environmental protection. Key players in this market, including Honeywell, Raytheon, Agilent, and others, are actively investing in research and development to enhance the capabilities and affordability of their products, furthering the market's expansion.
Environment Monitoring Devices Market: A Comprehensive Report (2019-2033)
This comprehensive report provides an in-depth analysis of the Environment Monitoring Devices Market, encompassing its dynamics, growth trends, regional segmentation, product landscape, key players, and future outlook. The market, valued at xx Million units in 2025, is poised for significant expansion, driven by stringent environmental regulations and increasing awareness of pollution's impact. This report covers the parent market of Environmental Monitoring and the child market of Environment Monitoring Devices, offering a granular view of this rapidly evolving sector. The study period spans 2019-2033, with 2025 serving as the base and estimated year.
Environment Monitoring Devices Market Dynamics & Structure
The Environment Monitoring Devices market is characterized by a moderately fragmented landscape, with key players like Honeywell International Inc, Raytheon Technologies Corporation, Agilent Technologies Inc, PerkinElmer Inc, Horiba Group, 3M, Thermo Fisher Scientific Inc, Spectris PLC, Emerson Electric Co, Siemens AG, Danaher Corporation, Sensirion Holding AG, and Shimadzu Corporation competing for market share. Market concentration is expected to increase slightly by 2033 due to mergers and acquisitions (M&A) activity. Technological innovation, particularly in sensor technology and data analytics, is a key driver.
- Market Concentration: Moderately fragmented, with top 5 players holding approximately xx% market share in 2025. This is predicted to increase to xx% by 2033.
- Technological Innovation: Miniaturization, IoT integration, AI-powered data analysis, and advancements in sensor accuracy are driving growth.
- Regulatory Frameworks: Stringent environmental regulations across the globe, particularly in developed nations, are mandating the adoption of monitoring devices.
- Competitive Product Substitutes: Limited, with the primary substitute being manual monitoring methods which are less efficient and accurate.
- End-User Demographics: Primarily government agencies, industrial facilities, research institutions, and environmental consulting firms.
- M&A Trends: A moderate level of M&A activity is observed, primarily focusing on acquiring specialized technology and expanding geographical reach. An estimated xx M&A deals were completed between 2019 and 2024.
Environment Monitoring Devices Market Growth Trends & Insights
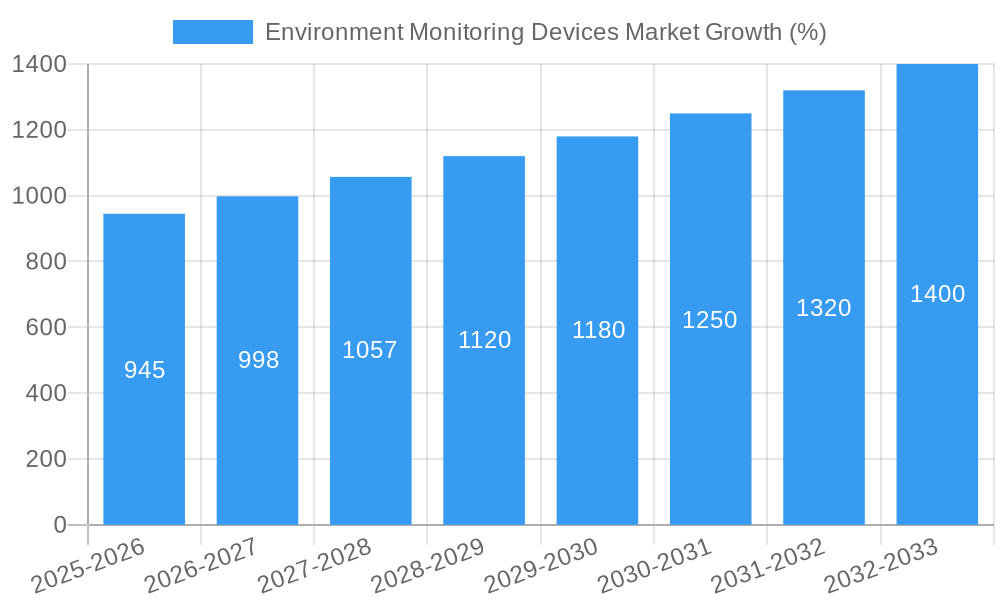
The Environment Monitoring Devices market is experiencing robust growth, with a CAGR of xx% projected from 2025 to 2033. This growth is fueled by rising environmental concerns, increasing industrialization, and the need for accurate and real-time pollution data. Market penetration remains relatively low in emerging economies, presenting significant opportunities for expansion. Technological advancements are driving adoption rates, particularly the integration of IoT and AI capabilities that enable remote monitoring and predictive analytics. Shifting consumer preferences towards environmentally conscious products and services are also indirectly contributing to market growth. By 2033, market penetration is expected to reach xx%.
Dominant Regions, Countries, or Segments in Environment Monitoring Devices Market
North America currently holds the largest market share due to stringent environmental regulations and a high level of industrial activity. Within product types, Sensors hold the largest segment share due to their widespread application across various monitoring applications. Air Pollution Monitoring dominates the application segment, driven by concerns about air quality and associated health impacts.
- North America: High adoption rates due to stringent regulations and robust industrial base. Market share: xx% in 2025.
- Europe: Strong growth potential driven by EU environmental directives. Market share: xx% in 2025.
- Asia-Pacific: Fastest-growing region, fueled by rapid industrialization and urbanization. Market share: xx% in 2025.
- Product Type: Sensors (xx Million units in 2025), Monitors (xx Million units in 2025).
- Application: Air Pollution Monitoring (xx Million units in 2025), Water Pollution Monitoring (xx Million units in 2025), Soil Pollution Monitoring (xx Million units in 2025), Noise Pollution Monitoring (xx Million units in 2025).
Environment Monitoring Devices Market Product Landscape
The market offers a diverse range of products, including sophisticated sensors capable of detecting various pollutants with high accuracy, and advanced monitoring systems with data logging and remote connectivity. Recent innovations focus on miniaturization, improved energy efficiency, and the integration of AI for data analysis and predictive modeling. Key performance metrics include accuracy, sensitivity, range, and data transmission capabilities. Unique selling propositions often include ease of installation, real-time data access, and cloud-based data management.
Key Drivers, Barriers & Challenges in Environment Monitoring Devices Market
Key Drivers:
- Stringent environmental regulations globally.
- Growing awareness of pollution's impact on human health and the environment.
- Increasing industrialization and urbanization leading to higher pollution levels.
- Technological advancements in sensor technology and data analytics.
Key Challenges:
- High initial investment costs for sophisticated monitoring systems.
- Lack of skilled personnel to operate and maintain advanced equipment in certain regions.
- Interoperability issues between different monitoring systems.
- Potential supply chain disruptions impacting the availability of critical components. This resulted in a xx% increase in device prices in 2022.
Emerging Opportunities in Environment Monitoring Devices Market
- Expanding adoption in emerging economies.
- Growth in the Internet of Things (IoT) and smart city initiatives.
- Development of new sensor technologies for detecting emerging pollutants.
- Increasing demand for customized monitoring solutions tailored to specific applications.
- Integration of advanced data analytics and predictive modeling capabilities.
Growth Accelerators in the Environment Monitoring Devices Market Industry
The long-term growth of the environment monitoring devices market is expected to be propelled by ongoing technological innovation, strategic partnerships between technology providers and environmental agencies, and government initiatives to improve environmental monitoring infrastructure. Expansion into untapped markets, particularly in developing countries, will also play a significant role in driving growth.
Key Players Shaping the Environment Monitoring Devices Market Market
- Honeywell International Inc
- Raytheon Technologies Corporation
- Agilent Technologies Inc
- PerkinElmer Inc
- Horiba Group
- 3M
- Thermo Fisher Scientific Inc
- Spectris PLC
- Emerson Electric Co
- Siemens AG
- Danaher Corporation
- Sensirion Holding AG
- Shimadzu Corporation
Notable Milestones in Environment Monitoring Devices Market Sector
- July 2022: NLMK Group implemented a real-time air quality monitoring system at its Lipetsk and Stoilensky facilities, enhancing environmental impact tracking.
- October 2022: Endress+Hauser launched the CA78 and CA79 online TOC analyzers, improving low-TOC value monitoring for regulatory compliance and operational stability.
In-Depth Environment Monitoring Devices Market Market Outlook
The Environment Monitoring Devices market is poised for sustained growth, driven by technological advancements, stringent environmental regulations, and increasing awareness of pollution's harmful effects. Strategic partnerships, market expansion into developing economies, and the adoption of innovative monitoring solutions will further accelerate market expansion, presenting lucrative opportunities for both established players and new entrants. The market is expected to reach xx Million units by 2033, representing significant growth potential for investors and industry stakeholders.
Environment Monitoring Devices Market Segmentation
-
1. Product Type
- 1.1. Sensors
- 1.2. Monitors
-
2. Application
- 2.1. Air Pollution Monitoring
- 2.2. Water Pollution Monitoring
- 2.3. Soil Pollution Monitoring
- 2.4. Noise Pollution Monitoring
Environment Monitoring Devices Market Segmentation By Geography
- 1. North America
- 2. Europe
- 3. Asia Pacific
- 4. Rest of the World
Environment Monitoring Devices Market REPORT HIGHLIGHTS
| Aspects | Details |
|---|---|
| Study Period | 2019-2033 |
| Base Year | 2024 |
| Estimated Year | 2025 |
| Forecast Period | 2025-2033 |
| Historical Period | 2019-2024 |
| Growth Rate | CAGR of 6.30% from 2019-2033 |
| Segmentation |
|
Table of Contents
- 1. Introduction
- 1.1. Research Scope
- 1.2. Market Segmentation
- 1.3. Research Methodology
- 1.4. Definitions and Assumptions
- 2. Executive Summary
- 2.1. Introduction
- 3. Market Dynamics
- 3.1. Introduction
- 3.2. Market Drivers
- 3.2.1. Development of Environment-friendly Industries; Increased Health Concerns Due to Rising Pollution Levels; Stringent Government Regulations have Spurred Adoption
- 3.3. Market Restrains
- 3.3.1. High Installation and Maintenance Costs
- 3.4. Market Trends
- 3.4.1. Air Pollution Monitoring is Expected to Hold Significant Market Share
- 4. Market Factor Analysis
- 4.1. Porters Five Forces
- 4.2. Supply/Value Chain
- 4.3. PESTEL analysis
- 4.4. Market Entropy
- 4.5. Patent/Trademark Analysis
- 5. Global Environment Monitoring Devices Market Analysis, Insights and Forecast, 2019-2031
- 5.1. Market Analysis, Insights and Forecast - by Product Type
- 5.1.1. Sensors
- 5.1.2. Monitors
- 5.2. Market Analysis, Insights and Forecast - by Application
- 5.2.1. Air Pollution Monitoring
- 5.2.2. Water Pollution Monitoring
- 5.2.3. Soil Pollution Monitoring
- 5.2.4. Noise Pollution Monitoring
- 5.3. Market Analysis, Insights and Forecast - by Region
- 5.3.1. North America
- 5.3.2. Europe
- 5.3.3. Asia Pacific
- 5.3.4. Rest of the World
- 5.1. Market Analysis, Insights and Forecast - by Product Type
- 6. North America Environment Monitoring Devices Market Analysis, Insights and Forecast, 2019-2031
- 6.1. Market Analysis, Insights and Forecast - by Product Type
- 6.1.1. Sensors
- 6.1.2. Monitors
- 6.2. Market Analysis, Insights and Forecast - by Application
- 6.2.1. Air Pollution Monitoring
- 6.2.2. Water Pollution Monitoring
- 6.2.3. Soil Pollution Monitoring
- 6.2.4. Noise Pollution Monitoring
- 6.1. Market Analysis, Insights and Forecast - by Product Type
- 7. Europe Environment Monitoring Devices Market Analysis, Insights and Forecast, 2019-2031
- 7.1. Market Analysis, Insights and Forecast - by Product Type
- 7.1.1. Sensors
- 7.1.2. Monitors
- 7.2. Market Analysis, Insights and Forecast - by Application
- 7.2.1. Air Pollution Monitoring
- 7.2.2. Water Pollution Monitoring
- 7.2.3. Soil Pollution Monitoring
- 7.2.4. Noise Pollution Monitoring
- 7.1. Market Analysis, Insights and Forecast - by Product Type
- 8. Asia Pacific Environment Monitoring Devices Market Analysis, Insights and Forecast, 2019-2031
- 8.1. Market Analysis, Insights and Forecast - by Product Type
- 8.1.1. Sensors
- 8.1.2. Monitors
- 8.2. Market Analysis, Insights and Forecast - by Application
- 8.2.1. Air Pollution Monitoring
- 8.2.2. Water Pollution Monitoring
- 8.2.3. Soil Pollution Monitoring
- 8.2.4. Noise Pollution Monitoring
- 8.1. Market Analysis, Insights and Forecast - by Product Type
- 9. Rest of the World Environment Monitoring Devices Market Analysis, Insights and Forecast, 2019-2031
- 9.1. Market Analysis, Insights and Forecast - by Product Type
- 9.1.1. Sensors
- 9.1.2. Monitors
- 9.2. Market Analysis, Insights and Forecast - by Application
- 9.2.1. Air Pollution Monitoring
- 9.2.2. Water Pollution Monitoring
- 9.2.3. Soil Pollution Monitoring
- 9.2.4. Noise Pollution Monitoring
- 9.1. Market Analysis, Insights and Forecast - by Product Type
- 10. North America Environment Monitoring Devices Market Analysis, Insights and Forecast, 2019-2031
- 10.1. Market Analysis, Insights and Forecast - By Country/Sub-region
- 10.1.1 United States
- 10.1.2 Canada
- 10.1.3 Mexico
- 11. Europe Environment Monitoring Devices Market Analysis, Insights and Forecast, 2019-2031
- 11.1. Market Analysis, Insights and Forecast - By Country/Sub-region
- 11.1.1 Germany
- 11.1.2 United Kingdom
- 11.1.3 France
- 11.1.4 Spain
- 11.1.5 Italy
- 11.1.6 Spain
- 11.1.7 Belgium
- 11.1.8 Netherland
- 11.1.9 Nordics
- 11.1.10 Rest of Europe
- 12. Asia Pacific Environment Monitoring Devices Market Analysis, Insights and Forecast, 2019-2031
- 12.1. Market Analysis, Insights and Forecast - By Country/Sub-region
- 12.1.1 China
- 12.1.2 Japan
- 12.1.3 India
- 12.1.4 South Korea
- 12.1.5 Southeast Asia
- 12.1.6 Australia
- 12.1.7 Indonesia
- 12.1.8 Phillipes
- 12.1.9 Singapore
- 12.1.10 Thailandc
- 12.1.11 Rest of Asia Pacific
- 13. South America Environment Monitoring Devices Market Analysis, Insights and Forecast, 2019-2031
- 13.1. Market Analysis, Insights and Forecast - By Country/Sub-region
- 13.1.1 Brazil
- 13.1.2 Argentina
- 13.1.3 Peru
- 13.1.4 Chile
- 13.1.5 Colombia
- 13.1.6 Ecuador
- 13.1.7 Venezuela
- 13.1.8 Rest of South America
- 14. North America Environment Monitoring Devices Market Analysis, Insights and Forecast, 2019-2031
- 14.1. Market Analysis, Insights and Forecast - By Country/Sub-region
- 14.1.1 United States
- 14.1.2 Canada
- 14.1.3 Mexico
- 15. MEA Environment Monitoring Devices Market Analysis, Insights and Forecast, 2019-2031
- 15.1. Market Analysis, Insights and Forecast - By Country/Sub-region
- 15.1.1 United Arab Emirates
- 15.1.2 Saudi Arabia
- 15.1.3 South Africa
- 15.1.4 Rest of Middle East and Africa
- 16. Competitive Analysis
- 16.1. Global Market Share Analysis 2024
- 16.2. Company Profiles
- 16.2.1 Honeywell International Inc
- 16.2.1.1. Overview
- 16.2.1.2. Products
- 16.2.1.3. SWOT Analysis
- 16.2.1.4. Recent Developments
- 16.2.1.5. Financials (Based on Availability)
- 16.2.2 Raytheon Technologies Corporation
- 16.2.2.1. Overview
- 16.2.2.2. Products
- 16.2.2.3. SWOT Analysis
- 16.2.2.4. Recent Developments
- 16.2.2.5. Financials (Based on Availability)
- 16.2.3 Agilient Technologies Inc
- 16.2.3.1. Overview
- 16.2.3.2. Products
- 16.2.3.3. SWOT Analysis
- 16.2.3.4. Recent Developments
- 16.2.3.5. Financials (Based on Availability)
- 16.2.4 Perkinelmer Inc
- 16.2.4.1. Overview
- 16.2.4.2. Products
- 16.2.4.3. SWOT Analysis
- 16.2.4.4. Recent Developments
- 16.2.4.5. Financials (Based on Availability)
- 16.2.5 Horiba Group
- 16.2.5.1. Overview
- 16.2.5.2. Products
- 16.2.5.3. SWOT Analysis
- 16.2.5.4. Recent Developments
- 16.2.5.5. Financials (Based on Availability)
- 16.2.6 3M
- 16.2.6.1. Overview
- 16.2.6.2. Products
- 16.2.6.3. SWOT Analysis
- 16.2.6.4. Recent Developments
- 16.2.6.5. Financials (Based on Availability)
- 16.2.7 Thermo Fisher Scientific Inc
- 16.2.7.1. Overview
- 16.2.7.2. Products
- 16.2.7.3. SWOT Analysis
- 16.2.7.4. Recent Developments
- 16.2.7.5. Financials (Based on Availability)
- 16.2.8 Spectris PLC
- 16.2.8.1. Overview
- 16.2.8.2. Products
- 16.2.8.3. SWOT Analysis
- 16.2.8.4. Recent Developments
- 16.2.8.5. Financials (Based on Availability)
- 16.2.9 Emerson Electric Co
- 16.2.9.1. Overview
- 16.2.9.2. Products
- 16.2.9.3. SWOT Analysis
- 16.2.9.4. Recent Developments
- 16.2.9.5. Financials (Based on Availability)
- 16.2.10 Siemens AG
- 16.2.10.1. Overview
- 16.2.10.2. Products
- 16.2.10.3. SWOT Analysis
- 16.2.10.4. Recent Developments
- 16.2.10.5. Financials (Based on Availability)
- 16.2.11 Danaher Corporation
- 16.2.11.1. Overview
- 16.2.11.2. Products
- 16.2.11.3. SWOT Analysis
- 16.2.11.4. Recent Developments
- 16.2.11.5. Financials (Based on Availability)
- 16.2.12 Sensirion Holding AG
- 16.2.12.1. Overview
- 16.2.12.2. Products
- 16.2.12.3. SWOT Analysis
- 16.2.12.4. Recent Developments
- 16.2.12.5. Financials (Based on Availability)
- 16.2.13 Shimadzu Corporation
- 16.2.13.1. Overview
- 16.2.13.2. Products
- 16.2.13.3. SWOT Analysis
- 16.2.13.4. Recent Developments
- 16.2.13.5. Financials (Based on Availability)
- 16.2.1 Honeywell International Inc
List of Figures
- Figure 1: Global Environment Monitoring Devices Market Revenue Breakdown (Million, %) by Region 2024 & 2032
- Figure 2: Global Environment Monitoring Devices Market Volume Breakdown (K Unit, %) by Region 2024 & 2032
- Figure 3: North America Environment Monitoring Devices Market Revenue (Million), by Country 2024 & 2032
- Figure 4: North America Environment Monitoring Devices Market Volume (K Unit), by Country 2024 & 2032
- Figure 5: North America Environment Monitoring Devices Market Revenue Share (%), by Country 2024 & 2032
- Figure 6: North America Environment Monitoring Devices Market Volume Share (%), by Country 2024 & 2032
- Figure 7: Europe Environment Monitoring Devices Market Revenue (Million), by Country 2024 & 2032
- Figure 8: Europe Environment Monitoring Devices Market Volume (K Unit), by Country 2024 & 2032
- Figure 9: Europe Environment Monitoring Devices Market Revenue Share (%), by Country 2024 & 2032
- Figure 10: Europe Environment Monitoring Devices Market Volume Share (%), by Country 2024 & 2032
- Figure 11: Asia Pacific Environment Monitoring Devices Market Revenue (Million), by Country 2024 & 2032
- Figure 12: Asia Pacific Environment Monitoring Devices Market Volume (K Unit), by Country 2024 & 2032
- Figure 13: Asia Pacific Environment Monitoring Devices Market Revenue Share (%), by Country 2024 & 2032
- Figure 14: Asia Pacific Environment Monitoring Devices Market Volume Share (%), by Country 2024 & 2032
- Figure 15: South America Environment Monitoring Devices Market Revenue (Million), by Country 2024 & 2032
- Figure 16: South America Environment Monitoring Devices Market Volume (K Unit), by Country 2024 & 2032
- Figure 17: South America Environment Monitoring Devices Market Revenue Share (%), by Country 2024 & 2032
- Figure 18: South America Environment Monitoring Devices Market Volume Share (%), by Country 2024 & 2032
- Figure 19: North America Environment Monitoring Devices Market Revenue (Million), by Country 2024 & 2032
- Figure 20: North America Environment Monitoring Devices Market Volume (K Unit), by Country 2024 & 2032
- Figure 21: North America Environment Monitoring Devices Market Revenue Share (%), by Country 2024 & 2032
- Figure 22: North America Environment Monitoring Devices Market Volume Share (%), by Country 2024 & 2032
- Figure 23: MEA Environment Monitoring Devices Market Revenue (Million), by Country 2024 & 2032
- Figure 24: MEA Environment Monitoring Devices Market Volume (K Unit), by Country 2024 & 2032
- Figure 25: MEA Environment Monitoring Devices Market Revenue Share (%), by Country 2024 & 2032
- Figure 26: MEA Environment Monitoring Devices Market Volume Share (%), by Country 2024 & 2032
- Figure 27: North America Environment Monitoring Devices Market Revenue (Million), by Product Type 2024 & 2032
- Figure 28: North America Environment Monitoring Devices Market Volume (K Unit), by Product Type 2024 & 2032
- Figure 29: North America Environment Monitoring Devices Market Revenue Share (%), by Product Type 2024 & 2032
- Figure 30: North America Environment Monitoring Devices Market Volume Share (%), by Product Type 2024 & 2032
- Figure 31: North America Environment Monitoring Devices Market Revenue (Million), by Application 2024 & 2032
- Figure 32: North America Environment Monitoring Devices Market Volume (K Unit), by Application 2024 & 2032
- Figure 33: North America Environment Monitoring Devices Market Revenue Share (%), by Application 2024 & 2032
- Figure 34: North America Environment Monitoring Devices Market Volume Share (%), by Application 2024 & 2032
- Figure 35: North America Environment Monitoring Devices Market Revenue (Million), by Country 2024 & 2032
- Figure 36: North America Environment Monitoring Devices Market Volume (K Unit), by Country 2024 & 2032
- Figure 37: North America Environment Monitoring Devices Market Revenue Share (%), by Country 2024 & 2032
- Figure 38: North America Environment Monitoring Devices Market Volume Share (%), by Country 2024 & 2032
- Figure 39: Europe Environment Monitoring Devices Market Revenue (Million), by Product Type 2024 & 2032
- Figure 40: Europe Environment Monitoring Devices Market Volume (K Unit), by Product Type 2024 & 2032
- Figure 41: Europe Environment Monitoring Devices Market Revenue Share (%), by Product Type 2024 & 2032
- Figure 42: Europe Environment Monitoring Devices Market Volume Share (%), by Product Type 2024 & 2032
- Figure 43: Europe Environment Monitoring Devices Market Revenue (Million), by Application 2024 & 2032
- Figure 44: Europe Environment Monitoring Devices Market Volume (K Unit), by Application 2024 & 2032
- Figure 45: Europe Environment Monitoring Devices Market Revenue Share (%), by Application 2024 & 2032
- Figure 46: Europe Environment Monitoring Devices Market Volume Share (%), by Application 2024 & 2032
- Figure 47: Europe Environment Monitoring Devices Market Revenue (Million), by Country 2024 & 2032
- Figure 48: Europe Environment Monitoring Devices Market Volume (K Unit), by Country 2024 & 2032
- Figure 49: Europe Environment Monitoring Devices Market Revenue Share (%), by Country 2024 & 2032
- Figure 50: Europe Environment Monitoring Devices Market Volume Share (%), by Country 2024 & 2032
- Figure 51: Asia Pacific Environment Monitoring Devices Market Revenue (Million), by Product Type 2024 & 2032
- Figure 52: Asia Pacific Environment Monitoring Devices Market Volume (K Unit), by Product Type 2024 & 2032
- Figure 53: Asia Pacific Environment Monitoring Devices Market Revenue Share (%), by Product Type 2024 & 2032
- Figure 54: Asia Pacific Environment Monitoring Devices Market Volume Share (%), by Product Type 2024 & 2032
- Figure 55: Asia Pacific Environment Monitoring Devices Market Revenue (Million), by Application 2024 & 2032
- Figure 56: Asia Pacific Environment Monitoring Devices Market Volume (K Unit), by Application 2024 & 2032
- Figure 57: Asia Pacific Environment Monitoring Devices Market Revenue Share (%), by Application 2024 & 2032
- Figure 58: Asia Pacific Environment Monitoring Devices Market Volume Share (%), by Application 2024 & 2032
- Figure 59: Asia Pacific Environment Monitoring Devices Market Revenue (Million), by Country 2024 & 2032
- Figure 60: Asia Pacific Environment Monitoring Devices Market Volume (K Unit), by Country 2024 & 2032
- Figure 61: Asia Pacific Environment Monitoring Devices Market Revenue Share (%), by Country 2024 & 2032
- Figure 62: Asia Pacific Environment Monitoring Devices Market Volume Share (%), by Country 2024 & 2032
- Figure 63: Rest of the World Environment Monitoring Devices Market Revenue (Million), by Product Type 2024 & 2032
- Figure 64: Rest of the World Environment Monitoring Devices Market Volume (K Unit), by Product Type 2024 & 2032
- Figure 65: Rest of the World Environment Monitoring Devices Market Revenue Share (%), by Product Type 2024 & 2032
- Figure 66: Rest of the World Environment Monitoring Devices Market Volume Share (%), by Product Type 2024 & 2032
- Figure 67: Rest of the World Environment Monitoring Devices Market Revenue (Million), by Application 2024 & 2032
- Figure 68: Rest of the World Environment Monitoring Devices Market Volume (K Unit), by Application 2024 & 2032
- Figure 69: Rest of the World Environment Monitoring Devices Market Revenue Share (%), by Application 2024 & 2032
- Figure 70: Rest of the World Environment Monitoring Devices Market Volume Share (%), by Application 2024 & 2032
- Figure 71: Rest of the World Environment Monitoring Devices Market Revenue (Million), by Country 2024 & 2032
- Figure 72: Rest of the World Environment Monitoring Devices Market Volume (K Unit), by Country 2024 & 2032
- Figure 73: Rest of the World Environment Monitoring Devices Market Revenue Share (%), by Country 2024 & 2032
- Figure 74: Rest of the World Environment Monitoring Devices Market Volume Share (%), by Country 2024 & 2032
List of Tables
- Table 1: Global Environment Monitoring Devices Market Revenue Million Forecast, by Region 2019 & 2032
- Table 2: Global Environment Monitoring Devices Market Volume K Unit Forecast, by Region 2019 & 2032
- Table 3: Global Environment Monitoring Devices Market Revenue Million Forecast, by Product Type 2019 & 2032
- Table 4: Global Environment Monitoring Devices Market Volume K Unit Forecast, by Product Type 2019 & 2032
- Table 5: Global Environment Monitoring Devices Market Revenue Million Forecast, by Application 2019 & 2032
- Table 6: Global Environment Monitoring Devices Market Volume K Unit Forecast, by Application 2019 & 2032
- Table 7: Global Environment Monitoring Devices Market Revenue Million Forecast, by Region 2019 & 2032
- Table 8: Global Environment Monitoring Devices Market Volume K Unit Forecast, by Region 2019 & 2032
- Table 9: Global Environment Monitoring Devices Market Revenue Million Forecast, by Country 2019 & 2032
- Table 10: Global Environment Monitoring Devices Market Volume K Unit Forecast, by Country 2019 & 2032
- Table 11: United States Environment Monitoring Devices Market Revenue (Million) Forecast, by Application 2019 & 2032
- Table 12: United States Environment Monitoring Devices Market Volume (K Unit) Forecast, by Application 2019 & 2032
- Table 13: Canada Environment Monitoring Devices Market Revenue (Million) Forecast, by Application 2019 & 2032
- Table 14: Canada Environment Monitoring Devices Market Volume (K Unit) Forecast, by Application 2019 & 2032
- Table 15: Mexico Environment Monitoring Devices Market Revenue (Million) Forecast, by Application 2019 & 2032
- Table 16: Mexico Environment Monitoring Devices Market Volume (K Unit) Forecast, by Application 2019 & 2032
- Table 17: Global Environment Monitoring Devices Market Revenue Million Forecast, by Country 2019 & 2032
- Table 18: Global Environment Monitoring Devices Market Volume K Unit Forecast, by Country 2019 & 2032
- Table 19: Germany Environment Monitoring Devices Market Revenue (Million) Forecast, by Application 2019 & 2032
- Table 20: Germany Environment Monitoring Devices Market Volume (K Unit) Forecast, by Application 2019 & 2032
- Table 21: United Kingdom Environment Monitoring Devices Market Revenue (Million) Forecast, by Application 2019 & 2032
- Table 22: United Kingdom Environment Monitoring Devices Market Volume (K Unit) Forecast, by Application 2019 & 2032
- Table 23: France Environment Monitoring Devices Market Revenue (Million) Forecast, by Application 2019 & 2032
- Table 24: France Environment Monitoring Devices Market Volume (K Unit) Forecast, by Application 2019 & 2032
- Table 25: Spain Environment Monitoring Devices Market Revenue (Million) Forecast, by Application 2019 & 2032
- Table 26: Spain Environment Monitoring Devices Market Volume (K Unit) Forecast, by Application 2019 & 2032
- Table 27: Italy Environment Monitoring Devices Market Revenue (Million) Forecast, by Application 2019 & 2032
- Table 28: Italy Environment Monitoring Devices Market Volume (K Unit) Forecast, by Application 2019 & 2032
- Table 29: Spain Environment Monitoring Devices Market Revenue (Million) Forecast, by Application 2019 & 2032
- Table 30: Spain Environment Monitoring Devices Market Volume (K Unit) Forecast, by Application 2019 & 2032
- Table 31: Belgium Environment Monitoring Devices Market Revenue (Million) Forecast, by Application 2019 & 2032
- Table 32: Belgium Environment Monitoring Devices Market Volume (K Unit) Forecast, by Application 2019 & 2032
- Table 33: Netherland Environment Monitoring Devices Market Revenue (Million) Forecast, by Application 2019 & 2032
- Table 34: Netherland Environment Monitoring Devices Market Volume (K Unit) Forecast, by Application 2019 & 2032
- Table 35: Nordics Environment Monitoring Devices Market Revenue (Million) Forecast, by Application 2019 & 2032
- Table 36: Nordics Environment Monitoring Devices Market Volume (K Unit) Forecast, by Application 2019 & 2032
- Table 37: Rest of Europe Environment Monitoring Devices Market Revenue (Million) Forecast, by Application 2019 & 2032
- Table 38: Rest of Europe Environment Monitoring Devices Market Volume (K Unit) Forecast, by Application 2019 & 2032
- Table 39: Global Environment Monitoring Devices Market Revenue Million Forecast, by Country 2019 & 2032
- Table 40: Global Environment Monitoring Devices Market Volume K Unit Forecast, by Country 2019 & 2032
- Table 41: China Environment Monitoring Devices Market Revenue (Million) Forecast, by Application 2019 & 2032
- Table 42: China Environment Monitoring Devices Market Volume (K Unit) Forecast, by Application 2019 & 2032
- Table 43: Japan Environment Monitoring Devices Market Revenue (Million) Forecast, by Application 2019 & 2032
- Table 44: Japan Environment Monitoring Devices Market Volume (K Unit) Forecast, by Application 2019 & 2032
- Table 45: India Environment Monitoring Devices Market Revenue (Million) Forecast, by Application 2019 & 2032
- Table 46: India Environment Monitoring Devices Market Volume (K Unit) Forecast, by Application 2019 & 2032
- Table 47: South Korea Environment Monitoring Devices Market Revenue (Million) Forecast, by Application 2019 & 2032
- Table 48: South Korea Environment Monitoring Devices Market Volume (K Unit) Forecast, by Application 2019 & 2032
- Table 49: Southeast Asia Environment Monitoring Devices Market Revenue (Million) Forecast, by Application 2019 & 2032
- Table 50: Southeast Asia Environment Monitoring Devices Market Volume (K Unit) Forecast, by Application 2019 & 2032
- Table 51: Australia Environment Monitoring Devices Market Revenue (Million) Forecast, by Application 2019 & 2032
- Table 52: Australia Environment Monitoring Devices Market Volume (K Unit) Forecast, by Application 2019 & 2032
- Table 53: Indonesia Environment Monitoring Devices Market Revenue (Million) Forecast, by Application 2019 & 2032
- Table 54: Indonesia Environment Monitoring Devices Market Volume (K Unit) Forecast, by Application 2019 & 2032
- Table 55: Phillipes Environment Monitoring Devices Market Revenue (Million) Forecast, by Application 2019 & 2032
- Table 56: Phillipes Environment Monitoring Devices Market Volume (K Unit) Forecast, by Application 2019 & 2032
- Table 57: Singapore Environment Monitoring Devices Market Revenue (Million) Forecast, by Application 2019 & 2032
- Table 58: Singapore Environment Monitoring Devices Market Volume (K Unit) Forecast, by Application 2019 & 2032
- Table 59: Thailandc Environment Monitoring Devices Market Revenue (Million) Forecast, by Application 2019 & 2032
- Table 60: Thailandc Environment Monitoring Devices Market Volume (K Unit) Forecast, by Application 2019 & 2032
- Table 61: Rest of Asia Pacific Environment Monitoring Devices Market Revenue (Million) Forecast, by Application 2019 & 2032
- Table 62: Rest of Asia Pacific Environment Monitoring Devices Market Volume (K Unit) Forecast, by Application 2019 & 2032
- Table 63: Global Environment Monitoring Devices Market Revenue Million Forecast, by Country 2019 & 2032
- Table 64: Global Environment Monitoring Devices Market Volume K Unit Forecast, by Country 2019 & 2032
- Table 65: Brazil Environment Monitoring Devices Market Revenue (Million) Forecast, by Application 2019 & 2032
- Table 66: Brazil Environment Monitoring Devices Market Volume (K Unit) Forecast, by Application 2019 & 2032
- Table 67: Argentina Environment Monitoring Devices Market Revenue (Million) Forecast, by Application 2019 & 2032
- Table 68: Argentina Environment Monitoring Devices Market Volume (K Unit) Forecast, by Application 2019 & 2032
- Table 69: Peru Environment Monitoring Devices Market Revenue (Million) Forecast, by Application 2019 & 2032
- Table 70: Peru Environment Monitoring Devices Market Volume (K Unit) Forecast, by Application 2019 & 2032
- Table 71: Chile Environment Monitoring Devices Market Revenue (Million) Forecast, by Application 2019 & 2032
- Table 72: Chile Environment Monitoring Devices Market Volume (K Unit) Forecast, by Application 2019 & 2032
- Table 73: Colombia Environment Monitoring Devices Market Revenue (Million) Forecast, by Application 2019 & 2032
- Table 74: Colombia Environment Monitoring Devices Market Volume (K Unit) Forecast, by Application 2019 & 2032
- Table 75: Ecuador Environment Monitoring Devices Market Revenue (Million) Forecast, by Application 2019 & 2032
- Table 76: Ecuador Environment Monitoring Devices Market Volume (K Unit) Forecast, by Application 2019 & 2032
- Table 77: Venezuela Environment Monitoring Devices Market Revenue (Million) Forecast, by Application 2019 & 2032
- Table 78: Venezuela Environment Monitoring Devices Market Volume (K Unit) Forecast, by Application 2019 & 2032
- Table 79: Rest of South America Environment Monitoring Devices Market Revenue (Million) Forecast, by Application 2019 & 2032
- Table 80: Rest of South America Environment Monitoring Devices Market Volume (K Unit) Forecast, by Application 2019 & 2032
- Table 81: Global Environment Monitoring Devices Market Revenue Million Forecast, by Country 2019 & 2032
- Table 82: Global Environment Monitoring Devices Market Volume K Unit Forecast, by Country 2019 & 2032
- Table 83: United States Environment Monitoring Devices Market Revenue (Million) Forecast, by Application 2019 & 2032
- Table 84: United States Environment Monitoring Devices Market Volume (K Unit) Forecast, by Application 2019 & 2032
- Table 85: Canada Environment Monitoring Devices Market Revenue (Million) Forecast, by Application 2019 & 2032
- Table 86: Canada Environment Monitoring Devices Market Volume (K Unit) Forecast, by Application 2019 & 2032
- Table 87: Mexico Environment Monitoring Devices Market Revenue (Million) Forecast, by Application 2019 & 2032
- Table 88: Mexico Environment Monitoring Devices Market Volume (K Unit) Forecast, by Application 2019 & 2032
- Table 89: Global Environment Monitoring Devices Market Revenue Million Forecast, by Country 2019 & 2032
- Table 90: Global Environment Monitoring Devices Market Volume K Unit Forecast, by Country 2019 & 2032
- Table 91: United Arab Emirates Environment Monitoring Devices Market Revenue (Million) Forecast, by Application 2019 & 2032
- Table 92: United Arab Emirates Environment Monitoring Devices Market Volume (K Unit) Forecast, by Application 2019 & 2032
- Table 93: Saudi Arabia Environment Monitoring Devices Market Revenue (Million) Forecast, by Application 2019 & 2032
- Table 94: Saudi Arabia Environment Monitoring Devices Market Volume (K Unit) Forecast, by Application 2019 & 2032
- Table 95: South Africa Environment Monitoring Devices Market Revenue (Million) Forecast, by Application 2019 & 2032
- Table 96: South Africa Environment Monitoring Devices Market Volume (K Unit) Forecast, by Application 2019 & 2032
- Table 97: Rest of Middle East and Africa Environment Monitoring Devices Market Revenue (Million) Forecast, by Application 2019 & 2032
- Table 98: Rest of Middle East and Africa Environment Monitoring Devices Market Volume (K Unit) Forecast, by Application 2019 & 2032
- Table 99: Global Environment Monitoring Devices Market Revenue Million Forecast, by Product Type 2019 & 2032
- Table 100: Global Environment Monitoring Devices Market Volume K Unit Forecast, by Product Type 2019 & 2032
- Table 101: Global Environment Monitoring Devices Market Revenue Million Forecast, by Application 2019 & 2032
- Table 102: Global Environment Monitoring Devices Market Volume K Unit Forecast, by Application 2019 & 2032
- Table 103: Global Environment Monitoring Devices Market Revenue Million Forecast, by Country 2019 & 2032
- Table 104: Global Environment Monitoring Devices Market Volume K Unit Forecast, by Country 2019 & 2032
- Table 105: Global Environment Monitoring Devices Market Revenue Million Forecast, by Product Type 2019 & 2032
- Table 106: Global Environment Monitoring Devices Market Volume K Unit Forecast, by Product Type 2019 & 2032
- Table 107: Global Environment Monitoring Devices Market Revenue Million Forecast, by Application 2019 & 2032
- Table 108: Global Environment Monitoring Devices Market Volume K Unit Forecast, by Application 2019 & 2032
- Table 109: Global Environment Monitoring Devices Market Revenue Million Forecast, by Country 2019 & 2032
- Table 110: Global Environment Monitoring Devices Market Volume K Unit Forecast, by Country 2019 & 2032
- Table 111: Global Environment Monitoring Devices Market Revenue Million Forecast, by Product Type 2019 & 2032
- Table 112: Global Environment Monitoring Devices Market Volume K Unit Forecast, by Product Type 2019 & 2032
- Table 113: Global Environment Monitoring Devices Market Revenue Million Forecast, by Application 2019 & 2032
- Table 114: Global Environment Monitoring Devices Market Volume K Unit Forecast, by Application 2019 & 2032
- Table 115: Global Environment Monitoring Devices Market Revenue Million Forecast, by Country 2019 & 2032
- Table 116: Global Environment Monitoring Devices Market Volume K Unit Forecast, by Country 2019 & 2032
- Table 117: Global Environment Monitoring Devices Market Revenue Million Forecast, by Product Type 2019 & 2032
- Table 118: Global Environment Monitoring Devices Market Volume K Unit Forecast, by Product Type 2019 & 2032
- Table 119: Global Environment Monitoring Devices Market Revenue Million Forecast, by Application 2019 & 2032
- Table 120: Global Environment Monitoring Devices Market Volume K Unit Forecast, by Application 2019 & 2032
- Table 121: Global Environment Monitoring Devices Market Revenue Million Forecast, by Country 2019 & 2032
- Table 122: Global Environment Monitoring Devices Market Volume K Unit Forecast, by Country 2019 & 2032
Frequently Asked Questions
1. What is the projected Compound Annual Growth Rate (CAGR) of the Environment Monitoring Devices Market?
The projected CAGR is approximately 6.30%.
2. Which companies are prominent players in the Environment Monitoring Devices Market?
Key companies in the market include Honeywell International Inc, Raytheon Technologies Corporation, Agilient Technologies Inc, Perkinelmer Inc, Horiba Group, 3M, Thermo Fisher Scientific Inc, Spectris PLC, Emerson Electric Co, Siemens AG, Danaher Corporation, Sensirion Holding AG, Shimadzu Corporation.
3. What are the main segments of the Environment Monitoring Devices Market?
The market segments include Product Type, Application.
4. Can you provide details about the market size?
The market size is estimated to be USD XX Million as of 2022.
5. What are some drivers contributing to market growth?
Development of Environment-friendly Industries; Increased Health Concerns Due to Rising Pollution Levels; Stringent Government Regulations have Spurred Adoption.
6. What are the notable trends driving market growth?
Air Pollution Monitoring is Expected to Hold Significant Market Share.
7. Are there any restraints impacting market growth?
High Installation and Maintenance Costs.
8. Can you provide examples of recent developments in the market?
October 2022: Endress+Hauser launched new analyzers, CA78 and CA79, to monitor low-TOC values. The CA78 and CA79 online TOC analyzers provide continuous and precise monitoring to ensure stable operations, regulatory compliance, and high-quality products.
9. What pricing options are available for accessing the report?
Pricing options include single-user, multi-user, and enterprise licenses priced at USD 4750, USD 5250, and USD 8750 respectively.
10. Is the market size provided in terms of value or volume?
The market size is provided in terms of value, measured in Million and volume, measured in K Unit.
11. Are there any specific market keywords associated with the report?
Yes, the market keyword associated with the report is "Environment Monitoring Devices Market," which aids in identifying and referencing the specific market segment covered.
12. How do I determine which pricing option suits my needs best?
The pricing options vary based on user requirements and access needs. Individual users may opt for single-user licenses, while businesses requiring broader access may choose multi-user or enterprise licenses for cost-effective access to the report.
13. Are there any additional resources or data provided in the Environment Monitoring Devices Market report?
While the report offers comprehensive insights, it's advisable to review the specific contents or supplementary materials provided to ascertain if additional resources or data are available.
14. How can I stay updated on further developments or reports in the Environment Monitoring Devices Market?
To stay informed about further developments, trends, and reports in the Environment Monitoring Devices Market, consider subscribing to industry newsletters, following relevant companies and organizations, or regularly checking reputable industry news sources and publications.
Methodology
Step 1 - Identification of Relevant Samples Size from Population Database


Step 2 - Approaches for Defining Global Market Size (Value, Volume* & Price*)

Note*: In applicable scenarios
Step 3 - Data Sources
Primary Research
- Web Analytics
- Survey Reports
- Research Institute
- Latest Research Reports
- Opinion Leaders
Secondary Research
- Annual Reports
- White Paper
- Latest Press Release
- Industry Association
- Paid Database
- Investor Presentations

Step 4 - Data Triangulation
Involves using different sources of information in order to increase the validity of a study
These sources are likely to be stakeholders in a program - participants, other researchers, program staff, other community members, and so on.
Then we put all data in single framework & apply various statistical tools to find out the dynamic on the market.
During the analysis stage, feedback from the stakeholder groups would be compared to determine areas of agreement as well as areas of divergence


