

Key Insights
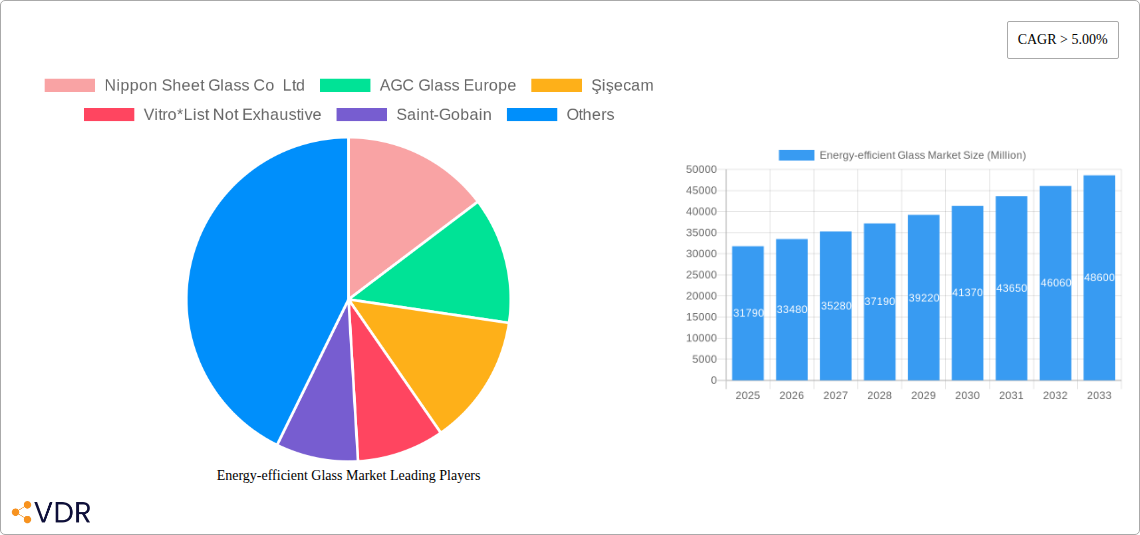
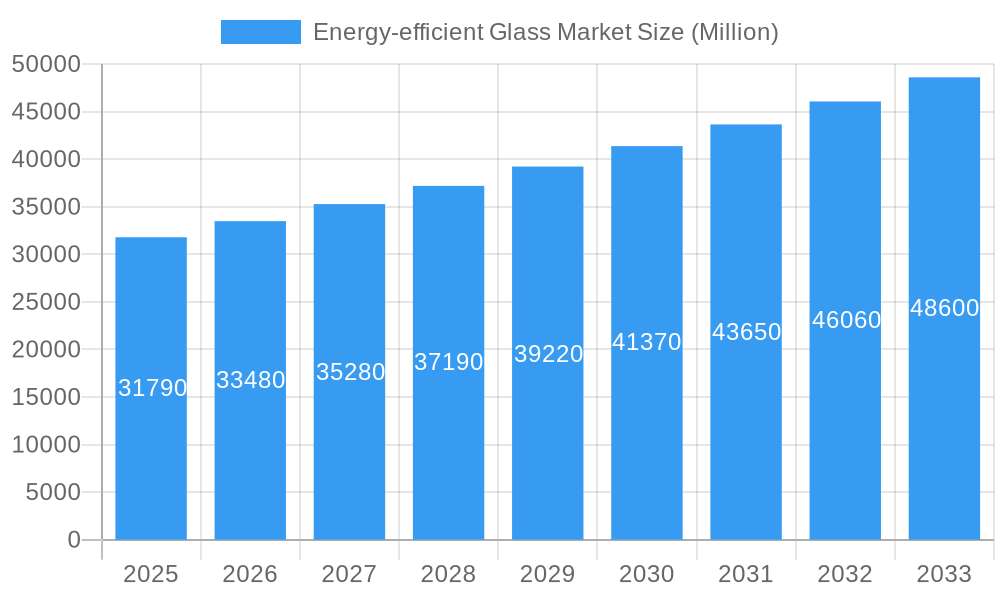
The energy-efficient glass market, valued at $31.79 billion in 2025, is projected to experience robust growth, exhibiting a Compound Annual Growth Rate (CAGR) exceeding 5% from 2025 to 2033. This expansion is driven by several key factors. Increasing concerns about climate change and the escalating costs of energy are fueling demand for energy-efficient buildings and vehicles. Government regulations promoting energy conservation and sustainable building practices are further bolstering market growth. Technological advancements in glass production, such as the development of improved coatings and glazing techniques (hard coatings, soft coatings, single, double, and triple glazing), are enabling the creation of even more efficient products. The building and construction sector remains the dominant end-user industry, followed by the automotive and solar panel sectors. However, increasing industrial applications are expected to contribute significantly to market expansion during the forecast period. Competitive rivalry among major players like Nippon Sheet Glass Co Ltd, AGC Glass Europe, and Saint-Gobain, along with the emergence of innovative technologies, is likely to further shape market dynamics.
Energy-efficient Glass Market Market Size (In Billion)
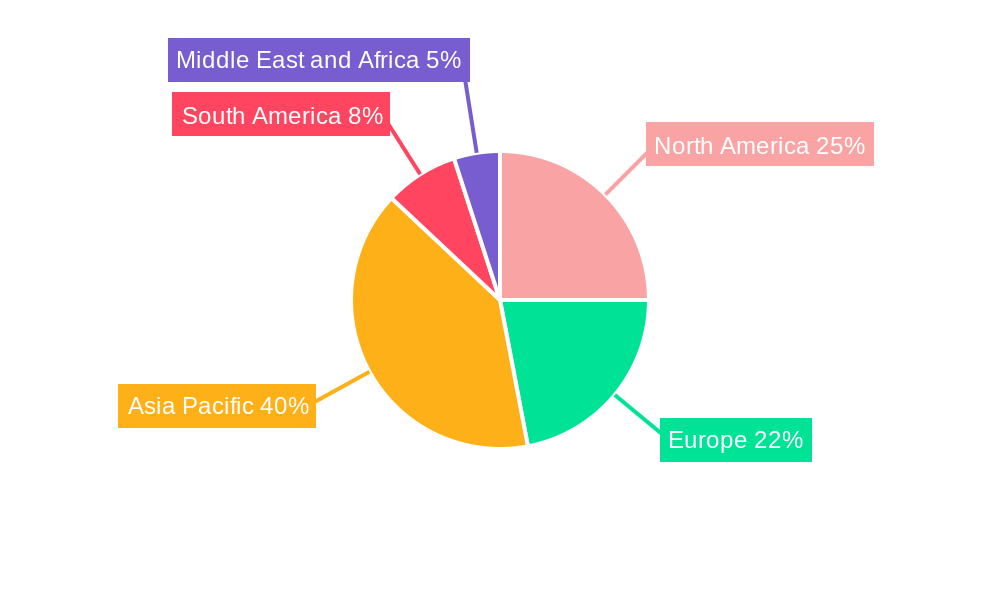
Geographical distribution reveals a strong concentration of market activity in the Asia Pacific region, particularly in China and India, driven by rapid urbanization and infrastructural development. North America and Europe also represent significant markets, with continued growth expected across these regions. While the market faces potential restraints such as high initial investment costs associated with energy-efficient glass installation and fluctuations in raw material prices, the long-term benefits of energy savings and reduced carbon emissions are expected to outweigh these challenges, ensuring sustained market growth throughout the forecast period. The continued focus on sustainability and the implementation of stringent energy efficiency standards will be pivotal in shaping the future trajectory of this market.
Energy-efficient Glass Market Company Market Share
Energy-Efficient Glass Market: A Comprehensive Report (2019-2033)
This comprehensive report provides an in-depth analysis of the energy-efficient glass market, encompassing market dynamics, growth trends, regional dominance, product landscape, key players, and future outlook. The report covers the period from 2019 to 2033, with a focus on the forecast period of 2025-2033 and a base year of 2025. The market is segmented by coating type (hard, soft), glazing type (single, double, triple), and end-user industry (building and construction, automotive, solar panel, other). The total market size is projected to reach xx Million units by 2033.
Energy-efficient Glass Market Market Dynamics & Structure
The energy-efficient glass market is characterized by a moderately consolidated structure with key players holding significant market share. Market concentration is influenced by factors like technological capabilities, economies of scale, and global reach. Major players such as Nippon Sheet Glass Co Ltd, AGC Glass Europe, Şişecam, Vitro, Saint-Gobain, and others compete intensely, driving innovation and shaping market dynamics.
- Market Concentration: The top 5 players collectively hold an estimated xx% market share in 2025.
- Technological Innovation: Continuous advancements in coating technologies (e.g., Low-E coatings, transparent conductive oxides) and glazing techniques are key drivers of growth. Innovation barriers include high R&D costs and the need for specialized manufacturing processes.
- Regulatory Frameworks: Stringent energy efficiency regulations and building codes in various regions are boosting demand for energy-efficient glass. Government incentives and subsidies further stimulate market expansion.
- Competitive Product Substitutes: While energy-efficient glass enjoys strong market positioning, competing alternatives exist, including advanced window films and other insulation technologies. Their performance and pricing can influence market share.
- End-User Demographics: Growth is driven by increasing urbanization, rising disposable incomes, and a growing awareness of sustainable building practices. The shift towards energy-efficient building designs and eco-friendly transportation directly affects demand.
- M&A Trends: The past five years have witnessed xx M&A deals in the energy-efficient glass sector, primarily focused on expanding production capacity, geographical reach, and technological expertise.
Energy-efficient Glass Market Growth Trends & Insights
The energy-efficient glass market is experiencing robust growth, driven by several factors. The market size expanded from xx Million units in 2019 to xx Million units in 2024, representing a CAGR of xx%. This growth trajectory is expected to continue, with a projected CAGR of xx% during the forecast period (2025-2033), reaching xx Million units by 2033. This growth is fueled by increasing adoption across various end-user sectors, particularly building and construction and the automotive industry. Technological advancements, such as the introduction of self-cleaning and electrochromic glass, are further stimulating market expansion. Consumer preferences are shifting towards sustainable and energy-efficient products, driving demand for energy-efficient glass solutions.
Dominant Regions, Countries, or Segments in Energy-efficient Glass Market
North America and Europe currently dominate the energy-efficient glass market, driven by stringent building codes, high consumer awareness, and robust construction activity. However, Asia-Pacific is experiencing rapid growth due to expanding infrastructure projects and rising urbanization.
- Leading Segment: The double-glazing segment holds the largest market share, driven by its superior energy efficiency compared to single-glazing. Within coating types, Low-E coatings are dominating due to their effectiveness in reducing heat transfer.
- Key Regional Drivers: Strong government support for renewable energy initiatives and energy-efficient building practices are propelling growth in North America and Europe. In Asia-Pacific, rapid urbanization and infrastructure development are key growth drivers.
- Market Share & Growth Potential: North America currently holds the largest market share, while Asia-Pacific exhibits the highest growth potential due to its large and expanding construction sector.
Energy-efficient Glass Market Product Landscape
The energy-efficient glass market offers a diverse range of products, including Low-E coated glass, self-cleaning glass, electrochromic glass, and insulated glass units (IGUs). These products are tailored to meet diverse needs across various applications, offering unique selling propositions based on energy efficiency, thermal performance, and aesthetic appeal. Recent technological advancements focus on improving light transmission, solar control, and overall thermal performance while reducing manufacturing costs.
Key Drivers, Barriers & Challenges in Energy-efficient Glass Market
Key Drivers:
- Increasing demand for energy-efficient buildings and vehicles due to rising energy costs and environmental concerns.
- Stringent government regulations and building codes promoting energy efficiency.
- Technological advancements leading to improved performance and cost-effectiveness of energy-efficient glass.
Key Challenges & Restraints:
- High initial investment costs associated with energy-efficient glass can hinder adoption in price-sensitive markets.
- Supply chain disruptions and fluctuations in raw material prices can impact production costs and profitability.
- Competition from alternative insulation technologies and window films poses a challenge to market growth.
Emerging Opportunities in Energy-Efficient Glass Market
- Growing demand for energy-efficient glass in the renewable energy sector (e.g., solar panels).
- Expanding applications in smart buildings and smart homes, leveraging technology integration for enhanced energy management.
- Increased focus on developing sustainable and recyclable energy-efficient glass solutions to address environmental concerns.
Growth Accelerators in the Energy-efficient Glass Market Industry
Technological breakthroughs, such as the development of advanced coatings and glazing systems with enhanced performance, are key growth accelerators. Strategic partnerships between glass manufacturers, building material suppliers, and technology providers are further driving market expansion. Aggressive market expansion strategies targeting emerging economies and untapped markets will also contribute to long-term growth.
Key Players Shaping the Energy-efficient Glass Market Market
- Nippon Sheet Glass Co Ltd
- AGC Glass Europe
- Şişecam
- Vitro
- Saint-Gobain
- Morley Glass & Glazing Ltd
- Tuffx Glass
- Cardinal Glass Industries Inc
- Abrisa Technologies
- SCHOTT AG
- Guardian Industries Holdings
- Central Glass Co Ltd
Notable Milestones in Energy-efficient Glass Market Sector
- August 2022: NSG Group announces expansion of TCO coated glass production in Malaysia, targeting solar panel manufacturers.
- May 2022: AGC Inc. develops light-control panoramic roof glass for the Lexus RZ electric vehicle, showcasing advanced Low-E coating technology.
In-Depth Energy-efficient Glass Market Market Outlook
The energy-efficient glass market is poised for significant growth in the coming years, driven by ongoing technological advancements, increasing environmental awareness, and supportive government policies. Strategic opportunities exist for companies to capitalize on the rising demand for sustainable building materials and eco-friendly transportation solutions. Expansion into emerging markets and the development of innovative products will be crucial for long-term success in this dynamic market.
Energy-efficient Glass Market Segmentation
-
1. Coating Type
- 1.1. Hard
- 1.2. Soft
-
2. Glazing Type
- 2.1. Single
- 2.2. Double
- 2.3. Triple
-
3. End-user Industry
- 3.1. Building and Construction
- 3.2. Automotive
- 3.3. Solar Panel
- 3.4. Other End-user Industries (Industrial, etc.)
Energy-efficient Glass Market Segmentation By Geography
-
1. Asia Pacific
- 1.1. China
- 1.2. India
- 1.3. Japan
- 1.4. South Korea
- 1.5. Rest of Asia Pacific
-
2. North America
- 2.1. United States
- 2.2. Canada
- 2.3. Mexico
-
3. Europe
- 3.1. Germany
- 3.2. United Kingdom
- 3.3. France
- 3.4. Italy
- 3.5. Rest of Europe
-
4. South America
- 4.1. Brazil
- 4.2. Argentina
- 4.3. Rest of South America
-
5. Middle East and Africa
- 5.1. Saudi Arabia
- 5.2. South Africa
- 5.3. Rest of Middle East and Africa
Energy-efficient Glass Market Regional Market Share
Geographic Coverage of Energy-efficient Glass Market
Energy-efficient Glass Market REPORT HIGHLIGHTS
| Aspects | Details |
|---|---|
| Study Period | 2020-2034 |
| Base Year | 2025 |
| Estimated Year | 2026 |
| Forecast Period | 2026-2034 |
| Historical Period | 2020-2025 |
| Growth Rate | CAGR of > 5.00% from 2020-2034 |
| Segmentation |
|
Table of Contents
- 1. Introduction
- 1.1. Research Scope
- 1.2. Market Segmentation
- 1.3. Research Objective
- 1.4. Definitions and Assumptions
- 2. Executive Summary
- 2.1. Market Snapshot
- 3. Market Dynamics
- 3.1. Market Drivers
- 3.2. Market Restrains
- 3.3. Market Trends
- 3.4. Market Opportunities
- 4. Market Factor Analysis
- 4.1. Porters Five Forces
- 4.1.1. Bargaining Power of Suppliers
- 4.1.2. Bargaining Power of Buyers
- 4.1.3. Threat of New Entrants
- 4.1.4. Threat of Substitutes
- 4.1.5. Competitive Rivalry
- 4.2. PESTEL analysis
- 4.3. BCG Analysis
- 4.3.1. Stars (High Growth, High Market Share)
- 4.3.2. Cash Cows (Low Growth, High Market Share)
- 4.3.3. Question Mark (High Growth, Low Market Share)
- 4.3.4. Dogs (Low Growth, Low Market Share)
- 4.4. Ansoff Matrix Analysis
- 4.5. Supply Chain Analysis
- 4.6. Regulatory Landscape
- 4.7. Current Market Potential and Opportunity Assessment (TAM–SAM–SOM Framework)
- 4.8. VDR Analyst Note
- 4.1. Porters Five Forces
- 5. Market Analysis, Insights and Forecast 2021-2033
- 5.1. Market Analysis, Insights and Forecast - by Coating Type
- 5.1.1. Hard
- 5.1.2. Soft
- 5.2. Market Analysis, Insights and Forecast - by Glazing Type
- 5.2.1. Single
- 5.2.2. Double
- 5.2.3. Triple
- 5.3. Market Analysis, Insights and Forecast - by End-user Industry
- 5.3.1. Building and Construction
- 5.3.2. Automotive
- 5.3.3. Solar Panel
- 5.3.4. Other End-user Industries (Industrial, etc.)
- 5.4. Market Analysis, Insights and Forecast - by Region
- 5.4.1. Asia Pacific
- 5.4.2. North America
- 5.4.3. Europe
- 5.4.4. South America
- 5.4.5. Middle East and Africa
- 5.1. Market Analysis, Insights and Forecast - by Coating Type
- 6. Global Energy-efficient Glass Market Analysis, Insights and Forecast, 2021-2033
- 6.1. Market Analysis, Insights and Forecast - by Coating Type
- 6.1.1. Hard
- 6.1.2. Soft
- 6.2. Market Analysis, Insights and Forecast - by Glazing Type
- 6.2.1. Single
- 6.2.2. Double
- 6.2.3. Triple
- 6.3. Market Analysis, Insights and Forecast - by End-user Industry
- 6.3.1. Building and Construction
- 6.3.2. Automotive
- 6.3.3. Solar Panel
- 6.3.4. Other End-user Industries (Industrial, etc.)
- 6.1. Market Analysis, Insights and Forecast - by Coating Type
- 7. Asia Pacific Energy-efficient Glass Market Analysis, Insights and Forecast, 2021-2033
- 7.1. Market Analysis, Insights and Forecast - by Coating Type
- 7.1.1. Hard
- 7.1.2. Soft
- 7.2. Market Analysis, Insights and Forecast - by Glazing Type
- 7.2.1. Single
- 7.2.2. Double
- 7.2.3. Triple
- 7.3. Market Analysis, Insights and Forecast - by End-user Industry
- 7.3.1. Building and Construction
- 7.3.2. Automotive
- 7.3.3. Solar Panel
- 7.3.4. Other End-user Industries (Industrial, etc.)
- 7.1. Market Analysis, Insights and Forecast - by Coating Type
- 8. North America Energy-efficient Glass Market Analysis, Insights and Forecast, 2021-2033
- 8.1. Market Analysis, Insights and Forecast - by Coating Type
- 8.1.1. Hard
- 8.1.2. Soft
- 8.2. Market Analysis, Insights and Forecast - by Glazing Type
- 8.2.1. Single
- 8.2.2. Double
- 8.2.3. Triple
- 8.3. Market Analysis, Insights and Forecast - by End-user Industry
- 8.3.1. Building and Construction
- 8.3.2. Automotive
- 8.3.3. Solar Panel
- 8.3.4. Other End-user Industries (Industrial, etc.)
- 8.1. Market Analysis, Insights and Forecast - by Coating Type
- 9. Europe Energy-efficient Glass Market Analysis, Insights and Forecast, 2021-2033
- 9.1. Market Analysis, Insights and Forecast - by Coating Type
- 9.1.1. Hard
- 9.1.2. Soft
- 9.2. Market Analysis, Insights and Forecast - by Glazing Type
- 9.2.1. Single
- 9.2.2. Double
- 9.2.3. Triple
- 9.3. Market Analysis, Insights and Forecast - by End-user Industry
- 9.3.1. Building and Construction
- 9.3.2. Automotive
- 9.3.3. Solar Panel
- 9.3.4. Other End-user Industries (Industrial, etc.)
- 9.1. Market Analysis, Insights and Forecast - by Coating Type
- 10. South America Energy-efficient Glass Market Analysis, Insights and Forecast, 2021-2033
- 10.1. Market Analysis, Insights and Forecast - by Coating Type
- 10.1.1. Hard
- 10.1.2. Soft
- 10.2. Market Analysis, Insights and Forecast - by Glazing Type
- 10.2.1. Single
- 10.2.2. Double
- 10.2.3. Triple
- 10.3. Market Analysis, Insights and Forecast - by End-user Industry
- 10.3.1. Building and Construction
- 10.3.2. Automotive
- 10.3.3. Solar Panel
- 10.3.4. Other End-user Industries (Industrial, etc.)
- 10.1. Market Analysis, Insights and Forecast - by Coating Type
- 11. Middle East and Africa Energy-efficient Glass Market Analysis, Insights and Forecast, 2021-2033
- 11.1. Market Analysis, Insights and Forecast - by Coating Type
- 11.1.1. Hard
- 11.1.2. Soft
- 11.2. Market Analysis, Insights and Forecast - by Glazing Type
- 11.2.1. Single
- 11.2.2. Double
- 11.2.3. Triple
- 11.3. Market Analysis, Insights and Forecast - by End-user Industry
- 11.3.1. Building and Construction
- 11.3.2. Automotive
- 11.3.3. Solar Panel
- 11.3.4. Other End-user Industries (Industrial, etc.)
- 11.1. Market Analysis, Insights and Forecast - by Coating Type
- 12. Competitive Analysis
- 12.1. Company Profiles
- 12.1.1 Nippon Sheet Glass Co Ltd
- 12.1.1.1. Company Overview
- 12.1.1.2. Products
- 12.1.1.3. Company Financials
- 12.1.1.4. SWOT Analysis
- 12.1.2 AGC Glass Europe
- 12.1.2.1. Company Overview
- 12.1.2.2. Products
- 12.1.2.3. Company Financials
- 12.1.2.4. SWOT Analysis
- 12.1.3 Şişecam
- 12.1.3.1. Company Overview
- 12.1.3.2. Products
- 12.1.3.3. Company Financials
- 12.1.3.4. SWOT Analysis
- 12.1.4 Vitro*List Not Exhaustive
- 12.1.4.1. Company Overview
- 12.1.4.2. Products
- 12.1.4.3. Company Financials
- 12.1.4.4. SWOT Analysis
- 12.1.5 Saint-Gobain
- 12.1.5.1. Company Overview
- 12.1.5.2. Products
- 12.1.5.3. Company Financials
- 12.1.5.4. SWOT Analysis
- 12.1.6 Morley Glass & Glazing Ltd
- 12.1.6.1. Company Overview
- 12.1.6.2. Products
- 12.1.6.3. Company Financials
- 12.1.6.4. SWOT Analysis
- 12.1.7 Tuffx Glass
- 12.1.7.1. Company Overview
- 12.1.7.2. Products
- 12.1.7.3. Company Financials
- 12.1.7.4. SWOT Analysis
- 12.1.8 Cardinal Glass Industries Inc
- 12.1.8.1. Company Overview
- 12.1.8.2. Products
- 12.1.8.3. Company Financials
- 12.1.8.4. SWOT Analysis
- 12.1.9 Abrisa Technologies
- 12.1.9.1. Company Overview
- 12.1.9.2. Products
- 12.1.9.3. Company Financials
- 12.1.9.4. SWOT Analysis
- 12.1.10 SCHOTT AG
- 12.1.10.1. Company Overview
- 12.1.10.2. Products
- 12.1.10.3. Company Financials
- 12.1.10.4. SWOT Analysis
- 12.1.11 Guardian Industries Holdings
- 12.1.11.1. Company Overview
- 12.1.11.2. Products
- 12.1.11.3. Company Financials
- 12.1.11.4. SWOT Analysis
- 12.1.12 Central Glass Co Ltd
- 12.1.12.1. Company Overview
- 12.1.12.2. Products
- 12.1.12.3. Company Financials
- 12.1.12.4. SWOT Analysis
- 12.1.1 Nippon Sheet Glass Co Ltd
- 12.2. Market Entropy
- 12.2.1 Company's Key Areas Served
- 12.2.2 Recent Developments
- 12.3. Company Market Share Analysis 2025
- 12.3.1 Top 5 Companies Market Share Analysis
- 12.3.2 Top 3 Companies Market Share Analysis
- 12.4. List of Potential Customers
- 13. Research Methodology
List of Figures
- Figure 1: Global Energy-efficient Glass Market Revenue Breakdown (Million, %) by Region 2025 & 2033
- Figure 2: Global Energy-efficient Glass Market Volume Breakdown (Kiloton, %) by Region 2025 & 2033
- Figure 3: Asia Pacific Energy-efficient Glass Market Revenue (Million), by Coating Type 2025 & 2033
- Figure 4: Asia Pacific Energy-efficient Glass Market Volume (Kiloton), by Coating Type 2025 & 2033
- Figure 5: Asia Pacific Energy-efficient Glass Market Revenue Share (%), by Coating Type 2025 & 2033
- Figure 6: Asia Pacific Energy-efficient Glass Market Volume Share (%), by Coating Type 2025 & 2033
- Figure 7: Asia Pacific Energy-efficient Glass Market Revenue (Million), by Glazing Type 2025 & 2033
- Figure 8: Asia Pacific Energy-efficient Glass Market Volume (Kiloton), by Glazing Type 2025 & 2033
- Figure 9: Asia Pacific Energy-efficient Glass Market Revenue Share (%), by Glazing Type 2025 & 2033
- Figure 10: Asia Pacific Energy-efficient Glass Market Volume Share (%), by Glazing Type 2025 & 2033
- Figure 11: Asia Pacific Energy-efficient Glass Market Revenue (Million), by End-user Industry 2025 & 2033
- Figure 12: Asia Pacific Energy-efficient Glass Market Volume (Kiloton), by End-user Industry 2025 & 2033
- Figure 13: Asia Pacific Energy-efficient Glass Market Revenue Share (%), by End-user Industry 2025 & 2033
- Figure 14: Asia Pacific Energy-efficient Glass Market Volume Share (%), by End-user Industry 2025 & 2033
- Figure 15: Asia Pacific Energy-efficient Glass Market Revenue (Million), by Country 2025 & 2033
- Figure 16: Asia Pacific Energy-efficient Glass Market Volume (Kiloton), by Country 2025 & 2033
- Figure 17: Asia Pacific Energy-efficient Glass Market Revenue Share (%), by Country 2025 & 2033
- Figure 18: Asia Pacific Energy-efficient Glass Market Volume Share (%), by Country 2025 & 2033
- Figure 19: North America Energy-efficient Glass Market Revenue (Million), by Coating Type 2025 & 2033
- Figure 20: North America Energy-efficient Glass Market Volume (Kiloton), by Coating Type 2025 & 2033
- Figure 21: North America Energy-efficient Glass Market Revenue Share (%), by Coating Type 2025 & 2033
- Figure 22: North America Energy-efficient Glass Market Volume Share (%), by Coating Type 2025 & 2033
- Figure 23: North America Energy-efficient Glass Market Revenue (Million), by Glazing Type 2025 & 2033
- Figure 24: North America Energy-efficient Glass Market Volume (Kiloton), by Glazing Type 2025 & 2033
- Figure 25: North America Energy-efficient Glass Market Revenue Share (%), by Glazing Type 2025 & 2033
- Figure 26: North America Energy-efficient Glass Market Volume Share (%), by Glazing Type 2025 & 2033
- Figure 27: North America Energy-efficient Glass Market Revenue (Million), by End-user Industry 2025 & 2033
- Figure 28: North America Energy-efficient Glass Market Volume (Kiloton), by End-user Industry 2025 & 2033
- Figure 29: North America Energy-efficient Glass Market Revenue Share (%), by End-user Industry 2025 & 2033
- Figure 30: North America Energy-efficient Glass Market Volume Share (%), by End-user Industry 2025 & 2033
- Figure 31: North America Energy-efficient Glass Market Revenue (Million), by Country 2025 & 2033
- Figure 32: North America Energy-efficient Glass Market Volume (Kiloton), by Country 2025 & 2033
- Figure 33: North America Energy-efficient Glass Market Revenue Share (%), by Country 2025 & 2033
- Figure 34: North America Energy-efficient Glass Market Volume Share (%), by Country 2025 & 2033
- Figure 35: Europe Energy-efficient Glass Market Revenue (Million), by Coating Type 2025 & 2033
- Figure 36: Europe Energy-efficient Glass Market Volume (Kiloton), by Coating Type 2025 & 2033
- Figure 37: Europe Energy-efficient Glass Market Revenue Share (%), by Coating Type 2025 & 2033
- Figure 38: Europe Energy-efficient Glass Market Volume Share (%), by Coating Type 2025 & 2033
- Figure 39: Europe Energy-efficient Glass Market Revenue (Million), by Glazing Type 2025 & 2033
- Figure 40: Europe Energy-efficient Glass Market Volume (Kiloton), by Glazing Type 2025 & 2033
- Figure 41: Europe Energy-efficient Glass Market Revenue Share (%), by Glazing Type 2025 & 2033
- Figure 42: Europe Energy-efficient Glass Market Volume Share (%), by Glazing Type 2025 & 2033
- Figure 43: Europe Energy-efficient Glass Market Revenue (Million), by End-user Industry 2025 & 2033
- Figure 44: Europe Energy-efficient Glass Market Volume (Kiloton), by End-user Industry 2025 & 2033
- Figure 45: Europe Energy-efficient Glass Market Revenue Share (%), by End-user Industry 2025 & 2033
- Figure 46: Europe Energy-efficient Glass Market Volume Share (%), by End-user Industry 2025 & 2033
- Figure 47: Europe Energy-efficient Glass Market Revenue (Million), by Country 2025 & 2033
- Figure 48: Europe Energy-efficient Glass Market Volume (Kiloton), by Country 2025 & 2033
- Figure 49: Europe Energy-efficient Glass Market Revenue Share (%), by Country 2025 & 2033
- Figure 50: Europe Energy-efficient Glass Market Volume Share (%), by Country 2025 & 2033
- Figure 51: South America Energy-efficient Glass Market Revenue (Million), by Coating Type 2025 & 2033
- Figure 52: South America Energy-efficient Glass Market Volume (Kiloton), by Coating Type 2025 & 2033
- Figure 53: South America Energy-efficient Glass Market Revenue Share (%), by Coating Type 2025 & 2033
- Figure 54: South America Energy-efficient Glass Market Volume Share (%), by Coating Type 2025 & 2033
- Figure 55: South America Energy-efficient Glass Market Revenue (Million), by Glazing Type 2025 & 2033
- Figure 56: South America Energy-efficient Glass Market Volume (Kiloton), by Glazing Type 2025 & 2033
- Figure 57: South America Energy-efficient Glass Market Revenue Share (%), by Glazing Type 2025 & 2033
- Figure 58: South America Energy-efficient Glass Market Volume Share (%), by Glazing Type 2025 & 2033
- Figure 59: South America Energy-efficient Glass Market Revenue (Million), by End-user Industry 2025 & 2033
- Figure 60: South America Energy-efficient Glass Market Volume (Kiloton), by End-user Industry 2025 & 2033
- Figure 61: South America Energy-efficient Glass Market Revenue Share (%), by End-user Industry 2025 & 2033
- Figure 62: South America Energy-efficient Glass Market Volume Share (%), by End-user Industry 2025 & 2033
- Figure 63: South America Energy-efficient Glass Market Revenue (Million), by Country 2025 & 2033
- Figure 64: South America Energy-efficient Glass Market Volume (Kiloton), by Country 2025 & 2033
- Figure 65: South America Energy-efficient Glass Market Revenue Share (%), by Country 2025 & 2033
- Figure 66: South America Energy-efficient Glass Market Volume Share (%), by Country 2025 & 2033
- Figure 67: Middle East and Africa Energy-efficient Glass Market Revenue (Million), by Coating Type 2025 & 2033
- Figure 68: Middle East and Africa Energy-efficient Glass Market Volume (Kiloton), by Coating Type 2025 & 2033
- Figure 69: Middle East and Africa Energy-efficient Glass Market Revenue Share (%), by Coating Type 2025 & 2033
- Figure 70: Middle East and Africa Energy-efficient Glass Market Volume Share (%), by Coating Type 2025 & 2033
- Figure 71: Middle East and Africa Energy-efficient Glass Market Revenue (Million), by Glazing Type 2025 & 2033
- Figure 72: Middle East and Africa Energy-efficient Glass Market Volume (Kiloton), by Glazing Type 2025 & 2033
- Figure 73: Middle East and Africa Energy-efficient Glass Market Revenue Share (%), by Glazing Type 2025 & 2033
- Figure 74: Middle East and Africa Energy-efficient Glass Market Volume Share (%), by Glazing Type 2025 & 2033
- Figure 75: Middle East and Africa Energy-efficient Glass Market Revenue (Million), by End-user Industry 2025 & 2033
- Figure 76: Middle East and Africa Energy-efficient Glass Market Volume (Kiloton), by End-user Industry 2025 & 2033
- Figure 77: Middle East and Africa Energy-efficient Glass Market Revenue Share (%), by End-user Industry 2025 & 2033
- Figure 78: Middle East and Africa Energy-efficient Glass Market Volume Share (%), by End-user Industry 2025 & 2033
- Figure 79: Middle East and Africa Energy-efficient Glass Market Revenue (Million), by Country 2025 & 2033
- Figure 80: Middle East and Africa Energy-efficient Glass Market Volume (Kiloton), by Country 2025 & 2033
- Figure 81: Middle East and Africa Energy-efficient Glass Market Revenue Share (%), by Country 2025 & 2033
- Figure 82: Middle East and Africa Energy-efficient Glass Market Volume Share (%), by Country 2025 & 2033
List of Tables
- Table 1: Global Energy-efficient Glass Market Revenue Million Forecast, by Coating Type 2020 & 2033
- Table 2: Global Energy-efficient Glass Market Volume Kiloton Forecast, by Coating Type 2020 & 2033
- Table 3: Global Energy-efficient Glass Market Revenue Million Forecast, by Glazing Type 2020 & 2033
- Table 4: Global Energy-efficient Glass Market Volume Kiloton Forecast, by Glazing Type 2020 & 2033
- Table 5: Global Energy-efficient Glass Market Revenue Million Forecast, by End-user Industry 2020 & 2033
- Table 6: Global Energy-efficient Glass Market Volume Kiloton Forecast, by End-user Industry 2020 & 2033
- Table 7: Global Energy-efficient Glass Market Revenue Million Forecast, by Region 2020 & 2033
- Table 8: Global Energy-efficient Glass Market Volume Kiloton Forecast, by Region 2020 & 2033
- Table 9: Global Energy-efficient Glass Market Revenue Million Forecast, by Coating Type 2020 & 2033
- Table 10: Global Energy-efficient Glass Market Volume Kiloton Forecast, by Coating Type 2020 & 2033
- Table 11: Global Energy-efficient Glass Market Revenue Million Forecast, by Glazing Type 2020 & 2033
- Table 12: Global Energy-efficient Glass Market Volume Kiloton Forecast, by Glazing Type 2020 & 2033
- Table 13: Global Energy-efficient Glass Market Revenue Million Forecast, by End-user Industry 2020 & 2033
- Table 14: Global Energy-efficient Glass Market Volume Kiloton Forecast, by End-user Industry 2020 & 2033
- Table 15: Global Energy-efficient Glass Market Revenue Million Forecast, by Country 2020 & 2033
- Table 16: Global Energy-efficient Glass Market Volume Kiloton Forecast, by Country 2020 & 2033
- Table 17: China Energy-efficient Glass Market Revenue (Million) Forecast, by Application 2020 & 2033
- Table 18: China Energy-efficient Glass Market Volume (Kiloton) Forecast, by Application 2020 & 2033
- Table 19: India Energy-efficient Glass Market Revenue (Million) Forecast, by Application 2020 & 2033
- Table 20: India Energy-efficient Glass Market Volume (Kiloton) Forecast, by Application 2020 & 2033
- Table 21: Japan Energy-efficient Glass Market Revenue (Million) Forecast, by Application 2020 & 2033
- Table 22: Japan Energy-efficient Glass Market Volume (Kiloton) Forecast, by Application 2020 & 2033
- Table 23: South Korea Energy-efficient Glass Market Revenue (Million) Forecast, by Application 2020 & 2033
- Table 24: South Korea Energy-efficient Glass Market Volume (Kiloton) Forecast, by Application 2020 & 2033
- Table 25: Rest of Asia Pacific Energy-efficient Glass Market Revenue (Million) Forecast, by Application 2020 & 2033
- Table 26: Rest of Asia Pacific Energy-efficient Glass Market Volume (Kiloton) Forecast, by Application 2020 & 2033
- Table 27: Global Energy-efficient Glass Market Revenue Million Forecast, by Coating Type 2020 & 2033
- Table 28: Global Energy-efficient Glass Market Volume Kiloton Forecast, by Coating Type 2020 & 2033
- Table 29: Global Energy-efficient Glass Market Revenue Million Forecast, by Glazing Type 2020 & 2033
- Table 30: Global Energy-efficient Glass Market Volume Kiloton Forecast, by Glazing Type 2020 & 2033
- Table 31: Global Energy-efficient Glass Market Revenue Million Forecast, by End-user Industry 2020 & 2033
- Table 32: Global Energy-efficient Glass Market Volume Kiloton Forecast, by End-user Industry 2020 & 2033
- Table 33: Global Energy-efficient Glass Market Revenue Million Forecast, by Country 2020 & 2033
- Table 34: Global Energy-efficient Glass Market Volume Kiloton Forecast, by Country 2020 & 2033
- Table 35: United States Energy-efficient Glass Market Revenue (Million) Forecast, by Application 2020 & 2033
- Table 36: United States Energy-efficient Glass Market Volume (Kiloton) Forecast, by Application 2020 & 2033
- Table 37: Canada Energy-efficient Glass Market Revenue (Million) Forecast, by Application 2020 & 2033
- Table 38: Canada Energy-efficient Glass Market Volume (Kiloton) Forecast, by Application 2020 & 2033
- Table 39: Mexico Energy-efficient Glass Market Revenue (Million) Forecast, by Application 2020 & 2033
- Table 40: Mexico Energy-efficient Glass Market Volume (Kiloton) Forecast, by Application 2020 & 2033
- Table 41: Global Energy-efficient Glass Market Revenue Million Forecast, by Coating Type 2020 & 2033
- Table 42: Global Energy-efficient Glass Market Volume Kiloton Forecast, by Coating Type 2020 & 2033
- Table 43: Global Energy-efficient Glass Market Revenue Million Forecast, by Glazing Type 2020 & 2033
- Table 44: Global Energy-efficient Glass Market Volume Kiloton Forecast, by Glazing Type 2020 & 2033
- Table 45: Global Energy-efficient Glass Market Revenue Million Forecast, by End-user Industry 2020 & 2033
- Table 46: Global Energy-efficient Glass Market Volume Kiloton Forecast, by End-user Industry 2020 & 2033
- Table 47: Global Energy-efficient Glass Market Revenue Million Forecast, by Country 2020 & 2033
- Table 48: Global Energy-efficient Glass Market Volume Kiloton Forecast, by Country 2020 & 2033
- Table 49: Germany Energy-efficient Glass Market Revenue (Million) Forecast, by Application 2020 & 2033
- Table 50: Germany Energy-efficient Glass Market Volume (Kiloton) Forecast, by Application 2020 & 2033
- Table 51: United Kingdom Energy-efficient Glass Market Revenue (Million) Forecast, by Application 2020 & 2033
- Table 52: United Kingdom Energy-efficient Glass Market Volume (Kiloton) Forecast, by Application 2020 & 2033
- Table 53: France Energy-efficient Glass Market Revenue (Million) Forecast, by Application 2020 & 2033
- Table 54: France Energy-efficient Glass Market Volume (Kiloton) Forecast, by Application 2020 & 2033
- Table 55: Italy Energy-efficient Glass Market Revenue (Million) Forecast, by Application 2020 & 2033
- Table 56: Italy Energy-efficient Glass Market Volume (Kiloton) Forecast, by Application 2020 & 2033
- Table 57: Rest of Europe Energy-efficient Glass Market Revenue (Million) Forecast, by Application 2020 & 2033
- Table 58: Rest of Europe Energy-efficient Glass Market Volume (Kiloton) Forecast, by Application 2020 & 2033
- Table 59: Global Energy-efficient Glass Market Revenue Million Forecast, by Coating Type 2020 & 2033
- Table 60: Global Energy-efficient Glass Market Volume Kiloton Forecast, by Coating Type 2020 & 2033
- Table 61: Global Energy-efficient Glass Market Revenue Million Forecast, by Glazing Type 2020 & 2033
- Table 62: Global Energy-efficient Glass Market Volume Kiloton Forecast, by Glazing Type 2020 & 2033
- Table 63: Global Energy-efficient Glass Market Revenue Million Forecast, by End-user Industry 2020 & 2033
- Table 64: Global Energy-efficient Glass Market Volume Kiloton Forecast, by End-user Industry 2020 & 2033
- Table 65: Global Energy-efficient Glass Market Revenue Million Forecast, by Country 2020 & 2033
- Table 66: Global Energy-efficient Glass Market Volume Kiloton Forecast, by Country 2020 & 2033
- Table 67: Brazil Energy-efficient Glass Market Revenue (Million) Forecast, by Application 2020 & 2033
- Table 68: Brazil Energy-efficient Glass Market Volume (Kiloton) Forecast, by Application 2020 & 2033
- Table 69: Argentina Energy-efficient Glass Market Revenue (Million) Forecast, by Application 2020 & 2033
- Table 70: Argentina Energy-efficient Glass Market Volume (Kiloton) Forecast, by Application 2020 & 2033
- Table 71: Rest of South America Energy-efficient Glass Market Revenue (Million) Forecast, by Application 2020 & 2033
- Table 72: Rest of South America Energy-efficient Glass Market Volume (Kiloton) Forecast, by Application 2020 & 2033
- Table 73: Global Energy-efficient Glass Market Revenue Million Forecast, by Coating Type 2020 & 2033
- Table 74: Global Energy-efficient Glass Market Volume Kiloton Forecast, by Coating Type 2020 & 2033
- Table 75: Global Energy-efficient Glass Market Revenue Million Forecast, by Glazing Type 2020 & 2033
- Table 76: Global Energy-efficient Glass Market Volume Kiloton Forecast, by Glazing Type 2020 & 2033
- Table 77: Global Energy-efficient Glass Market Revenue Million Forecast, by End-user Industry 2020 & 2033
- Table 78: Global Energy-efficient Glass Market Volume Kiloton Forecast, by End-user Industry 2020 & 2033
- Table 79: Global Energy-efficient Glass Market Revenue Million Forecast, by Country 2020 & 2033
- Table 80: Global Energy-efficient Glass Market Volume Kiloton Forecast, by Country 2020 & 2033
- Table 81: Saudi Arabia Energy-efficient Glass Market Revenue (Million) Forecast, by Application 2020 & 2033
- Table 82: Saudi Arabia Energy-efficient Glass Market Volume (Kiloton) Forecast, by Application 2020 & 2033
- Table 83: South Africa Energy-efficient Glass Market Revenue (Million) Forecast, by Application 2020 & 2033
- Table 84: South Africa Energy-efficient Glass Market Volume (Kiloton) Forecast, by Application 2020 & 2033
- Table 85: Rest of Middle East and Africa Energy-efficient Glass Market Revenue (Million) Forecast, by Application 2020 & 2033
- Table 86: Rest of Middle East and Africa Energy-efficient Glass Market Volume (Kiloton) Forecast, by Application 2020 & 2033
Frequently Asked Questions
1. What is the projected Compound Annual Growth Rate (CAGR) of the Energy-efficient Glass Market?
The projected CAGR is approximately > 5.00%.
2. Which companies are prominent players in the Energy-efficient Glass Market?
Key companies in the market include Nippon Sheet Glass Co Ltd, AGC Glass Europe, Şişecam, Vitro*List Not Exhaustive, Saint-Gobain, Morley Glass & Glazing Ltd, Tuffx Glass, Cardinal Glass Industries Inc, Abrisa Technologies, SCHOTT AG, Guardian Industries Holdings, Central Glass Co Ltd.
3. What are the main segments of the Energy-efficient Glass Market?
The market segments include Coating Type, Glazing Type, End-user Industry.
4. Can you provide details about the market size?
The market size is estimated to be USD 31.79 Million as of 2022.
5. What are some drivers contributing to market growth?
Increasing Application in the Building and Construction Sector; Growing Concern about High Carbon Emissions; Other Drivers.
6. What are the notable trends driving market growth?
Growing Demand from the Building and Construction Sector.
7. Are there any restraints impacting market growth?
High Price Bar of Energy-efficient Glass; Other Restraints.
8. Can you provide examples of recent developments in the market?
August 2022: NSG Group unveiled its expansion plan for TCO (transparent conductive oxide) coated glass production in Malaysia. The initiative involves the installation of a new float line at the Johor Bahru facility of Malaysian Sheet Glass SDN BHD, a member of the NSG Group. This expansion will incorporate online coating capacity and is set to commence TCO glass production for solar panel manufacturers by the close of 2024.
9. What pricing options are available for accessing the report?
Pricing options include single-user, multi-user, and enterprise licenses priced at USD 4750, USD 5250, and USD 8750 respectively.
10. Is the market size provided in terms of value or volume?
The market size is provided in terms of value, measured in Million and volume, measured in Kiloton.
11. Are there any specific market keywords associated with the report?
Yes, the market keyword associated with the report is "Energy-efficient Glass Market," which aids in identifying and referencing the specific market segment covered.
12. How do I determine which pricing option suits my needs best?
The pricing options vary based on user requirements and access needs. Individual users may opt for single-user licenses, while businesses requiring broader access may choose multi-user or enterprise licenses for cost-effective access to the report.
13. Are there any additional resources or data provided in the Energy-efficient Glass Market report?
While the report offers comprehensive insights, it's advisable to review the specific contents or supplementary materials provided to ascertain if additional resources or data are available.
14. How can I stay updated on further developments or reports in the Energy-efficient Glass Market?
To stay informed about further developments, trends, and reports in the Energy-efficient Glass Market, consider subscribing to industry newsletters, following relevant companies and organizations, or regularly checking reputable industry news sources and publications.
Methodology
Step 1 - Identification of Relevant Samples Size from Population Database


Step 2 - Approaches for Defining Global Market Size (Value, Volume* & Price*)

Note*: In applicable scenarios
Step 3 - Data Sources
Primary Research
- Web Analytics
- Survey Reports
- Research Institute
- Latest Research Reports
- Opinion Leaders
Secondary Research
- Annual Reports
- White Paper
- Latest Press Release
- Industry Association
- Paid Database
- Investor Presentations

Step 4 - Data Triangulation
Involves using different sources of information in order to increase the validity of a study
These sources are likely to be stakeholders in a program - participants, other researchers, program staff, other community members, and so on.
Then we put all data in single framework & apply various statistical tools to find out the dynamic on the market.
During the analysis stage, feedback from the stakeholder groups would be compared to determine areas of agreement as well as areas of divergence