

Key Insights
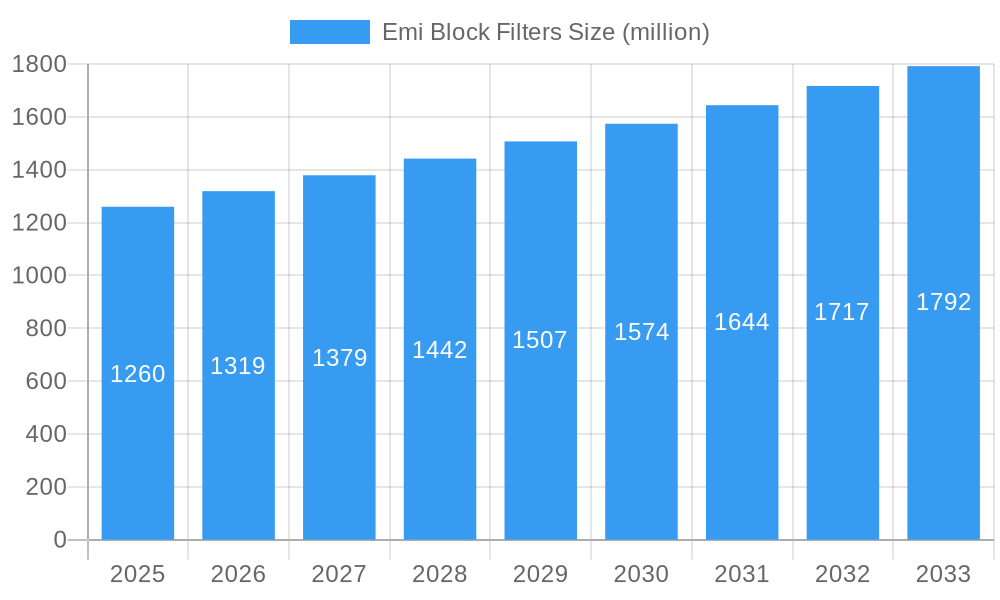
The global EMI block filter market is poised for robust expansion, projected to reach an estimated USD 1.26 billion in 2025. This growth trajectory is underpinned by a healthy Compound Annual Growth Rate (CAGR) of 4.7% anticipated over the forecast period of 2025-2033. A primary catalyst for this upward trend is the escalating adoption of sophisticated electronic components across a diverse range of industries. The increasing complexity and miniaturization of devices, particularly in consumer electronics and automotive applications, necessitate stringent electromagnetic interference (EMI) control to ensure optimal performance and reliability. Furthermore, the burgeoning demand for advanced medical equipment and the stringent regulatory requirements for electrical safety and signal integrity in aerospace and military sectors are significant drivers. The growing integration of smart technologies, including IoT devices and autonomous systems, further amplifies the need for effective EMI filtering solutions.
Emi Block Filters Market Size (In Billion)
While the market exhibits strong growth potential, certain factors may present challenges. Increased competition among key players, including Schaffner, TDK, and TE Connectivity, could lead to price pressures. Additionally, the development of novel EMI mitigation techniques or alternative filtering technologies could influence market dynamics. However, the persistent and growing reliance on electronic systems across all facets of modern life, coupled with ongoing technological advancements, will likely outweigh these restraints. The market is segmented by application, with Consumer Electronics and Automotive Electronics expected to dominate in terms of demand, and by type, with Single Phase and Three Phase types being the most prevalent. Geographically, Asia Pacific, driven by its manufacturing prowess and rapid technological adoption, is anticipated to be a significant growth region.
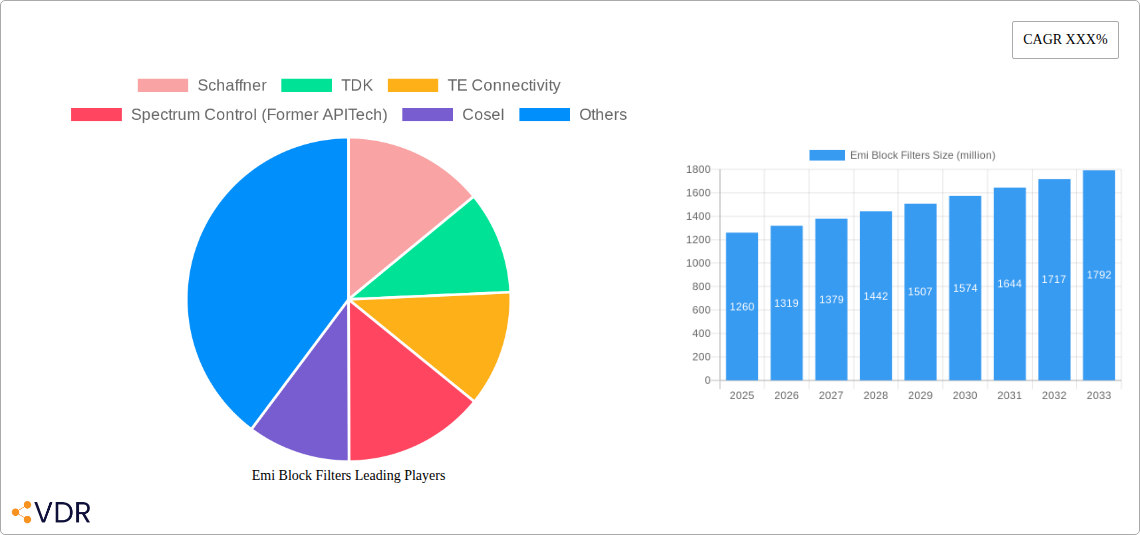
Emi Block Filters Company Market Share
Emi Block Filters Market Dynamics & Structure
The global EMI block filters market is characterized by a moderate to high concentration, with key players like Schaffner, TDK, and TE Connectivity holding significant market share. Technological innovation serves as a primary driver, fueled by the increasing demand for miniaturization, higher performance, and enhanced shielding capabilities across various industries. Regulatory frameworks, particularly those concerning electromagnetic compatibility (EMC) and safety standards, are increasingly stringent, pushing manufacturers to develop more sophisticated filtering solutions. Competitive product substitutes, such as alternative shielding materials and digital signal processing techniques, present a constant challenge, though EMI block filters remain indispensable for robust electromagnetic interference (EMI) suppression. End-user demographics are shifting towards sectors with high-paced technological evolution, including consumer electronics and automotive electronics, where the proliferation of smart devices and electric vehicles necessitates advanced EMI solutions. Mergers and acquisitions (M&A) are a notable trend, with companies consolidating to expand product portfolios, gain market access, and leverage technological synergies. For instance, KEMET's acquisition of YAGEO Group underscores this consolidation strategy.
- Market Concentration: Moderate to High.
- Technological Innovation Drivers: Miniaturization, higher performance, advanced shielding, increased device density.
- Regulatory Frameworks: Stringent EMC standards (e.g., FCC, CE), safety regulations driving demand for compliance.
- Competitive Product Substitutes: Alternative shielding materials, digital filtering techniques, system-level design optimization.
- End-User Demographics: Growing demand from Consumer Electronics (smart devices, IoT), Automotive Electronics (EVs, ADAS), and Aerospace/Military.
- M&A Trends: Consolidation for portfolio expansion, market access, and technology acquisition.
Emi Block Filters Growth Trends & Insights
The global EMI block filters market is poised for robust growth, projected to expand from an estimated market size of $5.2 billion in 2025 to $8.5 billion by 2033, exhibiting a Compound Annual Growth Rate (CAGR) of approximately 6.5% during the forecast period (2025-2033). This expansion is driven by a confluence of factors, including the escalating adoption of sophisticated electronic devices across nearly every facet of modern life. The proliferation of the Internet of Things (IoT), the increasing complexity of automotive electronics with the advent of electric vehicles (EVs) and advanced driver-assistance systems (ADAS), and the unwavering demand for reliable performance in aerospace and military applications are fundamentally shaping market trajectory. As device functionalities become more intricate and power densities increase, the necessity for effective EMI mitigation becomes paramount to ensure optimal performance, prevent malfunctions, and safeguard sensitive components.
Technological disruptions are also playing a pivotal role. Innovations in materials science are leading to the development of lighter, more efficient, and higher-performing EMI block filters. Furthermore, advancements in filter design, including the integration of multiple filtering stages and sophisticated component selection, are enabling manufacturers to meet increasingly demanding specifications for noise suppression across a wider frequency spectrum. Consumer behavior shifts, characterized by a growing expectation for seamless and uninterrupted electronic functionality, are indirectly fueling demand. Consumers are less tolerant of device interference, which consequently places pressure on manufacturers to incorporate superior EMI protection. The historical period (2019-2024) witnessed a steady growth, underpinned by the foundational demand from established electronics and telecommunications sectors. The base year, 2025, stands as a critical point, reflecting the current market state and serving as the launchpad for projected advancements. The adoption rates of EMI block filters are steadily climbing, driven by an ever-expanding array of electronic applications and a heightened awareness of EMI-related issues. The market penetration of these filters is expected to deepen significantly as new electronic products continue to emerge and existing ones become more complex. The interplay between evolving consumer expectations and stringent regulatory requirements is creating a dynamic environment that favors suppliers of advanced EMI block filtering solutions.
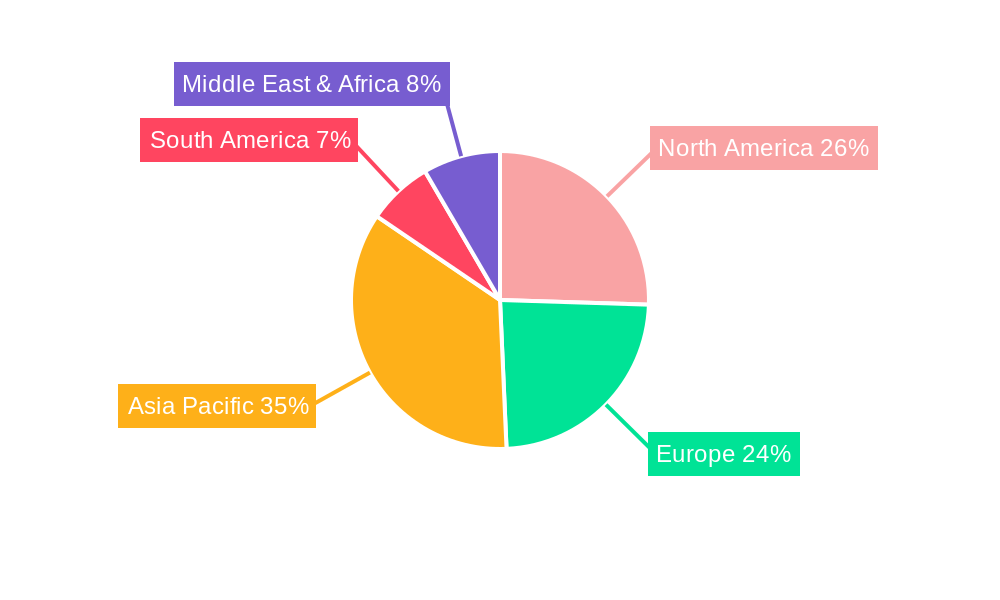
Dominant Regions, Countries, or Segments in Emi Block Filters
The Asia Pacific region is emerging as the dominant force in the global EMI block filters market, driven by its robust manufacturing capabilities, burgeoning electronics industry, and substantial investments in automotive and telecommunications infrastructure. Within this region, China stands out as a pivotal country, owing to its extensive production of consumer electronics, a rapidly expanding automotive sector with a strong push towards electric vehicles, and significant government initiatives supporting technological advancements. The Application segment of Consumer Electronics is a primary growth engine, accounting for an estimated 35% market share in 2025. The insatiable global demand for smartphones, smart home devices, wearable technology, and other connected gadgets necessitates advanced EMI filtering to ensure reliable operation and prevent interference between increasingly complex internal components and external signals.
Furthermore, the Automotive Electronics segment is exhibiting exceptionally strong growth potential, with an estimated market share of 28% in 2025. The electrification of vehicles, the integration of autonomous driving features, and the proliferation of in-car infotainment systems all introduce new layers of electronic complexity and necessitate sophisticated EMI mitigation to guarantee safety and performance. Countries like Germany, Japan, and South Korea, with their advanced automotive industries, are significant contributors to this segment's dominance within the Asia Pacific and globally. The Single Phase Type filters, while historically dominant in consumer electronics, are now seeing increasing demand alongside Three Phase Type filters, particularly in industrial applications and the growing EV charging infrastructure. However, the sheer volume of single-phase electronic devices manufactured and consumed globally solidifies its leading position in terms of unit volume.
Key drivers underpinning the dominance of the Asia Pacific and China include favorable manufacturing costs, a vast domestic market, supportive government policies promoting technological self-sufficiency, and the presence of major global electronics and automotive manufacturing hubs. Economic policies aimed at fostering innovation and production, coupled with significant investments in research and development, are further cementing the region's leadership. The market share within the Asia Pacific is projected to continue expanding, fueled by ongoing industrialization, urbanization, and the increasing integration of electronic technologies into everyday life. The growth potential here is immense, as both domestic consumption and export demands for electronic goods remain high.
Emi Block Filters Product Landscape
The EMI block filters product landscape is characterized by continuous innovation aimed at enhancing performance, miniaturization, and cost-effectiveness. Manufacturers are developing filters with broader frequency suppression capabilities, improved insertion loss, and higher current handling capacity. Key product innovations include multi-stage filters for complex noise environments, compact surface-mount devices (SMDs) for space-constrained applications, and customizable solutions tailored to specific industry needs. Applications span across critical sectors, from ensuring signal integrity in advanced aerospace communication systems to guaranteeing the reliable operation of medical diagnostic equipment and the smooth functioning of automotive control units. Performance metrics such as attenuation levels, impedance matching, and temperature stability are continuously being refined to meet stringent industry standards. Unique selling propositions often revolve around superior filtering efficiency, extended product lifespan, and compliance with emerging regulatory requirements.
Key Drivers, Barriers & Challenges in Emi Block Filters
Key Drivers: The primary forces propelling the EMI block filters market include the escalating complexity of electronic devices, leading to increased EMI issues. The growing demand for reliable operation in sensitive applications like automotive, aerospace, and medical sectors is a significant driver. Furthermore, stringent electromagnetic compatibility (EMC) regulations worldwide mandate the use of effective filtering solutions. Technological advancements in miniaturization and higher frequency performance also fuel market growth.
Key Barriers & Challenges: Supply chain disruptions, particularly for specialized components, can impact production and lead times, with potential impacts on market growth estimated to be in the range of 0.5% to 1.0% reduction in projected revenue. Regulatory hurdles and the need for continuous compliance testing add to development costs and time-to-market. Intense competition from both established players and emerging manufacturers leads to pricing pressures. Developing cost-effective solutions without compromising performance remains a constant challenge.
Emerging Opportunities in Emi Block Filters
Emerging opportunities in the EMI block filters sector lie in the rapidly expanding fields of 5G infrastructure, the continued growth of the electric vehicle (EV) market, and the increasing sophistication of industrial automation. The development of specialized filters for high-frequency 5G applications, including base stations and user equipment, presents a significant untapped market. For EVs, the need for robust EMI suppression in power electronics, charging systems, and battery management units offers substantial growth potential. Furthermore, the increasing adoption of smart manufacturing and Industry 4.0 initiatives is driving demand for reliable EMI filtering in industrial control systems and robotics. Innovative applications in medical devices, such as wearable health monitors and advanced imaging equipment, also represent growing opportunities.
Growth Accelerators in the Emi Block Filters Industry
Long-term growth in the EMI block filters industry will be significantly accelerated by breakthroughs in materials science, enabling the development of novel filtering materials with enhanced performance and reduced size. Strategic partnerships between filter manufacturers and original equipment manufacturers (OEMs) will foster co-development of tailored solutions, ensuring tighter integration and optimized performance. Market expansion into developing economies, driven by increasing adoption of electronic devices and evolving infrastructure, will provide new avenues for growth. Continuous investment in research and development to address emerging high-frequency interference challenges and to improve the power handling capabilities of filters will be crucial for sustained expansion.
Key Players Shaping the Emi Block Filters Market
- Schaffner
- TDK
- TE Connectivity
- Spectrum Control (Former APITech)
- Cosel
- Astrodyne TDI
- Delta Electronics
- KEMET (YAGEO Group)
- Schurter
- Crane Aerospace & Electronics
- Soshin electric
- BLOCK
- Ohmite Manufacturing
- Exxelia
- AERODEV Electromagnetic Tech
- Captor Corporation
- MORNSUN
- Jiangsu WEMC Electronic Technology
- Enerdoor
- Jones Tech
- Jiangsu Jianli Electronic Technology
- Murrelektronik
- SynQor
- Roxburgh EMC
Notable Milestones in Emi Block Filters Sector
- 2019: Launch of advanced multi-stage EMI filters by Schaffner for demanding industrial applications.
- 2020: TDK introduces compact, high-performance EMI filters for automotive electronics, supporting EV growth.
- 2021: TE Connectivity expands its portfolio with surface-mount EMI filters for miniaturized consumer electronics.
- 2022: KEMET (YAGEO Group) announces strategic acquisition to bolster its EMI filtering capabilities.
- 2023: Spectrum Control (Former APITech) unveils new EMI filters designed for aerospace and defense applications.
- 2024: Delta Electronics highlights its commitment to sustainable manufacturing of EMI filters.
- 2025 (Estimated): Introduction of next-generation EMI filters with AI-driven design optimization for enhanced performance prediction.
In-Depth Emi Block Filters Market Outlook
The future market outlook for EMI block filters is exceptionally positive, driven by sustained demand from rapidly evolving sectors like automotive electronics, consumer electronics, and aerospace. Growth accelerators, including advancements in materials science and strategic industry collaborations, will fuel innovation and market penetration. The increasing regulatory emphasis on electromagnetic compatibility worldwide will continue to mandate the adoption of effective filtering solutions. The market is expected to witness further consolidation as companies seek to expand their technological prowess and market reach. Opportunities in emerging technologies such as 5G, AI-driven systems, and advanced medical devices will provide significant avenues for growth, ensuring a dynamic and expanding market landscape for EMI block filters in the coming years, with an estimated market valuation reaching $8.5 billion by 2033.
Emi Block Filters Segmentation
-
1. Application
- 1.1. Consumer Electronics
- 1.2. Automotive Electronics
- 1.3. Aerospace
- 1.4. Military
- 1.5. Medical
- 1.6. Others
-
2. Type
- 2.1. Single Phase Type
- 2.2. Three Phase Type
- 2.3. Others
Emi Block Filters Segmentation By Geography
-
1. North America
- 1.1. United States
- 1.2. Canada
- 1.3. Mexico
-
2. South America
- 2.1. Brazil
- 2.2. Argentina
- 2.3. Rest of South America
-
3. Europe
- 3.1. United Kingdom
- 3.2. Germany
- 3.3. France
- 3.4. Italy
- 3.5. Spain
- 3.6. Russia
- 3.7. Benelux
- 3.8. Nordics
- 3.9. Rest of Europe
-
4. Middle East & Africa
- 4.1. Turkey
- 4.2. Israel
- 4.3. GCC
- 4.4. North Africa
- 4.5. South Africa
- 4.6. Rest of Middle East & Africa
-
5. Asia Pacific
- 5.1. China
- 5.2. India
- 5.3. Japan
- 5.4. South Korea
- 5.5. ASEAN
- 5.6. Oceania
- 5.7. Rest of Asia Pacific
Emi Block Filters Regional Market Share
Geographic Coverage of Emi Block Filters
Emi Block Filters REPORT HIGHLIGHTS
| Aspects | Details |
|---|---|
| Study Period | 2020-2034 |
| Base Year | 2025 |
| Estimated Year | 2026 |
| Forecast Period | 2026-2034 |
| Historical Period | 2020-2025 |
| Growth Rate | CAGR of 4.7% from 2020-2034 |
| Segmentation |
|
Table of Contents
- 1. Introduction
- 1.1. Research Scope
- 1.2. Market Segmentation
- 1.3. Research Methodology
- 1.4. Definitions and Assumptions
- 2. Executive Summary
- 2.1. Introduction
- 3. Market Dynamics
- 3.1. Introduction
- 3.2. Market Drivers
- 3.3. Market Restrains
- 3.4. Market Trends
- 4. Market Factor Analysis
- 4.1. Porters Five Forces
- 4.2. Supply/Value Chain
- 4.3. PESTEL analysis
- 4.4. Market Entropy
- 4.5. Patent/Trademark Analysis
- 5. Global Emi Block Filters Analysis, Insights and Forecast, 2020-2032
- 5.1. Market Analysis, Insights and Forecast - by Application
- 5.1.1. Consumer Electronics
- 5.1.2. Automotive Electronics
- 5.1.3. Aerospace
- 5.1.4. Military
- 5.1.5. Medical
- 5.1.6. Others
- 5.2. Market Analysis, Insights and Forecast - by Type
- 5.2.1. Single Phase Type
- 5.2.2. Three Phase Type
- 5.2.3. Others
- 5.3. Market Analysis, Insights and Forecast - by Region
- 5.3.1. North America
- 5.3.2. South America
- 5.3.3. Europe
- 5.3.4. Middle East & Africa
- 5.3.5. Asia Pacific
- 5.1. Market Analysis, Insights and Forecast - by Application
- 6. North America Emi Block Filters Analysis, Insights and Forecast, 2020-2032
- 6.1. Market Analysis, Insights and Forecast - by Application
- 6.1.1. Consumer Electronics
- 6.1.2. Automotive Electronics
- 6.1.3. Aerospace
- 6.1.4. Military
- 6.1.5. Medical
- 6.1.6. Others
- 6.2. Market Analysis, Insights and Forecast - by Type
- 6.2.1. Single Phase Type
- 6.2.2. Three Phase Type
- 6.2.3. Others
- 6.1. Market Analysis, Insights and Forecast - by Application
- 7. South America Emi Block Filters Analysis, Insights and Forecast, 2020-2032
- 7.1. Market Analysis, Insights and Forecast - by Application
- 7.1.1. Consumer Electronics
- 7.1.2. Automotive Electronics
- 7.1.3. Aerospace
- 7.1.4. Military
- 7.1.5. Medical
- 7.1.6. Others
- 7.2. Market Analysis, Insights and Forecast - by Type
- 7.2.1. Single Phase Type
- 7.2.2. Three Phase Type
- 7.2.3. Others
- 7.1. Market Analysis, Insights and Forecast - by Application
- 8. Europe Emi Block Filters Analysis, Insights and Forecast, 2020-2032
- 8.1. Market Analysis, Insights and Forecast - by Application
- 8.1.1. Consumer Electronics
- 8.1.2. Automotive Electronics
- 8.1.3. Aerospace
- 8.1.4. Military
- 8.1.5. Medical
- 8.1.6. Others
- 8.2. Market Analysis, Insights and Forecast - by Type
- 8.2.1. Single Phase Type
- 8.2.2. Three Phase Type
- 8.2.3. Others
- 8.1. Market Analysis, Insights and Forecast - by Application
- 9. Middle East & Africa Emi Block Filters Analysis, Insights and Forecast, 2020-2032
- 9.1. Market Analysis, Insights and Forecast - by Application
- 9.1.1. Consumer Electronics
- 9.1.2. Automotive Electronics
- 9.1.3. Aerospace
- 9.1.4. Military
- 9.1.5. Medical
- 9.1.6. Others
- 9.2. Market Analysis, Insights and Forecast - by Type
- 9.2.1. Single Phase Type
- 9.2.2. Three Phase Type
- 9.2.3. Others
- 9.1. Market Analysis, Insights and Forecast - by Application
- 10. Asia Pacific Emi Block Filters Analysis, Insights and Forecast, 2020-2032
- 10.1. Market Analysis, Insights and Forecast - by Application
- 10.1.1. Consumer Electronics
- 10.1.2. Automotive Electronics
- 10.1.3. Aerospace
- 10.1.4. Military
- 10.1.5. Medical
- 10.1.6. Others
- 10.2. Market Analysis, Insights and Forecast - by Type
- 10.2.1. Single Phase Type
- 10.2.2. Three Phase Type
- 10.2.3. Others
- 10.1. Market Analysis, Insights and Forecast - by Application
- 11. Competitive Analysis
- 11.1. Global Market Share Analysis 2025
- 11.2. Company Profiles
- 11.2.1 Schaffner
- 11.2.1.1. Overview
- 11.2.1.2. Products
- 11.2.1.3. SWOT Analysis
- 11.2.1.4. Recent Developments
- 11.2.1.5. Financials (Based on Availability)
- 11.2.2 TDK
- 11.2.2.1. Overview
- 11.2.2.2. Products
- 11.2.2.3. SWOT Analysis
- 11.2.2.4. Recent Developments
- 11.2.2.5. Financials (Based on Availability)
- 11.2.3 TE Connectivity
- 11.2.3.1. Overview
- 11.2.3.2. Products
- 11.2.3.3. SWOT Analysis
- 11.2.3.4. Recent Developments
- 11.2.3.5. Financials (Based on Availability)
- 11.2.4 Spectrum Control (Former APITech)
- 11.2.4.1. Overview
- 11.2.4.2. Products
- 11.2.4.3. SWOT Analysis
- 11.2.4.4. Recent Developments
- 11.2.4.5. Financials (Based on Availability)
- 11.2.5 Cosel
- 11.2.5.1. Overview
- 11.2.5.2. Products
- 11.2.5.3. SWOT Analysis
- 11.2.5.4. Recent Developments
- 11.2.5.5. Financials (Based on Availability)
- 11.2.6 Astrodyne TDI
- 11.2.6.1. Overview
- 11.2.6.2. Products
- 11.2.6.3. SWOT Analysis
- 11.2.6.4. Recent Developments
- 11.2.6.5. Financials (Based on Availability)
- 11.2.7 Delta Electronics
- 11.2.7.1. Overview
- 11.2.7.2. Products
- 11.2.7.3. SWOT Analysis
- 11.2.7.4. Recent Developments
- 11.2.7.5. Financials (Based on Availability)
- 11.2.8 KEMET (YAGEO Group)
- 11.2.8.1. Overview
- 11.2.8.2. Products
- 11.2.8.3. SWOT Analysis
- 11.2.8.4. Recent Developments
- 11.2.8.5. Financials (Based on Availability)
- 11.2.9 Schurter
- 11.2.9.1. Overview
- 11.2.9.2. Products
- 11.2.9.3. SWOT Analysis
- 11.2.9.4. Recent Developments
- 11.2.9.5. Financials (Based on Availability)
- 11.2.10 Crane Aerospace & Electronics
- 11.2.10.1. Overview
- 11.2.10.2. Products
- 11.2.10.3. SWOT Analysis
- 11.2.10.4. Recent Developments
- 11.2.10.5. Financials (Based on Availability)
- 11.2.11 Soshin electric
- 11.2.11.1. Overview
- 11.2.11.2. Products
- 11.2.11.3. SWOT Analysis
- 11.2.11.4. Recent Developments
- 11.2.11.5. Financials (Based on Availability)
- 11.2.12 BLOCK
- 11.2.12.1. Overview
- 11.2.12.2. Products
- 11.2.12.3. SWOT Analysis
- 11.2.12.4. Recent Developments
- 11.2.12.5. Financials (Based on Availability)
- 11.2.13 Ohmite Manufacturing
- 11.2.13.1. Overview
- 11.2.13.2. Products
- 11.2.13.3. SWOT Analysis
- 11.2.13.4. Recent Developments
- 11.2.13.5. Financials (Based on Availability)
- 11.2.14 Exxelia
- 11.2.14.1. Overview
- 11.2.14.2. Products
- 11.2.14.3. SWOT Analysis
- 11.2.14.4. Recent Developments
- 11.2.14.5. Financials (Based on Availability)
- 11.2.15 AERODEV Electromagnetic Tech
- 11.2.15.1. Overview
- 11.2.15.2. Products
- 11.2.15.3. SWOT Analysis
- 11.2.15.4. Recent Developments
- 11.2.15.5. Financials (Based on Availability)
- 11.2.16 Captor Corporation
- 11.2.16.1. Overview
- 11.2.16.2. Products
- 11.2.16.3. SWOT Analysis
- 11.2.16.4. Recent Developments
- 11.2.16.5. Financials (Based on Availability)
- 11.2.17 MORNSUN
- 11.2.17.1. Overview
- 11.2.17.2. Products
- 11.2.17.3. SWOT Analysis
- 11.2.17.4. Recent Developments
- 11.2.17.5. Financials (Based on Availability)
- 11.2.18 Jiangsu WEMC Electronic Technology
- 11.2.18.1. Overview
- 11.2.18.2. Products
- 11.2.18.3. SWOT Analysis
- 11.2.18.4. Recent Developments
- 11.2.18.5. Financials (Based on Availability)
- 11.2.19 Enerdoor
- 11.2.19.1. Overview
- 11.2.19.2. Products
- 11.2.19.3. SWOT Analysis
- 11.2.19.4. Recent Developments
- 11.2.19.5. Financials (Based on Availability)
- 11.2.20 Jones Tech
- 11.2.20.1. Overview
- 11.2.20.2. Products
- 11.2.20.3. SWOT Analysis
- 11.2.20.4. Recent Developments
- 11.2.20.5. Financials (Based on Availability)
- 11.2.21 Jiangsu Jianli Electronic Technology
- 11.2.21.1. Overview
- 11.2.21.2. Products
- 11.2.21.3. SWOT Analysis
- 11.2.21.4. Recent Developments
- 11.2.21.5. Financials (Based on Availability)
- 11.2.22 Murrelektronik
- 11.2.22.1. Overview
- 11.2.22.2. Products
- 11.2.22.3. SWOT Analysis
- 11.2.22.4. Recent Developments
- 11.2.22.5. Financials (Based on Availability)
- 11.2.23 SynQor
- 11.2.23.1. Overview
- 11.2.23.2. Products
- 11.2.23.3. SWOT Analysis
- 11.2.23.4. Recent Developments
- 11.2.23.5. Financials (Based on Availability)
- 11.2.24 Roxburgh EMC
- 11.2.24.1. Overview
- 11.2.24.2. Products
- 11.2.24.3. SWOT Analysis
- 11.2.24.4. Recent Developments
- 11.2.24.5. Financials (Based on Availability)
- 11.2.1 Schaffner
List of Figures
- Figure 1: Global Emi Block Filters Revenue Breakdown (undefined, %) by Region 2025 & 2033
- Figure 2: Global Emi Block Filters Volume Breakdown (K, %) by Region 2025 & 2033
- Figure 3: North America Emi Block Filters Revenue (undefined), by Application 2025 & 2033
- Figure 4: North America Emi Block Filters Volume (K), by Application 2025 & 2033
- Figure 5: North America Emi Block Filters Revenue Share (%), by Application 2025 & 2033
- Figure 6: North America Emi Block Filters Volume Share (%), by Application 2025 & 2033
- Figure 7: North America Emi Block Filters Revenue (undefined), by Type 2025 & 2033
- Figure 8: North America Emi Block Filters Volume (K), by Type 2025 & 2033
- Figure 9: North America Emi Block Filters Revenue Share (%), by Type 2025 & 2033
- Figure 10: North America Emi Block Filters Volume Share (%), by Type 2025 & 2033
- Figure 11: North America Emi Block Filters Revenue (undefined), by Country 2025 & 2033
- Figure 12: North America Emi Block Filters Volume (K), by Country 2025 & 2033
- Figure 13: North America Emi Block Filters Revenue Share (%), by Country 2025 & 2033
- Figure 14: North America Emi Block Filters Volume Share (%), by Country 2025 & 2033
- Figure 15: South America Emi Block Filters Revenue (undefined), by Application 2025 & 2033
- Figure 16: South America Emi Block Filters Volume (K), by Application 2025 & 2033
- Figure 17: South America Emi Block Filters Revenue Share (%), by Application 2025 & 2033
- Figure 18: South America Emi Block Filters Volume Share (%), by Application 2025 & 2033
- Figure 19: South America Emi Block Filters Revenue (undefined), by Type 2025 & 2033
- Figure 20: South America Emi Block Filters Volume (K), by Type 2025 & 2033
- Figure 21: South America Emi Block Filters Revenue Share (%), by Type 2025 & 2033
- Figure 22: South America Emi Block Filters Volume Share (%), by Type 2025 & 2033
- Figure 23: South America Emi Block Filters Revenue (undefined), by Country 2025 & 2033
- Figure 24: South America Emi Block Filters Volume (K), by Country 2025 & 2033
- Figure 25: South America Emi Block Filters Revenue Share (%), by Country 2025 & 2033
- Figure 26: South America Emi Block Filters Volume Share (%), by Country 2025 & 2033
- Figure 27: Europe Emi Block Filters Revenue (undefined), by Application 2025 & 2033
- Figure 28: Europe Emi Block Filters Volume (K), by Application 2025 & 2033
- Figure 29: Europe Emi Block Filters Revenue Share (%), by Application 2025 & 2033
- Figure 30: Europe Emi Block Filters Volume Share (%), by Application 2025 & 2033
- Figure 31: Europe Emi Block Filters Revenue (undefined), by Type 2025 & 2033
- Figure 32: Europe Emi Block Filters Volume (K), by Type 2025 & 2033
- Figure 33: Europe Emi Block Filters Revenue Share (%), by Type 2025 & 2033
- Figure 34: Europe Emi Block Filters Volume Share (%), by Type 2025 & 2033
- Figure 35: Europe Emi Block Filters Revenue (undefined), by Country 2025 & 2033
- Figure 36: Europe Emi Block Filters Volume (K), by Country 2025 & 2033
- Figure 37: Europe Emi Block Filters Revenue Share (%), by Country 2025 & 2033
- Figure 38: Europe Emi Block Filters Volume Share (%), by Country 2025 & 2033
- Figure 39: Middle East & Africa Emi Block Filters Revenue (undefined), by Application 2025 & 2033
- Figure 40: Middle East & Africa Emi Block Filters Volume (K), by Application 2025 & 2033
- Figure 41: Middle East & Africa Emi Block Filters Revenue Share (%), by Application 2025 & 2033
- Figure 42: Middle East & Africa Emi Block Filters Volume Share (%), by Application 2025 & 2033
- Figure 43: Middle East & Africa Emi Block Filters Revenue (undefined), by Type 2025 & 2033
- Figure 44: Middle East & Africa Emi Block Filters Volume (K), by Type 2025 & 2033
- Figure 45: Middle East & Africa Emi Block Filters Revenue Share (%), by Type 2025 & 2033
- Figure 46: Middle East & Africa Emi Block Filters Volume Share (%), by Type 2025 & 2033
- Figure 47: Middle East & Africa Emi Block Filters Revenue (undefined), by Country 2025 & 2033
- Figure 48: Middle East & Africa Emi Block Filters Volume (K), by Country 2025 & 2033
- Figure 49: Middle East & Africa Emi Block Filters Revenue Share (%), by Country 2025 & 2033
- Figure 50: Middle East & Africa Emi Block Filters Volume Share (%), by Country 2025 & 2033
- Figure 51: Asia Pacific Emi Block Filters Revenue (undefined), by Application 2025 & 2033
- Figure 52: Asia Pacific Emi Block Filters Volume (K), by Application 2025 & 2033
- Figure 53: Asia Pacific Emi Block Filters Revenue Share (%), by Application 2025 & 2033
- Figure 54: Asia Pacific Emi Block Filters Volume Share (%), by Application 2025 & 2033
- Figure 55: Asia Pacific Emi Block Filters Revenue (undefined), by Type 2025 & 2033
- Figure 56: Asia Pacific Emi Block Filters Volume (K), by Type 2025 & 2033
- Figure 57: Asia Pacific Emi Block Filters Revenue Share (%), by Type 2025 & 2033
- Figure 58: Asia Pacific Emi Block Filters Volume Share (%), by Type 2025 & 2033
- Figure 59: Asia Pacific Emi Block Filters Revenue (undefined), by Country 2025 & 2033
- Figure 60: Asia Pacific Emi Block Filters Volume (K), by Country 2025 & 2033
- Figure 61: Asia Pacific Emi Block Filters Revenue Share (%), by Country 2025 & 2033
- Figure 62: Asia Pacific Emi Block Filters Volume Share (%), by Country 2025 & 2033
List of Tables
- Table 1: Global Emi Block Filters Revenue undefined Forecast, by Application 2020 & 2033
- Table 2: Global Emi Block Filters Volume K Forecast, by Application 2020 & 2033
- Table 3: Global Emi Block Filters Revenue undefined Forecast, by Type 2020 & 2033
- Table 4: Global Emi Block Filters Volume K Forecast, by Type 2020 & 2033
- Table 5: Global Emi Block Filters Revenue undefined Forecast, by Region 2020 & 2033
- Table 6: Global Emi Block Filters Volume K Forecast, by Region 2020 & 2033
- Table 7: Global Emi Block Filters Revenue undefined Forecast, by Application 2020 & 2033
- Table 8: Global Emi Block Filters Volume K Forecast, by Application 2020 & 2033
- Table 9: Global Emi Block Filters Revenue undefined Forecast, by Type 2020 & 2033
- Table 10: Global Emi Block Filters Volume K Forecast, by Type 2020 & 2033
- Table 11: Global Emi Block Filters Revenue undefined Forecast, by Country 2020 & 2033
- Table 12: Global Emi Block Filters Volume K Forecast, by Country 2020 & 2033
- Table 13: United States Emi Block Filters Revenue (undefined) Forecast, by Application 2020 & 2033
- Table 14: United States Emi Block Filters Volume (K) Forecast, by Application 2020 & 2033
- Table 15: Canada Emi Block Filters Revenue (undefined) Forecast, by Application 2020 & 2033
- Table 16: Canada Emi Block Filters Volume (K) Forecast, by Application 2020 & 2033
- Table 17: Mexico Emi Block Filters Revenue (undefined) Forecast, by Application 2020 & 2033
- Table 18: Mexico Emi Block Filters Volume (K) Forecast, by Application 2020 & 2033
- Table 19: Global Emi Block Filters Revenue undefined Forecast, by Application 2020 & 2033
- Table 20: Global Emi Block Filters Volume K Forecast, by Application 2020 & 2033
- Table 21: Global Emi Block Filters Revenue undefined Forecast, by Type 2020 & 2033
- Table 22: Global Emi Block Filters Volume K Forecast, by Type 2020 & 2033
- Table 23: Global Emi Block Filters Revenue undefined Forecast, by Country 2020 & 2033
- Table 24: Global Emi Block Filters Volume K Forecast, by Country 2020 & 2033
- Table 25: Brazil Emi Block Filters Revenue (undefined) Forecast, by Application 2020 & 2033
- Table 26: Brazil Emi Block Filters Volume (K) Forecast, by Application 2020 & 2033
- Table 27: Argentina Emi Block Filters Revenue (undefined) Forecast, by Application 2020 & 2033
- Table 28: Argentina Emi Block Filters Volume (K) Forecast, by Application 2020 & 2033
- Table 29: Rest of South America Emi Block Filters Revenue (undefined) Forecast, by Application 2020 & 2033
- Table 30: Rest of South America Emi Block Filters Volume (K) Forecast, by Application 2020 & 2033
- Table 31: Global Emi Block Filters Revenue undefined Forecast, by Application 2020 & 2033
- Table 32: Global Emi Block Filters Volume K Forecast, by Application 2020 & 2033
- Table 33: Global Emi Block Filters Revenue undefined Forecast, by Type 2020 & 2033
- Table 34: Global Emi Block Filters Volume K Forecast, by Type 2020 & 2033
- Table 35: Global Emi Block Filters Revenue undefined Forecast, by Country 2020 & 2033
- Table 36: Global Emi Block Filters Volume K Forecast, by Country 2020 & 2033
- Table 37: United Kingdom Emi Block Filters Revenue (undefined) Forecast, by Application 2020 & 2033
- Table 38: United Kingdom Emi Block Filters Volume (K) Forecast, by Application 2020 & 2033
- Table 39: Germany Emi Block Filters Revenue (undefined) Forecast, by Application 2020 & 2033
- Table 40: Germany Emi Block Filters Volume (K) Forecast, by Application 2020 & 2033
- Table 41: France Emi Block Filters Revenue (undefined) Forecast, by Application 2020 & 2033
- Table 42: France Emi Block Filters Volume (K) Forecast, by Application 2020 & 2033
- Table 43: Italy Emi Block Filters Revenue (undefined) Forecast, by Application 2020 & 2033
- Table 44: Italy Emi Block Filters Volume (K) Forecast, by Application 2020 & 2033
- Table 45: Spain Emi Block Filters Revenue (undefined) Forecast, by Application 2020 & 2033
- Table 46: Spain Emi Block Filters Volume (K) Forecast, by Application 2020 & 2033
- Table 47: Russia Emi Block Filters Revenue (undefined) Forecast, by Application 2020 & 2033
- Table 48: Russia Emi Block Filters Volume (K) Forecast, by Application 2020 & 2033
- Table 49: Benelux Emi Block Filters Revenue (undefined) Forecast, by Application 2020 & 2033
- Table 50: Benelux Emi Block Filters Volume (K) Forecast, by Application 2020 & 2033
- Table 51: Nordics Emi Block Filters Revenue (undefined) Forecast, by Application 2020 & 2033
- Table 52: Nordics Emi Block Filters Volume (K) Forecast, by Application 2020 & 2033
- Table 53: Rest of Europe Emi Block Filters Revenue (undefined) Forecast, by Application 2020 & 2033
- Table 54: Rest of Europe Emi Block Filters Volume (K) Forecast, by Application 2020 & 2033
- Table 55: Global Emi Block Filters Revenue undefined Forecast, by Application 2020 & 2033
- Table 56: Global Emi Block Filters Volume K Forecast, by Application 2020 & 2033
- Table 57: Global Emi Block Filters Revenue undefined Forecast, by Type 2020 & 2033
- Table 58: Global Emi Block Filters Volume K Forecast, by Type 2020 & 2033
- Table 59: Global Emi Block Filters Revenue undefined Forecast, by Country 2020 & 2033
- Table 60: Global Emi Block Filters Volume K Forecast, by Country 2020 & 2033
- Table 61: Turkey Emi Block Filters Revenue (undefined) Forecast, by Application 2020 & 2033
- Table 62: Turkey Emi Block Filters Volume (K) Forecast, by Application 2020 & 2033
- Table 63: Israel Emi Block Filters Revenue (undefined) Forecast, by Application 2020 & 2033
- Table 64: Israel Emi Block Filters Volume (K) Forecast, by Application 2020 & 2033
- Table 65: GCC Emi Block Filters Revenue (undefined) Forecast, by Application 2020 & 2033
- Table 66: GCC Emi Block Filters Volume (K) Forecast, by Application 2020 & 2033
- Table 67: North Africa Emi Block Filters Revenue (undefined) Forecast, by Application 2020 & 2033
- Table 68: North Africa Emi Block Filters Volume (K) Forecast, by Application 2020 & 2033
- Table 69: South Africa Emi Block Filters Revenue (undefined) Forecast, by Application 2020 & 2033
- Table 70: South Africa Emi Block Filters Volume (K) Forecast, by Application 2020 & 2033
- Table 71: Rest of Middle East & Africa Emi Block Filters Revenue (undefined) Forecast, by Application 2020 & 2033
- Table 72: Rest of Middle East & Africa Emi Block Filters Volume (K) Forecast, by Application 2020 & 2033
- Table 73: Global Emi Block Filters Revenue undefined Forecast, by Application 2020 & 2033
- Table 74: Global Emi Block Filters Volume K Forecast, by Application 2020 & 2033
- Table 75: Global Emi Block Filters Revenue undefined Forecast, by Type 2020 & 2033
- Table 76: Global Emi Block Filters Volume K Forecast, by Type 2020 & 2033
- Table 77: Global Emi Block Filters Revenue undefined Forecast, by Country 2020 & 2033
- Table 78: Global Emi Block Filters Volume K Forecast, by Country 2020 & 2033
- Table 79: China Emi Block Filters Revenue (undefined) Forecast, by Application 2020 & 2033
- Table 80: China Emi Block Filters Volume (K) Forecast, by Application 2020 & 2033
- Table 81: India Emi Block Filters Revenue (undefined) Forecast, by Application 2020 & 2033
- Table 82: India Emi Block Filters Volume (K) Forecast, by Application 2020 & 2033
- Table 83: Japan Emi Block Filters Revenue (undefined) Forecast, by Application 2020 & 2033
- Table 84: Japan Emi Block Filters Volume (K) Forecast, by Application 2020 & 2033
- Table 85: South Korea Emi Block Filters Revenue (undefined) Forecast, by Application 2020 & 2033
- Table 86: South Korea Emi Block Filters Volume (K) Forecast, by Application 2020 & 2033
- Table 87: ASEAN Emi Block Filters Revenue (undefined) Forecast, by Application 2020 & 2033
- Table 88: ASEAN Emi Block Filters Volume (K) Forecast, by Application 2020 & 2033
- Table 89: Oceania Emi Block Filters Revenue (undefined) Forecast, by Application 2020 & 2033
- Table 90: Oceania Emi Block Filters Volume (K) Forecast, by Application 2020 & 2033
- Table 91: Rest of Asia Pacific Emi Block Filters Revenue (undefined) Forecast, by Application 2020 & 2033
- Table 92: Rest of Asia Pacific Emi Block Filters Volume (K) Forecast, by Application 2020 & 2033
Frequently Asked Questions
1. What is the projected Compound Annual Growth Rate (CAGR) of the Emi Block Filters?
The projected CAGR is approximately 4.7%.
2. Which companies are prominent players in the Emi Block Filters?
Key companies in the market include Schaffner, TDK, TE Connectivity, Spectrum Control (Former APITech), Cosel, Astrodyne TDI, Delta Electronics, KEMET (YAGEO Group), Schurter, Crane Aerospace & Electronics, Soshin electric, BLOCK, Ohmite Manufacturing, Exxelia, AERODEV Electromagnetic Tech, Captor Corporation, MORNSUN, Jiangsu WEMC Electronic Technology, Enerdoor, Jones Tech, Jiangsu Jianli Electronic Technology, Murrelektronik, SynQor, Roxburgh EMC.
3. What are the main segments of the Emi Block Filters?
The market segments include Application, Type.
4. Can you provide details about the market size?
The market size is estimated to be USD XXX N/A as of 2022.
5. What are some drivers contributing to market growth?
N/A
6. What are the notable trends driving market growth?
N/A
7. Are there any restraints impacting market growth?
N/A
8. Can you provide examples of recent developments in the market?
N/A
9. What pricing options are available for accessing the report?
Pricing options include single-user, multi-user, and enterprise licenses priced at USD 3950.00, USD 5925.00, and USD 7900.00 respectively.
10. Is the market size provided in terms of value or volume?
The market size is provided in terms of value, measured in N/A and volume, measured in K.
11. Are there any specific market keywords associated with the report?
Yes, the market keyword associated with the report is "Emi Block Filters," which aids in identifying and referencing the specific market segment covered.
12. How do I determine which pricing option suits my needs best?
The pricing options vary based on user requirements and access needs. Individual users may opt for single-user licenses, while businesses requiring broader access may choose multi-user or enterprise licenses for cost-effective access to the report.
13. Are there any additional resources or data provided in the Emi Block Filters report?
While the report offers comprehensive insights, it's advisable to review the specific contents or supplementary materials provided to ascertain if additional resources or data are available.
14. How can I stay updated on further developments or reports in the Emi Block Filters?
To stay informed about further developments, trends, and reports in the Emi Block Filters, consider subscribing to industry newsletters, following relevant companies and organizations, or regularly checking reputable industry news sources and publications.
Methodology
Step 1 - Identification of Relevant Samples Size from Population Database


Step 2 - Approaches for Defining Global Market Size (Value, Volume* & Price*)

Note*: In applicable scenarios
Step 3 - Data Sources
Primary Research
- Web Analytics
- Survey Reports
- Research Institute
- Latest Research Reports
- Opinion Leaders
Secondary Research
- Annual Reports
- White Paper
- Latest Press Release
- Industry Association
- Paid Database
- Investor Presentations

Step 4 - Data Triangulation
Involves using different sources of information in order to increase the validity of a study
These sources are likely to be stakeholders in a program - participants, other researchers, program staff, other community members, and so on.
Then we put all data in single framework & apply various statistical tools to find out the dynamic on the market.
During the analysis stage, feedback from the stakeholder groups would be compared to determine areas of agreement as well as areas of divergence