

Key Insights
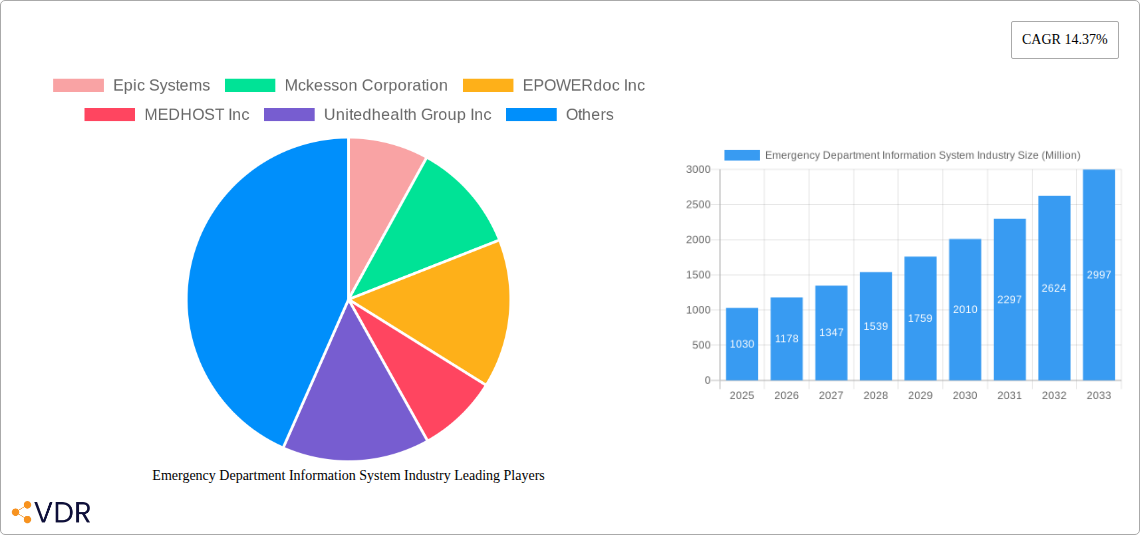
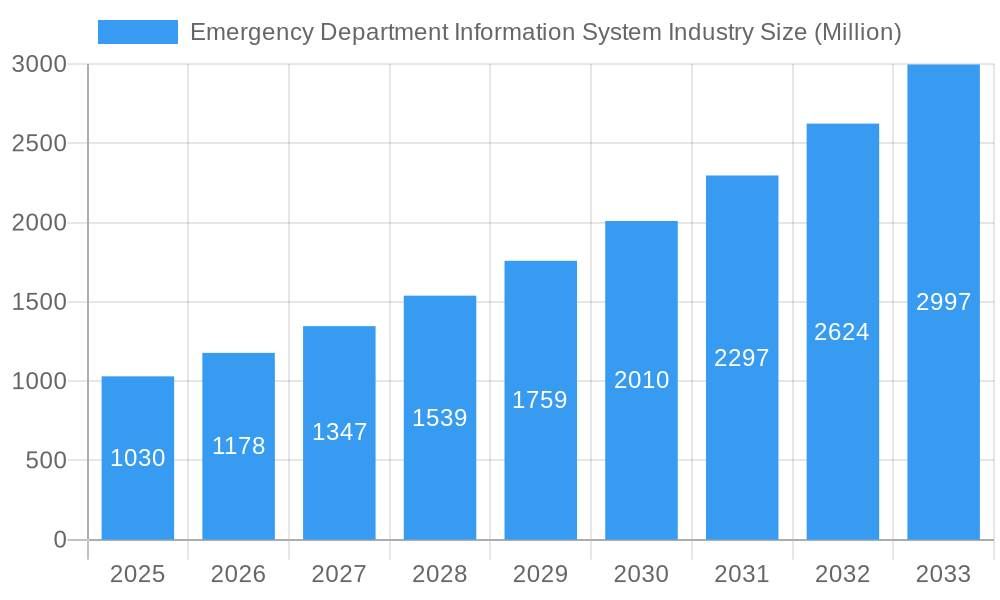
The global Emergency Department Information System (EDIS) market is experiencing robust expansion, projected to reach a significant $1.03 billion by 2025. This growth is propelled by a compelling compound annual growth rate (CAGR) of 14.37% during the forecast period of 2025-2033. The increasing adoption of advanced healthcare IT solutions, driven by the need for enhanced patient care, operational efficiency, and regulatory compliance within emergency departments, underpins this upward trajectory. Key drivers include the surging demand for digital transformation in healthcare, the imperative to reduce medical errors, and the growing complexity of patient management in time-sensitive environments. Furthermore, government initiatives promoting health IT adoption and the increasing prevalence of chronic diseases are contributing to the sustained market momentum. The market is segmented across various applications, including Computerized Physician Order Entry (CPOE), Clinical Documentation, Patient Tracking & Triage, and E-Prescribing, with CPOE and Clinical Documentation expected to lead adoption due to their direct impact on patient safety and workflow optimization.
Emergency Department Information System Industry Market Size (In Billion)
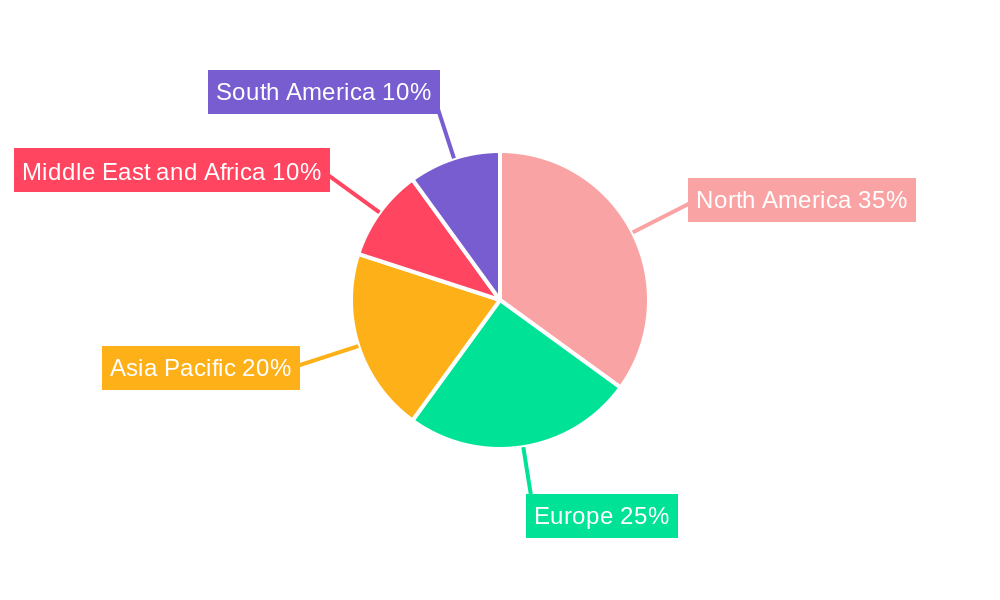
The EDIS market is witnessing a dynamic shift in deployment models, with Software-as-a-Service (SaaS) gaining substantial traction over traditional On-Premise solutions, offering greater scalability, flexibility, and cost-effectiveness. This trend is particularly evident among small and medium-sized hospitals seeking to leverage advanced functionalities without significant upfront infrastructure investments. Enterprise solutions and Best-of-Breed (B.O.B.) solutions cater to diverse needs, with B.O.B. solutions offering specialized functionalities that can be integrated into existing systems. Geographically, North America, led by the United States, is anticipated to maintain its dominant market share, fueled by high healthcare spending and early adoption of advanced technologies. However, the Asia Pacific region is poised for significant growth, driven by increasing healthcare investments, a rising patient population, and the expanding presence of key market players. Restraints such as the high cost of initial implementation for some solutions and concerns regarding data security and interoperability are being addressed through ongoing technological advancements and evolving regulatory frameworks.
Emergency Department Information System Industry Company Market Share
This comprehensive report provides an in-depth analysis of the global Emergency Department Information System (EDIS) industry, offering critical insights into market dynamics, growth trends, competitive landscape, and future projections. With the increasing strain on emergency departments and the paramount importance of efficient patient care, EDIS solutions are becoming indispensable. This report, covering the study period from 2019 to 2033, with a base year of 2025, delves into parent and child market segments, leveraging high-traffic keywords to ensure maximum visibility for industry professionals. All quantitative values are presented in Million units, with predicted values used where specific data is unavailable.
Emergency Department Information System Industry Market Dynamics & Structure
The Emergency Department Information System (EDIS) market exhibits a moderately concentrated structure, characterized by the presence of established giants and a growing number of specialized vendors. Technological innovation is a primary driver, with advancements in artificial intelligence (AI), cloud computing, and interoperability solutions significantly shaping product offerings. Regulatory frameworks, particularly those related to patient data privacy (e.g., HIPAA) and electronic health records (EHR) mandates, play a crucial role in dictating system development and adoption. Competitive product substitutes are primarily legacy systems and less integrated EHR modules that may not offer the specialized functionalities of a dedicated EDIS. End-user demographics are diverse, ranging from small community hospitals to large academic medical centers, each with unique requirements and budgets. Mergers and acquisitions (M&A) are active, with larger players acquiring innovative startups to expand their portfolios and market reach.
- Market Concentration: Dominated by key players with significant market share, but with room for niche providers.
- Technological Innovation: Driven by AI for predictive analytics and workflow optimization, cloud adoption for scalability, and interoperability for seamless data exchange.
- Regulatory Landscape: Compliance with data security (e.g., HIPAA), interoperability standards, and government incentives for EHR adoption are critical.
- Competitive Landscape: Intense competition from integrated EHR vendors and specialized EDIS providers.
- End-User Needs: Tailored solutions required for different hospital sizes and complexities of emergency care.
- M&A Activity: Strategic acquisitions to enhance technological capabilities and expand market penetration.
Emergency Department Information System Industry Growth Trends & Insights
The Emergency Department Information System (EDIS) industry is poised for significant growth, driven by an escalating demand for enhanced efficiency, improved patient outcomes, and reduced operational costs within emergency departments. The market size is projected to expand robustly over the forecast period, fueled by increasing adoption rates of advanced EDIS solutions across healthcare facilities of all sizes. Technological disruptions, such as the integration of AI-powered triage and decision support tools, are revolutionizing emergency care delivery, enabling faster diagnoses and more accurate treatment plans. Consumer behavior shifts are also contributing, with patients expecting more streamlined and transparent healthcare experiences, which EDIS can facilitate through improved communication and tracking. The market is projected to witness a Compound Annual Growth Rate (CAGR) of approximately 9.5% from 2025 to 2033, reaching an estimated market size of $12,500 million by 2033. Market penetration is expected to rise from 60% in 2025 to over 85% by 2033.
The increasing volume of emergency visits globally, coupled with the growing complexity of patient conditions, necessitates sophisticated information management systems. EDIS solutions address these challenges by providing real-time patient tracking, facilitating efficient clinical documentation, and enabling faster communication among care teams. The push towards value-based care models further incentivizes hospitals to invest in technologies that can demonstrate improved patient outcomes and reduced readmission rates, areas where robust EDIS plays a pivotal role. Furthermore, the ongoing digital transformation within the healthcare sector, supported by government initiatives promoting health IT adoption, is creating a favorable environment for EDIS market expansion. The shift towards Software-as-a-Service (SaaS) models is lowering the barrier to entry for smaller healthcare providers, accelerating adoption and contributing to market growth. The integration of remote patient monitoring data and telemedicine capabilities into EDIS platforms is also emerging as a key growth catalyst, expanding the scope of emergency care beyond traditional hospital settings.
Dominant Regions, Countries, or Segments in Emergency Department Information System Industry
North America currently dominates the Emergency Department Information System (EDIS) market, driven by a well-established healthcare infrastructure, high adoption rates of advanced technologies, and significant investments in healthcare IT. The region's advanced regulatory environment, coupled with a strong emphasis on patient safety and efficiency, has propelled the widespread implementation of sophisticated EDIS solutions. Within North America, the United States represents the largest market segment, accounting for an estimated 70% of regional revenue. This dominance is attributed to the presence of major healthcare systems, a high volume of emergency department visits, and a robust ecosystem of EDIS vendors.
- Dominant Region: North America, with the United States as the leading country.
- Key Market Drivers in North America:
- High per capita healthcare spending.
- Government incentives for EHR adoption and interoperability.
- Strong presence of major EDIS vendors.
- Aging population and increasing prevalence of chronic diseases, leading to higher ED utilization.
- Emphasis on patient safety and quality improvement initiatives.
- Dominant Application Segment: Computerized Physician Order Entry (CPOE) and Clinical Documentation are leading application segments, representing approximately 35% and 30% of the market, respectively. CPOE streamlines the ordering process for medications, lab tests, and imaging, reducing errors and improving turnaround times. Comprehensive clinical documentation ensures accurate patient records and facilitates seamless communication among care providers.
- Dominant Deployment Model: Software-as-a-Service (SaaS) is rapidly gaining traction, accounting for an estimated 65% of the market in 2025 and projected to grow significantly. The scalability, cost-effectiveness, and ease of implementation associated with SaaS models make them highly attractive to healthcare providers.
- Dominant Software Type: Enterprise Solutions hold the largest market share, approximately 75%, due to their comprehensive functionalities designed to integrate with existing hospital IT infrastructure and cater to the complex needs of larger healthcare organizations.
- Dominant End User Segment: Large Hospitals are the primary consumers of EDIS solutions, constituting around 55% of the market share. These institutions typically have higher patient volumes, more complex workflows, and greater financial resources to invest in advanced EDIS technologies.
Emergency Department Information System Industry Product Landscape
The EDIS product landscape is characterized by innovative solutions focused on enhancing clinical workflow efficiency, improving patient safety, and enabling data-driven decision-making. Key product features include advanced patient tracking and triage systems, real-time dashboards for monitoring patient flow, integrated CPOE functionalities, and robust clinical documentation tools. AI-powered predictive analytics for patient acuity and resource allocation are emerging as significant differentiators. The performance of these systems is measured by their ability to reduce patient wait times, minimize medical errors, and improve overall throughput within the emergency department. Unique selling propositions often revolve around seamless integration with existing EHR systems, user-friendly interfaces, and the provision of actionable insights from real-time data.
Key Drivers, Barriers & Challenges in Emergency Department Information System Industry
The Emergency Department Information System (EDIS) market is propelled by several key drivers. The increasing volume of emergency visits globally, coupled with the need for improved patient safety and reduced medical errors, is a primary growth catalyst. Advancements in technology, such as AI and cloud computing, enable more efficient data management and clinical decision support. Government initiatives promoting digital health adoption and interoperability also foster market growth.
- Key Drivers:
- Rising emergency department patient volumes.
- Emphasis on patient safety and error reduction.
- Technological advancements (AI, cloud).
- Government mandates and incentives for health IT.
- Need for improved operational efficiency and cost reduction.
However, the market also faces significant barriers and challenges. High initial implementation costs and the complexity of integrating EDIS with existing hospital IT infrastructure can be prohibitive, especially for smaller facilities. Resistance to change among healthcare professionals and the need for extensive training can also slow adoption. Stringent data privacy regulations and cybersecurity concerns are critical hurdles that require continuous attention and investment. Furthermore, the market grapples with issues of interoperability between different healthcare systems, hindering seamless data exchange.
- Barriers & Challenges:
- High implementation and maintenance costs.
- Integration complexities with legacy systems.
- Resistance to change and user adoption challenges.
- Data privacy concerns and cybersecurity threats.
- Interoperability issues between disparate healthcare IT systems.
- Availability of skilled IT personnel for implementation and support.
Emerging Opportunities in Emergency Department Information System Industry
Emerging opportunities in the EDIS sector lie in the integration of advanced AI and machine learning capabilities for predictive analytics, such as forecasting patient influx and identifying high-risk patients for early intervention. The expansion of cloud-based EDIS solutions offers a significant opportunity to cater to smaller hospitals and clinics with limited IT resources. Furthermore, the increasing adoption of telemedicine and remote patient monitoring presents a fertile ground for EDIS to evolve into comprehensive virtual emergency care platforms. Opportunities also exist in developing specialized EDIS modules for specific conditions or patient populations, enhancing the precision of care delivery.
Growth Accelerators in the Emergency Department Information System Industry Industry
Long-term growth in the Emergency Department Information System (EDIS) industry will be significantly accelerated by continued technological breakthroughs, particularly in the realm of artificial intelligence and data analytics. The development of more sophisticated AI algorithms for real-time diagnosis assistance, personalized treatment recommendations, and operational optimization will drive adoption. Strategic partnerships between EDIS vendors and other healthcare technology providers, such as those offering remote patient monitoring devices or specialized imaging solutions, will foster innovation and create integrated ecosystems. Market expansion strategies targeting emerging economies with growing healthcare infrastructures and increasing healthcare expenditure will also be crucial for sustained growth.
Key Players Shaping the Emergency Department Information System Industry Market
- Epic Systems
- Mckesson Corporation
- EPOWERdoc Inc
- MEDHOST Inc
- Unitedhealth Group Inc
- Cerner Corporation
- Medical Information Technology Inc
- Logibec Canada
- Allscripts Healthcare Solutions Inc
- T-Systems Inc
- Evident
- Medsphere Systems Corporation
Notable Milestones in Emergency Department Information System Industry Sector
- March 2022: HeartBeam, Inc. signed a Business Associate Agreement (BAA) and a Clinical Trial Agreement (CTA) with Phoebe Putney Health System to conduct a pilot study designed to evaluate HeartBeam's Emergency Department (ED) Myocardial Infarction (MI) software product, signaling advancements in AI-driven cardiac diagnostics for emergency settings.
- January 2022: Aidoc signed a partnership with Novant Health. By incorporating Aidoc's AI platform, which includes seven FDA-cleared solutions for triage and notification of patients with acute medical conditions, Novant Health is taking proactive steps to improve patient outcomes and reduce emergency department (ED) length of stay amid resource constraints inflicted by the Omicron variant, highlighting the impact of AI in enhancing ED efficiency and patient care during critical periods.
In-Depth Emergency Department Information System Industry Market Outlook
The future outlook for the Emergency Department Information System (EDIS) market is exceptionally bright, driven by an unwavering demand for enhanced patient care, operational efficiency, and cost containment in emergency settings. Growth accelerators will continue to be fueled by relentless technological innovation, particularly in AI-driven predictive analytics and automation, which promise to revolutionize patient triage, resource allocation, and clinical decision-making. Strategic collaborations and market expansion initiatives, especially into underserved regions, will further bolster market penetration. The increasing focus on interoperability and data-driven healthcare will solidify EDIS as an indispensable component of modern healthcare delivery, paving the way for significant future market potential and strategic opportunities for stakeholders.
Emergency Department Information System Industry Segmentation
-
1. Application
- 1.1. Computerized Physician Order Entry (CPOE)
- 1.2. Clinical Documentation
- 1.3. Patient Tracking & Triage
- 1.4. E-Prescribing
- 1.5. Others
-
2. Deployment
- 2.1. On-Premise EDIS
- 2.2. Software-As-A-Services (SaaS)
-
3. Software Type
- 3.1. Enterprise Solutions
- 3.2. Best of Breed (B.O.B.) Solutions
-
4. End User
- 4.1. Small Hospitals
- 4.2. Medium-Sized Hospitals
- 4.3. Large Hospitals
Emergency Department Information System Industry Segmentation By Geography
-
1. North America
- 1.1. United States
- 1.2. Canada
- 1.3. Mexico
-
2. Europe
- 2.1. Germany
- 2.2. United Kingdom
- 2.3. France
- 2.4. Italy
- 2.5. Spain
- 2.6. Rest of Europe
-
3. Asia Pacific
- 3.1. China
- 3.2. Japan
- 3.3. India
- 3.4. Australia
- 3.5. South Korea
- 3.6. Rest of Asia Pacific
-
4. Middle East and Africa
- 4.1. GCC
- 4.2. South Africa
- 4.3. Rest of Middle East and Africa
-
5. South America
- 5.1. Brazil
- 5.2. Argentina
- 5.3. Rest of South America
Emergency Department Information System Industry Regional Market Share
Geographic Coverage of Emergency Department Information System Industry
Emergency Department Information System Industry REPORT HIGHLIGHTS
| Aspects | Details |
|---|---|
| Study Period | 2020-2034 |
| Base Year | 2025 |
| Estimated Year | 2026 |
| Forecast Period | 2026-2034 |
| Historical Period | 2020-2025 |
| Growth Rate | CAGR of 14.37% from 2020-2034 |
| Segmentation |
|
Table of Contents
- 1. Introduction
- 1.1. Research Scope
- 1.2. Market Segmentation
- 1.3. Research Objective
- 1.4. Definitions and Assumptions
- 2. Executive Summary
- 2.1. Market Snapshot
- 3. Market Dynamics
- 3.1. Market Drivers
- 3.2. Market Restrains
- 3.3. Market Trends
- 3.4. Market Opportunities
- 4. Market Factor Analysis
- 4.1. Porters Five Forces
- 4.1.1. Bargaining Power of Suppliers
- 4.1.2. Bargaining Power of Buyers
- 4.1.3. Threat of New Entrants
- 4.1.4. Threat of Substitutes
- 4.1.5. Competitive Rivalry
- 4.2. PESTEL analysis
- 4.3. BCG Analysis
- 4.3.1. Stars (High Growth, High Market Share)
- 4.3.2. Cash Cows (Low Growth, High Market Share)
- 4.3.3. Question Mark (High Growth, Low Market Share)
- 4.3.4. Dogs (Low Growth, Low Market Share)
- 4.4. Ansoff Matrix Analysis
- 4.5. Supply Chain Analysis
- 4.6. Regulatory Landscape
- 4.7. Current Market Potential and Opportunity Assessment (TAM–SAM–SOM Framework)
- 4.8. VDR Analyst Note
- 4.1. Porters Five Forces
- 5. Market Analysis, Insights and Forecast 2021-2033
- 5.1. Market Analysis, Insights and Forecast - by Application
- 5.1.1. Computerized Physician Order Entry (CPOE)
- 5.1.2. Clinical Documentation
- 5.1.3. Patient Tracking & Triage
- 5.1.4. E-Prescribing
- 5.1.5. Others
- 5.2. Market Analysis, Insights and Forecast - by Deployment
- 5.2.1. On-Premise EDIS
- 5.2.2. Software-As-A-Services (SaaS)
- 5.3. Market Analysis, Insights and Forecast - by Software Type
- 5.3.1. Enterprise Solutions
- 5.3.2. Best of Breed (B.O.B.) Solutions
- 5.4. Market Analysis, Insights and Forecast - by End User
- 5.4.1. Small Hospitals
- 5.4.2. Medium-Sized Hospitals
- 5.4.3. Large Hospitals
- 5.5. Market Analysis, Insights and Forecast - by Region
- 5.5.1. North America
- 5.5.2. Europe
- 5.5.3. Asia Pacific
- 5.5.4. Middle East and Africa
- 5.5.5. South America
- 5.1. Market Analysis, Insights and Forecast - by Application
- 6. Global Emergency Department Information System Industry Analysis, Insights and Forecast, 2021-2033
- 6.1. Market Analysis, Insights and Forecast - by Application
- 6.1.1. Computerized Physician Order Entry (CPOE)
- 6.1.2. Clinical Documentation
- 6.1.3. Patient Tracking & Triage
- 6.1.4. E-Prescribing
- 6.1.5. Others
- 6.2. Market Analysis, Insights and Forecast - by Deployment
- 6.2.1. On-Premise EDIS
- 6.2.2. Software-As-A-Services (SaaS)
- 6.3. Market Analysis, Insights and Forecast - by Software Type
- 6.3.1. Enterprise Solutions
- 6.3.2. Best of Breed (B.O.B.) Solutions
- 6.4. Market Analysis, Insights and Forecast - by End User
- 6.4.1. Small Hospitals
- 6.4.2. Medium-Sized Hospitals
- 6.4.3. Large Hospitals
- 6.1. Market Analysis, Insights and Forecast - by Application
- 7. North America Emergency Department Information System Industry Analysis, Insights and Forecast, 2021-2033
- 7.1. Market Analysis, Insights and Forecast - by Application
- 7.1.1. Computerized Physician Order Entry (CPOE)
- 7.1.2. Clinical Documentation
- 7.1.3. Patient Tracking & Triage
- 7.1.4. E-Prescribing
- 7.1.5. Others
- 7.2. Market Analysis, Insights and Forecast - by Deployment
- 7.2.1. On-Premise EDIS
- 7.2.2. Software-As-A-Services (SaaS)
- 7.3. Market Analysis, Insights and Forecast - by Software Type
- 7.3.1. Enterprise Solutions
- 7.3.2. Best of Breed (B.O.B.) Solutions
- 7.4. Market Analysis, Insights and Forecast - by End User
- 7.4.1. Small Hospitals
- 7.4.2. Medium-Sized Hospitals
- 7.4.3. Large Hospitals
- 7.1. Market Analysis, Insights and Forecast - by Application
- 8. Europe Emergency Department Information System Industry Analysis, Insights and Forecast, 2021-2033
- 8.1. Market Analysis, Insights and Forecast - by Application
- 8.1.1. Computerized Physician Order Entry (CPOE)
- 8.1.2. Clinical Documentation
- 8.1.3. Patient Tracking & Triage
- 8.1.4. E-Prescribing
- 8.1.5. Others
- 8.2. Market Analysis, Insights and Forecast - by Deployment
- 8.2.1. On-Premise EDIS
- 8.2.2. Software-As-A-Services (SaaS)
- 8.3. Market Analysis, Insights and Forecast - by Software Type
- 8.3.1. Enterprise Solutions
- 8.3.2. Best of Breed (B.O.B.) Solutions
- 8.4. Market Analysis, Insights and Forecast - by End User
- 8.4.1. Small Hospitals
- 8.4.2. Medium-Sized Hospitals
- 8.4.3. Large Hospitals
- 8.1. Market Analysis, Insights and Forecast - by Application
- 9. Asia Pacific Emergency Department Information System Industry Analysis, Insights and Forecast, 2021-2033
- 9.1. Market Analysis, Insights and Forecast - by Application
- 9.1.1. Computerized Physician Order Entry (CPOE)
- 9.1.2. Clinical Documentation
- 9.1.3. Patient Tracking & Triage
- 9.1.4. E-Prescribing
- 9.1.5. Others
- 9.2. Market Analysis, Insights and Forecast - by Deployment
- 9.2.1. On-Premise EDIS
- 9.2.2. Software-As-A-Services (SaaS)
- 9.3. Market Analysis, Insights and Forecast - by Software Type
- 9.3.1. Enterprise Solutions
- 9.3.2. Best of Breed (B.O.B.) Solutions
- 9.4. Market Analysis, Insights and Forecast - by End User
- 9.4.1. Small Hospitals
- 9.4.2. Medium-Sized Hospitals
- 9.4.3. Large Hospitals
- 9.1. Market Analysis, Insights and Forecast - by Application
- 10. Middle East and Africa Emergency Department Information System Industry Analysis, Insights and Forecast, 2021-2033
- 10.1. Market Analysis, Insights and Forecast - by Application
- 10.1.1. Computerized Physician Order Entry (CPOE)
- 10.1.2. Clinical Documentation
- 10.1.3. Patient Tracking & Triage
- 10.1.4. E-Prescribing
- 10.1.5. Others
- 10.2. Market Analysis, Insights and Forecast - by Deployment
- 10.2.1. On-Premise EDIS
- 10.2.2. Software-As-A-Services (SaaS)
- 10.3. Market Analysis, Insights and Forecast - by Software Type
- 10.3.1. Enterprise Solutions
- 10.3.2. Best of Breed (B.O.B.) Solutions
- 10.4. Market Analysis, Insights and Forecast - by End User
- 10.4.1. Small Hospitals
- 10.4.2. Medium-Sized Hospitals
- 10.4.3. Large Hospitals
- 10.1. Market Analysis, Insights and Forecast - by Application
- 11. South America Emergency Department Information System Industry Analysis, Insights and Forecast, 2021-2033
- 11.1. Market Analysis, Insights and Forecast - by Application
- 11.1.1. Computerized Physician Order Entry (CPOE)
- 11.1.2. Clinical Documentation
- 11.1.3. Patient Tracking & Triage
- 11.1.4. E-Prescribing
- 11.1.5. Others
- 11.2. Market Analysis, Insights and Forecast - by Deployment
- 11.2.1. On-Premise EDIS
- 11.2.2. Software-As-A-Services (SaaS)
- 11.3. Market Analysis, Insights and Forecast - by Software Type
- 11.3.1. Enterprise Solutions
- 11.3.2. Best of Breed (B.O.B.) Solutions
- 11.4. Market Analysis, Insights and Forecast - by End User
- 11.4.1. Small Hospitals
- 11.4.2. Medium-Sized Hospitals
- 11.4.3. Large Hospitals
- 11.1. Market Analysis, Insights and Forecast - by Application
- 12. Competitive Analysis
- 12.1. Company Profiles
- 12.1.1 Epic Systems
- 12.1.1.1. Company Overview
- 12.1.1.2. Products
- 12.1.1.3. Company Financials
- 12.1.1.4. SWOT Analysis
- 12.1.2 Mckesson Corporation
- 12.1.2.1. Company Overview
- 12.1.2.2. Products
- 12.1.2.3. Company Financials
- 12.1.2.4. SWOT Analysis
- 12.1.3 EPOWERdoc Inc
- 12.1.3.1. Company Overview
- 12.1.3.2. Products
- 12.1.3.3. Company Financials
- 12.1.3.4. SWOT Analysis
- 12.1.4 MEDHOST Inc
- 12.1.4.1. Company Overview
- 12.1.4.2. Products
- 12.1.4.3. Company Financials
- 12.1.4.4. SWOT Analysis
- 12.1.5 Unitedhealth Group Inc
- 12.1.5.1. Company Overview
- 12.1.5.2. Products
- 12.1.5.3. Company Financials
- 12.1.5.4. SWOT Analysis
- 12.1.6 Cerner Corporation
- 12.1.6.1. Company Overview
- 12.1.6.2. Products
- 12.1.6.3. Company Financials
- 12.1.6.4. SWOT Analysis
- 12.1.7 Medical Information Technology Inc
- 12.1.7.1. Company Overview
- 12.1.7.2. Products
- 12.1.7.3. Company Financials
- 12.1.7.4. SWOT Analysis
- 12.1.8 Logibec Canada
- 12.1.8.1. Company Overview
- 12.1.8.2. Products
- 12.1.8.3. Company Financials
- 12.1.8.4. SWOT Analysis
- 12.1.9 Allscripts Healthcare Solutions Inc
- 12.1.9.1. Company Overview
- 12.1.9.2. Products
- 12.1.9.3. Company Financials
- 12.1.9.4. SWOT Analysis
- 12.1.10 T-Systems Inc
- 12.1.10.1. Company Overview
- 12.1.10.2. Products
- 12.1.10.3. Company Financials
- 12.1.10.4. SWOT Analysis
- 12.1.11 Evident
- 12.1.11.1. Company Overview
- 12.1.11.2. Products
- 12.1.11.3. Company Financials
- 12.1.11.4. SWOT Analysis
- 12.1.12 Medsphere Systems Corporation
- 12.1.12.1. Company Overview
- 12.1.12.2. Products
- 12.1.12.3. Company Financials
- 12.1.12.4. SWOT Analysis
- 12.1.1 Epic Systems
- 12.2. Market Entropy
- 12.2.1 Company's Key Areas Served
- 12.2.2 Recent Developments
- 12.3. Company Market Share Analysis 2025
- 12.3.1 Top 5 Companies Market Share Analysis
- 12.3.2 Top 3 Companies Market Share Analysis
- 12.4. List of Potential Customers
- 13. Research Methodology
List of Figures
- Figure 1: Global Emergency Department Information System Industry Revenue Breakdown (Million, %) by Region 2025 & 2033
- Figure 2: Global Emergency Department Information System Industry Volume Breakdown (K Unit, %) by Region 2025 & 2033
- Figure 3: North America Emergency Department Information System Industry Revenue (Million), by Application 2025 & 2033
- Figure 4: North America Emergency Department Information System Industry Volume (K Unit), by Application 2025 & 2033
- Figure 5: North America Emergency Department Information System Industry Revenue Share (%), by Application 2025 & 2033
- Figure 6: North America Emergency Department Information System Industry Volume Share (%), by Application 2025 & 2033
- Figure 7: North America Emergency Department Information System Industry Revenue (Million), by Deployment 2025 & 2033
- Figure 8: North America Emergency Department Information System Industry Volume (K Unit), by Deployment 2025 & 2033
- Figure 9: North America Emergency Department Information System Industry Revenue Share (%), by Deployment 2025 & 2033
- Figure 10: North America Emergency Department Information System Industry Volume Share (%), by Deployment 2025 & 2033
- Figure 11: North America Emergency Department Information System Industry Revenue (Million), by Software Type 2025 & 2033
- Figure 12: North America Emergency Department Information System Industry Volume (K Unit), by Software Type 2025 & 2033
- Figure 13: North America Emergency Department Information System Industry Revenue Share (%), by Software Type 2025 & 2033
- Figure 14: North America Emergency Department Information System Industry Volume Share (%), by Software Type 2025 & 2033
- Figure 15: North America Emergency Department Information System Industry Revenue (Million), by End User 2025 & 2033
- Figure 16: North America Emergency Department Information System Industry Volume (K Unit), by End User 2025 & 2033
- Figure 17: North America Emergency Department Information System Industry Revenue Share (%), by End User 2025 & 2033
- Figure 18: North America Emergency Department Information System Industry Volume Share (%), by End User 2025 & 2033
- Figure 19: North America Emergency Department Information System Industry Revenue (Million), by Country 2025 & 2033
- Figure 20: North America Emergency Department Information System Industry Volume (K Unit), by Country 2025 & 2033
- Figure 21: North America Emergency Department Information System Industry Revenue Share (%), by Country 2025 & 2033
- Figure 22: North America Emergency Department Information System Industry Volume Share (%), by Country 2025 & 2033
- Figure 23: Europe Emergency Department Information System Industry Revenue (Million), by Application 2025 & 2033
- Figure 24: Europe Emergency Department Information System Industry Volume (K Unit), by Application 2025 & 2033
- Figure 25: Europe Emergency Department Information System Industry Revenue Share (%), by Application 2025 & 2033
- Figure 26: Europe Emergency Department Information System Industry Volume Share (%), by Application 2025 & 2033
- Figure 27: Europe Emergency Department Information System Industry Revenue (Million), by Deployment 2025 & 2033
- Figure 28: Europe Emergency Department Information System Industry Volume (K Unit), by Deployment 2025 & 2033
- Figure 29: Europe Emergency Department Information System Industry Revenue Share (%), by Deployment 2025 & 2033
- Figure 30: Europe Emergency Department Information System Industry Volume Share (%), by Deployment 2025 & 2033
- Figure 31: Europe Emergency Department Information System Industry Revenue (Million), by Software Type 2025 & 2033
- Figure 32: Europe Emergency Department Information System Industry Volume (K Unit), by Software Type 2025 & 2033
- Figure 33: Europe Emergency Department Information System Industry Revenue Share (%), by Software Type 2025 & 2033
- Figure 34: Europe Emergency Department Information System Industry Volume Share (%), by Software Type 2025 & 2033
- Figure 35: Europe Emergency Department Information System Industry Revenue (Million), by End User 2025 & 2033
- Figure 36: Europe Emergency Department Information System Industry Volume (K Unit), by End User 2025 & 2033
- Figure 37: Europe Emergency Department Information System Industry Revenue Share (%), by End User 2025 & 2033
- Figure 38: Europe Emergency Department Information System Industry Volume Share (%), by End User 2025 & 2033
- Figure 39: Europe Emergency Department Information System Industry Revenue (Million), by Country 2025 & 2033
- Figure 40: Europe Emergency Department Information System Industry Volume (K Unit), by Country 2025 & 2033
- Figure 41: Europe Emergency Department Information System Industry Revenue Share (%), by Country 2025 & 2033
- Figure 42: Europe Emergency Department Information System Industry Volume Share (%), by Country 2025 & 2033
- Figure 43: Asia Pacific Emergency Department Information System Industry Revenue (Million), by Application 2025 & 2033
- Figure 44: Asia Pacific Emergency Department Information System Industry Volume (K Unit), by Application 2025 & 2033
- Figure 45: Asia Pacific Emergency Department Information System Industry Revenue Share (%), by Application 2025 & 2033
- Figure 46: Asia Pacific Emergency Department Information System Industry Volume Share (%), by Application 2025 & 2033
- Figure 47: Asia Pacific Emergency Department Information System Industry Revenue (Million), by Deployment 2025 & 2033
- Figure 48: Asia Pacific Emergency Department Information System Industry Volume (K Unit), by Deployment 2025 & 2033
- Figure 49: Asia Pacific Emergency Department Information System Industry Revenue Share (%), by Deployment 2025 & 2033
- Figure 50: Asia Pacific Emergency Department Information System Industry Volume Share (%), by Deployment 2025 & 2033
- Figure 51: Asia Pacific Emergency Department Information System Industry Revenue (Million), by Software Type 2025 & 2033
- Figure 52: Asia Pacific Emergency Department Information System Industry Volume (K Unit), by Software Type 2025 & 2033
- Figure 53: Asia Pacific Emergency Department Information System Industry Revenue Share (%), by Software Type 2025 & 2033
- Figure 54: Asia Pacific Emergency Department Information System Industry Volume Share (%), by Software Type 2025 & 2033
- Figure 55: Asia Pacific Emergency Department Information System Industry Revenue (Million), by End User 2025 & 2033
- Figure 56: Asia Pacific Emergency Department Information System Industry Volume (K Unit), by End User 2025 & 2033
- Figure 57: Asia Pacific Emergency Department Information System Industry Revenue Share (%), by End User 2025 & 2033
- Figure 58: Asia Pacific Emergency Department Information System Industry Volume Share (%), by End User 2025 & 2033
- Figure 59: Asia Pacific Emergency Department Information System Industry Revenue (Million), by Country 2025 & 2033
- Figure 60: Asia Pacific Emergency Department Information System Industry Volume (K Unit), by Country 2025 & 2033
- Figure 61: Asia Pacific Emergency Department Information System Industry Revenue Share (%), by Country 2025 & 2033
- Figure 62: Asia Pacific Emergency Department Information System Industry Volume Share (%), by Country 2025 & 2033
- Figure 63: Middle East and Africa Emergency Department Information System Industry Revenue (Million), by Application 2025 & 2033
- Figure 64: Middle East and Africa Emergency Department Information System Industry Volume (K Unit), by Application 2025 & 2033
- Figure 65: Middle East and Africa Emergency Department Information System Industry Revenue Share (%), by Application 2025 & 2033
- Figure 66: Middle East and Africa Emergency Department Information System Industry Volume Share (%), by Application 2025 & 2033
- Figure 67: Middle East and Africa Emergency Department Information System Industry Revenue (Million), by Deployment 2025 & 2033
- Figure 68: Middle East and Africa Emergency Department Information System Industry Volume (K Unit), by Deployment 2025 & 2033
- Figure 69: Middle East and Africa Emergency Department Information System Industry Revenue Share (%), by Deployment 2025 & 2033
- Figure 70: Middle East and Africa Emergency Department Information System Industry Volume Share (%), by Deployment 2025 & 2033
- Figure 71: Middle East and Africa Emergency Department Information System Industry Revenue (Million), by Software Type 2025 & 2033
- Figure 72: Middle East and Africa Emergency Department Information System Industry Volume (K Unit), by Software Type 2025 & 2033
- Figure 73: Middle East and Africa Emergency Department Information System Industry Revenue Share (%), by Software Type 2025 & 2033
- Figure 74: Middle East and Africa Emergency Department Information System Industry Volume Share (%), by Software Type 2025 & 2033
- Figure 75: Middle East and Africa Emergency Department Information System Industry Revenue (Million), by End User 2025 & 2033
- Figure 76: Middle East and Africa Emergency Department Information System Industry Volume (K Unit), by End User 2025 & 2033
- Figure 77: Middle East and Africa Emergency Department Information System Industry Revenue Share (%), by End User 2025 & 2033
- Figure 78: Middle East and Africa Emergency Department Information System Industry Volume Share (%), by End User 2025 & 2033
- Figure 79: Middle East and Africa Emergency Department Information System Industry Revenue (Million), by Country 2025 & 2033
- Figure 80: Middle East and Africa Emergency Department Information System Industry Volume (K Unit), by Country 2025 & 2033
- Figure 81: Middle East and Africa Emergency Department Information System Industry Revenue Share (%), by Country 2025 & 2033
- Figure 82: Middle East and Africa Emergency Department Information System Industry Volume Share (%), by Country 2025 & 2033
- Figure 83: South America Emergency Department Information System Industry Revenue (Million), by Application 2025 & 2033
- Figure 84: South America Emergency Department Information System Industry Volume (K Unit), by Application 2025 & 2033
- Figure 85: South America Emergency Department Information System Industry Revenue Share (%), by Application 2025 & 2033
- Figure 86: South America Emergency Department Information System Industry Volume Share (%), by Application 2025 & 2033
- Figure 87: South America Emergency Department Information System Industry Revenue (Million), by Deployment 2025 & 2033
- Figure 88: South America Emergency Department Information System Industry Volume (K Unit), by Deployment 2025 & 2033
- Figure 89: South America Emergency Department Information System Industry Revenue Share (%), by Deployment 2025 & 2033
- Figure 90: South America Emergency Department Information System Industry Volume Share (%), by Deployment 2025 & 2033
- Figure 91: South America Emergency Department Information System Industry Revenue (Million), by Software Type 2025 & 2033
- Figure 92: South America Emergency Department Information System Industry Volume (K Unit), by Software Type 2025 & 2033
- Figure 93: South America Emergency Department Information System Industry Revenue Share (%), by Software Type 2025 & 2033
- Figure 94: South America Emergency Department Information System Industry Volume Share (%), by Software Type 2025 & 2033
- Figure 95: South America Emergency Department Information System Industry Revenue (Million), by End User 2025 & 2033
- Figure 96: South America Emergency Department Information System Industry Volume (K Unit), by End User 2025 & 2033
- Figure 97: South America Emergency Department Information System Industry Revenue Share (%), by End User 2025 & 2033
- Figure 98: South America Emergency Department Information System Industry Volume Share (%), by End User 2025 & 2033
- Figure 99: South America Emergency Department Information System Industry Revenue (Million), by Country 2025 & 2033
- Figure 100: South America Emergency Department Information System Industry Volume (K Unit), by Country 2025 & 2033
- Figure 101: South America Emergency Department Information System Industry Revenue Share (%), by Country 2025 & 2033
- Figure 102: South America Emergency Department Information System Industry Volume Share (%), by Country 2025 & 2033
List of Tables
- Table 1: Global Emergency Department Information System Industry Revenue Million Forecast, by Application 2020 & 2033
- Table 2: Global Emergency Department Information System Industry Volume K Unit Forecast, by Application 2020 & 2033
- Table 3: Global Emergency Department Information System Industry Revenue Million Forecast, by Deployment 2020 & 2033
- Table 4: Global Emergency Department Information System Industry Volume K Unit Forecast, by Deployment 2020 & 2033
- Table 5: Global Emergency Department Information System Industry Revenue Million Forecast, by Software Type 2020 & 2033
- Table 6: Global Emergency Department Information System Industry Volume K Unit Forecast, by Software Type 2020 & 2033
- Table 7: Global Emergency Department Information System Industry Revenue Million Forecast, by End User 2020 & 2033
- Table 8: Global Emergency Department Information System Industry Volume K Unit Forecast, by End User 2020 & 2033
- Table 9: Global Emergency Department Information System Industry Revenue Million Forecast, by Region 2020 & 2033
- Table 10: Global Emergency Department Information System Industry Volume K Unit Forecast, by Region 2020 & 2033
- Table 11: Global Emergency Department Information System Industry Revenue Million Forecast, by Application 2020 & 2033
- Table 12: Global Emergency Department Information System Industry Volume K Unit Forecast, by Application 2020 & 2033
- Table 13: Global Emergency Department Information System Industry Revenue Million Forecast, by Deployment 2020 & 2033
- Table 14: Global Emergency Department Information System Industry Volume K Unit Forecast, by Deployment 2020 & 2033
- Table 15: Global Emergency Department Information System Industry Revenue Million Forecast, by Software Type 2020 & 2033
- Table 16: Global Emergency Department Information System Industry Volume K Unit Forecast, by Software Type 2020 & 2033
- Table 17: Global Emergency Department Information System Industry Revenue Million Forecast, by End User 2020 & 2033
- Table 18: Global Emergency Department Information System Industry Volume K Unit Forecast, by End User 2020 & 2033
- Table 19: Global Emergency Department Information System Industry Revenue Million Forecast, by Country 2020 & 2033
- Table 20: Global Emergency Department Information System Industry Volume K Unit Forecast, by Country 2020 & 2033
- Table 21: United States Emergency Department Information System Industry Revenue (Million) Forecast, by Application 2020 & 2033
- Table 22: United States Emergency Department Information System Industry Volume (K Unit) Forecast, by Application 2020 & 2033
- Table 23: Canada Emergency Department Information System Industry Revenue (Million) Forecast, by Application 2020 & 2033
- Table 24: Canada Emergency Department Information System Industry Volume (K Unit) Forecast, by Application 2020 & 2033
- Table 25: Mexico Emergency Department Information System Industry Revenue (Million) Forecast, by Application 2020 & 2033
- Table 26: Mexico Emergency Department Information System Industry Volume (K Unit) Forecast, by Application 2020 & 2033
- Table 27: Global Emergency Department Information System Industry Revenue Million Forecast, by Application 2020 & 2033
- Table 28: Global Emergency Department Information System Industry Volume K Unit Forecast, by Application 2020 & 2033
- Table 29: Global Emergency Department Information System Industry Revenue Million Forecast, by Deployment 2020 & 2033
- Table 30: Global Emergency Department Information System Industry Volume K Unit Forecast, by Deployment 2020 & 2033
- Table 31: Global Emergency Department Information System Industry Revenue Million Forecast, by Software Type 2020 & 2033
- Table 32: Global Emergency Department Information System Industry Volume K Unit Forecast, by Software Type 2020 & 2033
- Table 33: Global Emergency Department Information System Industry Revenue Million Forecast, by End User 2020 & 2033
- Table 34: Global Emergency Department Information System Industry Volume K Unit Forecast, by End User 2020 & 2033
- Table 35: Global Emergency Department Information System Industry Revenue Million Forecast, by Country 2020 & 2033
- Table 36: Global Emergency Department Information System Industry Volume K Unit Forecast, by Country 2020 & 2033
- Table 37: Germany Emergency Department Information System Industry Revenue (Million) Forecast, by Application 2020 & 2033
- Table 38: Germany Emergency Department Information System Industry Volume (K Unit) Forecast, by Application 2020 & 2033
- Table 39: United Kingdom Emergency Department Information System Industry Revenue (Million) Forecast, by Application 2020 & 2033
- Table 40: United Kingdom Emergency Department Information System Industry Volume (K Unit) Forecast, by Application 2020 & 2033
- Table 41: France Emergency Department Information System Industry Revenue (Million) Forecast, by Application 2020 & 2033
- Table 42: France Emergency Department Information System Industry Volume (K Unit) Forecast, by Application 2020 & 2033
- Table 43: Italy Emergency Department Information System Industry Revenue (Million) Forecast, by Application 2020 & 2033
- Table 44: Italy Emergency Department Information System Industry Volume (K Unit) Forecast, by Application 2020 & 2033
- Table 45: Spain Emergency Department Information System Industry Revenue (Million) Forecast, by Application 2020 & 2033
- Table 46: Spain Emergency Department Information System Industry Volume (K Unit) Forecast, by Application 2020 & 2033
- Table 47: Rest of Europe Emergency Department Information System Industry Revenue (Million) Forecast, by Application 2020 & 2033
- Table 48: Rest of Europe Emergency Department Information System Industry Volume (K Unit) Forecast, by Application 2020 & 2033
- Table 49: Global Emergency Department Information System Industry Revenue Million Forecast, by Application 2020 & 2033
- Table 50: Global Emergency Department Information System Industry Volume K Unit Forecast, by Application 2020 & 2033
- Table 51: Global Emergency Department Information System Industry Revenue Million Forecast, by Deployment 2020 & 2033
- Table 52: Global Emergency Department Information System Industry Volume K Unit Forecast, by Deployment 2020 & 2033
- Table 53: Global Emergency Department Information System Industry Revenue Million Forecast, by Software Type 2020 & 2033
- Table 54: Global Emergency Department Information System Industry Volume K Unit Forecast, by Software Type 2020 & 2033
- Table 55: Global Emergency Department Information System Industry Revenue Million Forecast, by End User 2020 & 2033
- Table 56: Global Emergency Department Information System Industry Volume K Unit Forecast, by End User 2020 & 2033
- Table 57: Global Emergency Department Information System Industry Revenue Million Forecast, by Country 2020 & 2033
- Table 58: Global Emergency Department Information System Industry Volume K Unit Forecast, by Country 2020 & 2033
- Table 59: China Emergency Department Information System Industry Revenue (Million) Forecast, by Application 2020 & 2033
- Table 60: China Emergency Department Information System Industry Volume (K Unit) Forecast, by Application 2020 & 2033
- Table 61: Japan Emergency Department Information System Industry Revenue (Million) Forecast, by Application 2020 & 2033
- Table 62: Japan Emergency Department Information System Industry Volume (K Unit) Forecast, by Application 2020 & 2033
- Table 63: India Emergency Department Information System Industry Revenue (Million) Forecast, by Application 2020 & 2033
- Table 64: India Emergency Department Information System Industry Volume (K Unit) Forecast, by Application 2020 & 2033
- Table 65: Australia Emergency Department Information System Industry Revenue (Million) Forecast, by Application 2020 & 2033
- Table 66: Australia Emergency Department Information System Industry Volume (K Unit) Forecast, by Application 2020 & 2033
- Table 67: South Korea Emergency Department Information System Industry Revenue (Million) Forecast, by Application 2020 & 2033
- Table 68: South Korea Emergency Department Information System Industry Volume (K Unit) Forecast, by Application 2020 & 2033
- Table 69: Rest of Asia Pacific Emergency Department Information System Industry Revenue (Million) Forecast, by Application 2020 & 2033
- Table 70: Rest of Asia Pacific Emergency Department Information System Industry Volume (K Unit) Forecast, by Application 2020 & 2033
- Table 71: Global Emergency Department Information System Industry Revenue Million Forecast, by Application 2020 & 2033
- Table 72: Global Emergency Department Information System Industry Volume K Unit Forecast, by Application 2020 & 2033
- Table 73: Global Emergency Department Information System Industry Revenue Million Forecast, by Deployment 2020 & 2033
- Table 74: Global Emergency Department Information System Industry Volume K Unit Forecast, by Deployment 2020 & 2033
- Table 75: Global Emergency Department Information System Industry Revenue Million Forecast, by Software Type 2020 & 2033
- Table 76: Global Emergency Department Information System Industry Volume K Unit Forecast, by Software Type 2020 & 2033
- Table 77: Global Emergency Department Information System Industry Revenue Million Forecast, by End User 2020 & 2033
- Table 78: Global Emergency Department Information System Industry Volume K Unit Forecast, by End User 2020 & 2033
- Table 79: Global Emergency Department Information System Industry Revenue Million Forecast, by Country 2020 & 2033
- Table 80: Global Emergency Department Information System Industry Volume K Unit Forecast, by Country 2020 & 2033
- Table 81: GCC Emergency Department Information System Industry Revenue (Million) Forecast, by Application 2020 & 2033
- Table 82: GCC Emergency Department Information System Industry Volume (K Unit) Forecast, by Application 2020 & 2033
- Table 83: South Africa Emergency Department Information System Industry Revenue (Million) Forecast, by Application 2020 & 2033
- Table 84: South Africa Emergency Department Information System Industry Volume (K Unit) Forecast, by Application 2020 & 2033
- Table 85: Rest of Middle East and Africa Emergency Department Information System Industry Revenue (Million) Forecast, by Application 2020 & 2033
- Table 86: Rest of Middle East and Africa Emergency Department Information System Industry Volume (K Unit) Forecast, by Application 2020 & 2033
- Table 87: Global Emergency Department Information System Industry Revenue Million Forecast, by Application 2020 & 2033
- Table 88: Global Emergency Department Information System Industry Volume K Unit Forecast, by Application 2020 & 2033
- Table 89: Global Emergency Department Information System Industry Revenue Million Forecast, by Deployment 2020 & 2033
- Table 90: Global Emergency Department Information System Industry Volume K Unit Forecast, by Deployment 2020 & 2033
- Table 91: Global Emergency Department Information System Industry Revenue Million Forecast, by Software Type 2020 & 2033
- Table 92: Global Emergency Department Information System Industry Volume K Unit Forecast, by Software Type 2020 & 2033
- Table 93: Global Emergency Department Information System Industry Revenue Million Forecast, by End User 2020 & 2033
- Table 94: Global Emergency Department Information System Industry Volume K Unit Forecast, by End User 2020 & 2033
- Table 95: Global Emergency Department Information System Industry Revenue Million Forecast, by Country 2020 & 2033
- Table 96: Global Emergency Department Information System Industry Volume K Unit Forecast, by Country 2020 & 2033
- Table 97: Brazil Emergency Department Information System Industry Revenue (Million) Forecast, by Application 2020 & 2033
- Table 98: Brazil Emergency Department Information System Industry Volume (K Unit) Forecast, by Application 2020 & 2033
- Table 99: Argentina Emergency Department Information System Industry Revenue (Million) Forecast, by Application 2020 & 2033
- Table 100: Argentina Emergency Department Information System Industry Volume (K Unit) Forecast, by Application 2020 & 2033
- Table 101: Rest of South America Emergency Department Information System Industry Revenue (Million) Forecast, by Application 2020 & 2033
- Table 102: Rest of South America Emergency Department Information System Industry Volume (K Unit) Forecast, by Application 2020 & 2033
Frequently Asked Questions
1. What is the projected Compound Annual Growth Rate (CAGR) of the Emergency Department Information System Industry?
The projected CAGR is approximately 14.37%.
2. Which companies are prominent players in the Emergency Department Information System Industry?
Key companies in the market include Epic Systems, Mckesson Corporation, EPOWERdoc Inc, MEDHOST Inc, Unitedhealth Group Inc, Cerner Corporation, Medical Information Technology Inc, Logibec Canada, Allscripts Healthcare Solutions Inc, T-Systems Inc, Evident, Medsphere Systems Corporation.
3. What are the main segments of the Emergency Department Information System Industry?
The market segments include Application, Deployment, Software Type, End User.
4. Can you provide details about the market size?
The market size is estimated to be USD 1.03 Million as of 2022.
5. What are some drivers contributing to market growth?
Rise in the Geriatric Population; Increasing Use Of Data-Driven Technologies; Increase in Number of Insured Population.
6. What are the notable trends driving market growth?
Best of Breed (B.O.B.) Solutions are Anticipated to be the Dominant Segment in Software Type During the Forecast Period.
7. Are there any restraints impacting market growth?
Adverse Quality and Safety Implications Of EDIS; Lack of Skilled Healthcare IT Professionals.
8. Can you provide examples of recent developments in the market?
In March 2022, HeartBeam, Inc. signed a Business Associate Agreement (BAA) and a Clinical Trial Agreement (CTA) with Phoebe Putney Health System to conduct a pilot study designed to evaluate HeartBeam's Emergency Department (ED) Myocardial Infarction (MI) software product.
9. What pricing options are available for accessing the report?
Pricing options include single-user, multi-user, and enterprise licenses priced at USD 4750, USD 5250, and USD 8750 respectively.
10. Is the market size provided in terms of value or volume?
The market size is provided in terms of value, measured in Million and volume, measured in K Unit.
11. Are there any specific market keywords associated with the report?
Yes, the market keyword associated with the report is "Emergency Department Information System Industry," which aids in identifying and referencing the specific market segment covered.
12. How do I determine which pricing option suits my needs best?
The pricing options vary based on user requirements and access needs. Individual users may opt for single-user licenses, while businesses requiring broader access may choose multi-user or enterprise licenses for cost-effective access to the report.
13. Are there any additional resources or data provided in the Emergency Department Information System Industry report?
While the report offers comprehensive insights, it's advisable to review the specific contents or supplementary materials provided to ascertain if additional resources or data are available.
14. How can I stay updated on further developments or reports in the Emergency Department Information System Industry?
To stay informed about further developments, trends, and reports in the Emergency Department Information System Industry, consider subscribing to industry newsletters, following relevant companies and organizations, or regularly checking reputable industry news sources and publications.
Methodology
Step 1 - Identification of Relevant Samples Size from Population Database


Step 2 - Approaches for Defining Global Market Size (Value, Volume* & Price*)

Note*: In applicable scenarios
Step 3 - Data Sources
Primary Research
- Web Analytics
- Survey Reports
- Research Institute
- Latest Research Reports
- Opinion Leaders
Secondary Research
- Annual Reports
- White Paper
- Latest Press Release
- Industry Association
- Paid Database
- Investor Presentations

Step 4 - Data Triangulation
Involves using different sources of information in order to increase the validity of a study
These sources are likely to be stakeholders in a program - participants, other researchers, program staff, other community members, and so on.
Then we put all data in single framework & apply various statistical tools to find out the dynamic on the market.
During the analysis stage, feedback from the stakeholder groups would be compared to determine areas of agreement as well as areas of divergence