

Key Insights
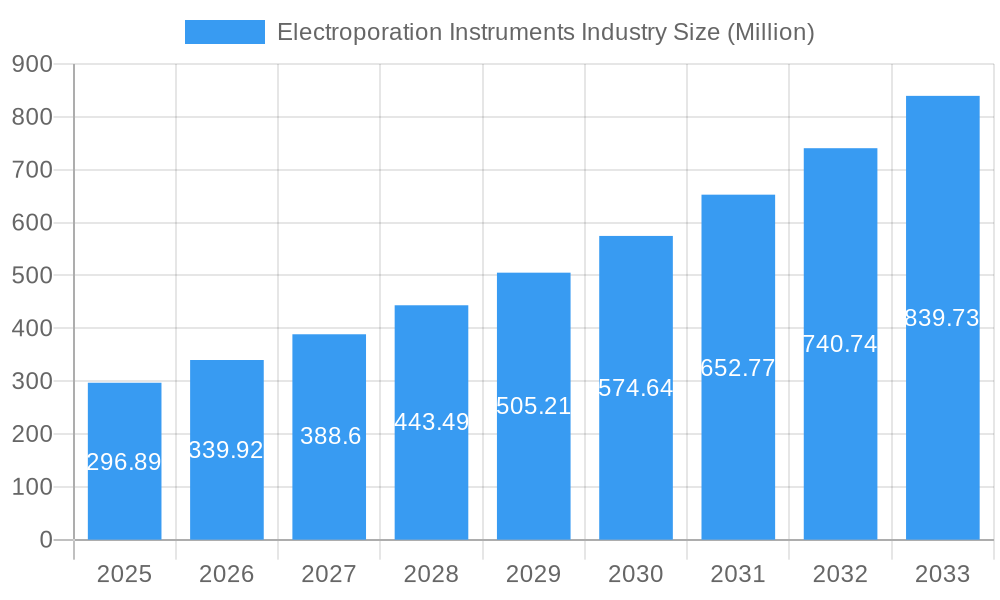
The global Electroporation Instruments market is poised for robust expansion, projected to reach USD 296.89 million in 2025 and experience a significant CAGR of 14.5% throughout the forecast period of 2025-2033. This impressive growth is propelled by the increasing demand for advanced cell and gene therapies, a burgeoning area of biomedical research, and the rising need for efficient protein production techniques. The inherent precision and effectiveness of electroporation in genetic material delivery make it a cornerstone technology for drug discovery, vaccine development, and therapeutic interventions. Key drivers include substantial investments in life sciences research and development, a growing understanding of molecular mechanisms, and the continuous innovation in electroporation device technology, offering enhanced throughput and user-friendliness. The market is witnessing a shift towards sophisticated, automated systems that cater to the complex requirements of modern biopharmaceutical manufacturing and advanced research laboratories.
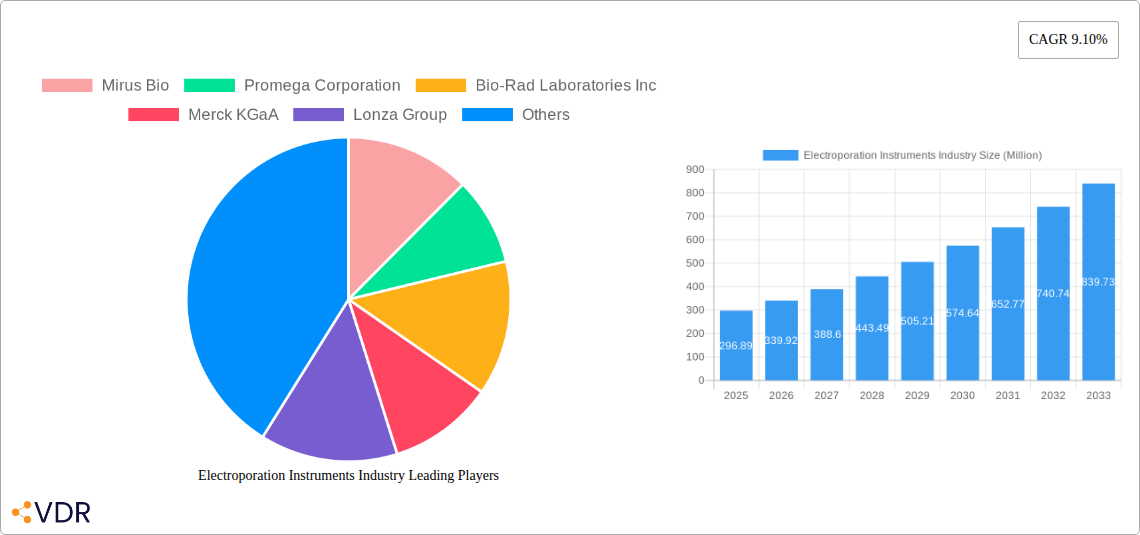
Electroporation Instruments Industry Market Size (In Million)
The market segmentation highlights the dominance of reagent-based methods, favored for their versatility and cost-effectiveness in research settings, alongside the increasing adoption of instrument-based methods for large-scale applications and precise control in therapeutic delivery. Biomedical research stands out as the leading application segment, driven by its critical role in understanding disease pathways and developing novel treatments. Therapeutic delivery, particularly for gene and cell therapies, is a rapidly growing segment, reflecting the clinical translation of electroporation technologies. Leading companies such as Thermo Fisher Scientific, Merck KGaA, and Lonza Group are investing heavily in research and development to introduce next-generation electroporation solutions. Geographically, North America and Europe are expected to dominate the market due to their well-established life science infrastructure and significant R&D expenditures. However, the Asia Pacific region is anticipated to witness the fastest growth, fueled by increasing government support for biotechnology and a rising number of research institutions.
Electroporation Instruments Industry Company Market Share
This report offers an in-depth analysis of the global Electroporation Instruments market, exploring its dynamics, growth trajectories, and future potential. Covering the study period from 2019 to 2033, with a base and estimated year of 2025, this research provides critical insights for industry stakeholders, researchers, and investors navigating the evolving landscape of cell and gene therapy, drug discovery, and biopharmaceutical production. Our analysis delves into granular details, including parent and child market segmentation, to offer a holistic understanding of this rapidly advancing sector.
Electroporation Instruments Industry Market Dynamics & Structure
The Electroporation Instruments market exhibits a moderately concentrated structure, with a blend of established large enterprises and emerging specialized players vying for market share. Technological innovation remains the primary driver, fueled by advancements in electroporation technology for enhanced transfection efficiency and reduced cellular toxicity. Key companies such as Thermo Fisher Scientific, Bio-Rad Laboratories Inc., Lonza Group, and Merck KGaA hold significant positions, actively investing in research and development to introduce novel instrumentation and optimized protocols. Regulatory frameworks, particularly concerning novel therapeutic delivery methods, are evolving to accommodate the growing applications of electroporation in clinical settings, impacting product approval and market access. Competitive product substitutes, including chemical transfection reagents and viral vector delivery systems, present an ongoing challenge, necessitating continuous innovation and demonstration of superior performance by electroporation technologies. End-user demographics are increasingly diverse, spanning academic research institutions, contract research organizations (CROs), and biopharmaceutical companies focused on cell and gene therapies. Mergers and acquisitions (M&A) activity is a notable trend, as larger entities seek to consolidate their offerings and expand their technological portfolios. For instance, in recent years, several strategic acquisitions have aimed at integrating advanced electroporation platforms with complementary cell engineering solutions.
- Market Concentration: Moderately concentrated with significant presence of major players.
- Technological Innovation Drivers: Increased transfection efficiency, reduced cell viability loss, development of novel electrode designs, and automation.
- Regulatory Frameworks: Evolving guidelines for gene therapy and novel drug delivery systems, impacting market entry and expansion.
- Competitive Product Substitutes: Chemical transfection reagents, viral vectors, microinjection.
- End-User Demographics: Academic research, biopharmaceutical R&D, CROs, cell and gene therapy developers.
- M&A Trends: Strategic acquisitions to expand product portfolios and market reach.
Electroporation Instruments Industry Growth Trends & Insights
The Electroporation Instruments market is poised for robust growth, driven by the escalating demand for advanced cell engineering techniques in burgeoning fields such as cell and gene therapy, personalized medicine, and the development of novel biologics. The market size is projected to expand significantly from USD 2,500 million in 2024 to an estimated USD 7,800 million by 2033, exhibiting a compound annual growth rate (CAGR) of approximately 13.5% during the forecast period. This substantial growth is underpinned by increasing adoption rates of electroporation technologies for both research-grade applications and large-scale bioproduction. Technological disruptions, including the development of more precise and user-friendly electroporation systems, alongside advancements in disposable cuvettes and optimized reagent formulations, are further accelerating market penetration. Consumer behavior shifts, particularly the growing preference for non-viral delivery methods due to safety concerns associated with viral vectors, are a significant tailwind. The expanding applications in therapeutic delivery, where electroporation facilitates efficient gene delivery for in vivo and ex vivo therapies, are also contributing to market expansion. Furthermore, the continuous refinement of protein production processes utilizing electroporation for enhanced expression levels in mammalian cells adds another layer of growth momentum. The increasing investment in life sciences research globally and the growing pipeline of cell and gene therapy candidates are expected to maintain this upward trajectory.
- Market Size Evolution: Projected growth from USD 2,500 million (2024) to USD 7,800 million (2033).
- CAGR: Approximately 13.5% during the forecast period (2025-2033).
- Adoption Rates: Increasing adoption in research and bioproduction, including large-scale manufacturing.
- Technological Disruptions: Development of advanced instruments, disposable consumables, and optimized protocols.
- Consumer Behavior Shifts: Preference for non-viral delivery methods due to safety and efficacy concerns.
- Market Penetration: Driven by advancements in cell and gene therapy, drug discovery, and protein production.
Dominant Regions, Countries, or Segments in Electroporation Instruments Industry
North America currently dominates the Electroporation Instruments market, propelled by a robust life sciences research infrastructure, significant government funding for biomedical research, and a burgeoning cell and gene therapy industry. The United States, in particular, is a key market due to the presence of leading research institutions, numerous biopharmaceutical companies actively developing advanced therapies, and early adoption of novel biotechnologies. The Instrument-based Method segment is a significant contributor to this regional dominance, offering a wide array of benchtop and high-throughput electroporation systems.
- Leading Region: North America, driven by the United States.
- Key Drivers in North America:
- Strong presence of leading research institutions and biopharmaceutical companies.
- Substantial government investment in life sciences and healthcare.
- Pioneering advancements in cell and gene therapies.
- High adoption rates of cutting-edge technologies.
- Favorable reimbursement policies for advanced therapies.
Within the Application segmentation, Biomedical Research remains a foundational driver, with academic and institutional laboratories utilizing electroporation for gene function studies, genetic engineering, and basic science exploration. However, the Therapeutic Delivery segment is witnessing exponential growth, fueled by the increasing number of clinical trials and approvals for cell and gene therapies utilizing electroporation for ex vivo cell modification or in vivo gene delivery. This is leading to a substantial increase in demand for high-throughput and GMP-compliant electroporation systems.
- Dominant Application Segment: Therapeutic Delivery, experiencing rapid growth due to cell and gene therapy advancements.
- Key Drivers for Therapeutic Delivery Dominance:
- Advancements in CAR-T therapy and other immunotherapies.
- Development of in vivo gene editing and delivery strategies.
- Increasing focus on personalized medicine.
- Growing pipeline of gene and cell therapy candidates in clinical development.
The Instrument-based Method segment, as opposed to reagent-based methods like chemical transfection, is a critical factor in market leadership. Instrument-based methods offer greater control over electrical parameters, leading to higher transfection efficiencies and better cell viability, crucial for therapeutic applications. The development of advanced electroporation devices with precise parameter control, automated workflows, and scalability for manufacturing purposes significantly contributes to the dominance of this segment.
- Dominant Method Segment: Instrument-based Method.
- Key Drivers for Instrument-based Method Dominance:
- Superior control over transfection parameters (voltage, pulse duration, number of pulses).
- Higher transfection efficiency and cell viability compared to some reagent-based methods.
- Scalability for large-scale bioproduction.
- Development of specialized devices for specific cell types and applications.
Electroporation Instruments Industry Product Landscape
The electroporation instruments product landscape is characterized by continuous innovation, offering a diverse range of devices from benchtop systems for research laboratories to high-throughput, scalable platforms for biopharmaceutical manufacturing. Key product innovations include advanced electrode designs for optimized field distribution, user-friendly interfaces with pre-programmed protocols, and integrated systems for automated sample handling and data acquisition. These advancements are enhancing transfection efficiency, improving cell viability, and reducing experimental variability. Applications span gene editing, protein expression, cell line development, and increasingly, the manufacturing of cell and gene therapies. Unique selling propositions often revolve around ease of use, reproducibility, scalability, and specific application suitability. For instance, devices are being developed with specialized chambers for primary cells or fragile cell lines.
Key Drivers, Barriers & Challenges in Electroporation Instruments Industry
Key Drivers:
- Advancements in Cell and Gene Therapies: The burgeoning field of cell and gene therapy is a primary growth driver, with electroporation being a critical technology for ex vivo cell modification and in vivo gene delivery.
- Increasing Demand for Biologics: Growing need for recombinant proteins, antibodies, and other biologics fuels demand for efficient cell-based production systems.
- Technological Innovations: Development of more efficient, precise, and user-friendly electroporation instruments, including automation and high-throughput capabilities.
- Growing R&D Investments: Significant investments in life sciences research and development by both public and private sectors.
Key Barriers & Challenges:
- High Cost of Advanced Instrumentation: Sophisticated electroporation systems can be expensive, limiting adoption by smaller research labs or in resource-constrained regions.
- Regulatory Hurdles for Therapeutic Applications: Navigating complex regulatory pathways for novel gene and cell therapies can slow market penetration.
- Competition from Alternative Transfection Methods: Chemical transfection reagents and viral vectors offer alternative solutions, sometimes at lower costs or with different advantages.
- Need for Specialized Expertise: Optimal use of electroporation often requires skilled personnel and standardized protocols, posing a barrier to entry for some users.
- Supply Chain Disruptions: Global supply chain challenges can impact the availability of essential components and consumables for instrument manufacturing.
Emerging Opportunities in Electroporation Instruments Industry
Emerging opportunities lie in the development of next-generation electroporation systems tailored for personalized medicine and point-of-care applications. Miniaturized, portable devices for in vivo gene delivery in therapeutic settings represent a significant untapped market. The growing field of synthetic biology also presents opportunities for novel electroporation applications in creating engineered organisms. Furthermore, the expansion of electroporation into non-biomedical applications, such as food science or environmental biotechnology, could open new avenues.
Growth Accelerators in the Electroporation Instruments Industry Industry
Growth accelerators for the Electroporation Instruments industry include continued breakthroughs in CRISPR/Cas9 and other gene editing technologies, which rely heavily on efficient gene delivery. Strategic partnerships between instrument manufacturers and leading biotechnology companies developing novel cell and gene therapies are crucial for co-development and market penetration. Furthermore, the increasing focus on GMP-compliant manufacturing solutions for biopharmaceuticals will drive the demand for scalable and automated electroporation systems, accelerating market expansion.
Key Players Shaping the Electroporation Instruments Industry Market
- Mirus Bio
- Promega Corporation
- Bio-Rad Laboratories Inc.
- Merck KGaA
- Lonza Group
- Altogen Biosystems
- Polyplus-transfection SA
- SignaGen Laboratories
- Qiagen NV
- Thermo Fisher Scientific
Notable Milestones in Electroporation Instruments Industry Sector
- September 2022: Polyplus, a leading upstream solutions provider for advanced biologic and cell and gene therapy production from research to commercial grade, continues to build out the mRNA support portfolio. The team has launched the in vivo-jetRNA+ transfection reagent for in vivo mRNA delivery using a preformed liposome.
- February 2022: Mirus Bio, a leading provider of delivery solutions within Gamma Biosciences, launched TransIT-VirusGEN SELECT Transfection Kits for large-scale viral vector production for cell and gene therapy applications.
In-Depth Electroporation Instruments Industry Market Outlook
The Electroporation Instruments industry is poised for sustained and accelerated growth, driven by the confluence of scientific innovation and increasing therapeutic demands. Future market potential is immense, particularly in the expanding frontiers of cell and gene therapy, where electroporation plays an indispensable role. Strategic opportunities include the development of more accessible and cost-effective solutions for emerging markets, enhanced integration of AI and automation for improved experimental design and data analysis, and the exploration of novel applications in regenerative medicine and diagnostics. The industry's ability to adapt to evolving regulatory landscapes and address the need for scalable, reproducible solutions will be critical in capitalizing on these burgeoning opportunities and solidifying its position as a cornerstone of modern biotechnology.
Electroporation Instruments Industry Segmentation
-
1. Method
- 1.1. Reagent-based Method
- 1.2. Instrument-based Method
- 1.3. Other Methods
-
2. Application
- 2.1. Biomedical Research
- 2.2. Therapeutic Delivery
- 2.3. Protein Production
Electroporation Instruments Industry Segmentation By Geography
-
1. North America
- 1.1. United States
- 1.2. Canada
- 1.3. Mexico
-
2. Europe
- 2.1. Germany
- 2.2. United Kingdom
- 2.3. France
- 2.4. Italy
- 2.5. Spain
- 2.6. Rest of Europe
-
3. Asia Pacific
- 3.1. China
- 3.2. Japan
- 3.3. India
- 3.4. Australia
- 3.5. South Korea
- 3.6. Rest of Asia Pacific
-
4. Middle East and Africa
- 4.1. GCC
- 4.2. South Africa
- 4.3. Rest of Middle East and Africa
-
5. South America
- 5.1. Brazil
- 5.2. Argentina
- 5.3. Rest of South America
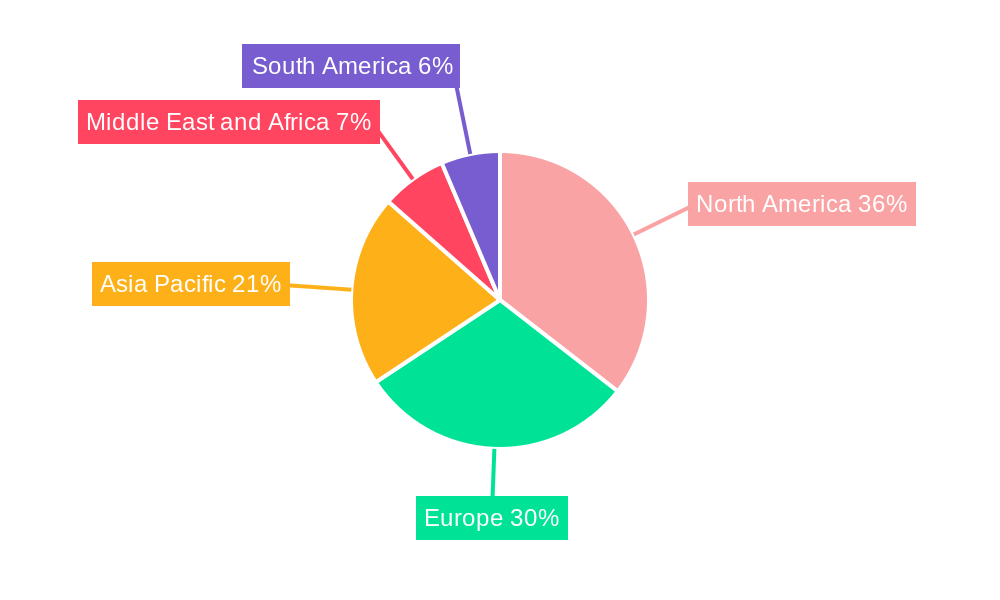
Electroporation Instruments Industry Regional Market Share
Geographic Coverage of Electroporation Instruments Industry
Electroporation Instruments Industry REPORT HIGHLIGHTS
| Aspects | Details |
|---|---|
| Study Period | 2020-2034 |
| Base Year | 2025 |
| Estimated Year | 2026 |
| Forecast Period | 2026-2034 |
| Historical Period | 2020-2025 |
| Growth Rate | CAGR of 7.73% from 2020-2034 |
| Segmentation |
|
Table of Contents
- 1. Introduction
- 1.1. Research Scope
- 1.2. Market Segmentation
- 1.3. Research Objective
- 1.4. Definitions and Assumptions
- 2. Executive Summary
- 2.1. Market Snapshot
- 3. Market Dynamics
- 3.1. Market Drivers
- 3.2. Market Restrains
- 3.3. Market Trends
- 3.4. Market Opportunities
- 4. Market Factor Analysis
- 4.1. Porters Five Forces
- 4.1.1. Bargaining Power of Suppliers
- 4.1.2. Bargaining Power of Buyers
- 4.1.3. Threat of New Entrants
- 4.1.4. Threat of Substitutes
- 4.1.5. Competitive Rivalry
- 4.2. PESTEL analysis
- 4.3. BCG Analysis
- 4.3.1. Stars (High Growth, High Market Share)
- 4.3.2. Cash Cows (Low Growth, High Market Share)
- 4.3.3. Question Mark (High Growth, Low Market Share)
- 4.3.4. Dogs (Low Growth, Low Market Share)
- 4.4. Ansoff Matrix Analysis
- 4.5. Supply Chain Analysis
- 4.6. Regulatory Landscape
- 4.7. Current Market Potential and Opportunity Assessment (TAM–SAM–SOM Framework)
- 4.8. VDR Analyst Note
- 4.1. Porters Five Forces
- 5. Market Analysis, Insights and Forecast 2021-2033
- 5.1. Market Analysis, Insights and Forecast - by Method
- 5.1.1. Reagent-based Method
- 5.1.2. Instrument-based Method
- 5.1.3. Other Methods
- 5.2. Market Analysis, Insights and Forecast - by Application
- 5.2.1. Biomedical Research
- 5.2.2. Therapeutic Delivery
- 5.2.3. Protein Production
- 5.3. Market Analysis, Insights and Forecast - by Region
- 5.3.1. North America
- 5.3.2. Europe
- 5.3.3. Asia Pacific
- 5.3.4. Middle East and Africa
- 5.3.5. South America
- 5.1. Market Analysis, Insights and Forecast - by Method
- 6. Global Electroporation Instruments Industry Analysis, Insights and Forecast, 2021-2033
- 6.1. Market Analysis, Insights and Forecast - by Method
- 6.1.1. Reagent-based Method
- 6.1.2. Instrument-based Method
- 6.1.3. Other Methods
- 6.2. Market Analysis, Insights and Forecast - by Application
- 6.2.1. Biomedical Research
- 6.2.2. Therapeutic Delivery
- 6.2.3. Protein Production
- 6.1. Market Analysis, Insights and Forecast - by Method
- 7. North America Electroporation Instruments Industry Analysis, Insights and Forecast, 2021-2033
- 7.1. Market Analysis, Insights and Forecast - by Method
- 7.1.1. Reagent-based Method
- 7.1.2. Instrument-based Method
- 7.1.3. Other Methods
- 7.2. Market Analysis, Insights and Forecast - by Application
- 7.2.1. Biomedical Research
- 7.2.2. Therapeutic Delivery
- 7.2.3. Protein Production
- 7.1. Market Analysis, Insights and Forecast - by Method
- 8. Europe Electroporation Instruments Industry Analysis, Insights and Forecast, 2021-2033
- 8.1. Market Analysis, Insights and Forecast - by Method
- 8.1.1. Reagent-based Method
- 8.1.2. Instrument-based Method
- 8.1.3. Other Methods
- 8.2. Market Analysis, Insights and Forecast - by Application
- 8.2.1. Biomedical Research
- 8.2.2. Therapeutic Delivery
- 8.2.3. Protein Production
- 8.1. Market Analysis, Insights and Forecast - by Method
- 9. Asia Pacific Electroporation Instruments Industry Analysis, Insights and Forecast, 2021-2033
- 9.1. Market Analysis, Insights and Forecast - by Method
- 9.1.1. Reagent-based Method
- 9.1.2. Instrument-based Method
- 9.1.3. Other Methods
- 9.2. Market Analysis, Insights and Forecast - by Application
- 9.2.1. Biomedical Research
- 9.2.2. Therapeutic Delivery
- 9.2.3. Protein Production
- 9.1. Market Analysis, Insights and Forecast - by Method
- 10. Middle East and Africa Electroporation Instruments Industry Analysis, Insights and Forecast, 2021-2033
- 10.1. Market Analysis, Insights and Forecast - by Method
- 10.1.1. Reagent-based Method
- 10.1.2. Instrument-based Method
- 10.1.3. Other Methods
- 10.2. Market Analysis, Insights and Forecast - by Application
- 10.2.1. Biomedical Research
- 10.2.2. Therapeutic Delivery
- 10.2.3. Protein Production
- 10.1. Market Analysis, Insights and Forecast - by Method
- 11. South America Electroporation Instruments Industry Analysis, Insights and Forecast, 2021-2033
- 11.1. Market Analysis, Insights and Forecast - by Method
- 11.1.1. Reagent-based Method
- 11.1.2. Instrument-based Method
- 11.1.3. Other Methods
- 11.2. Market Analysis, Insights and Forecast - by Application
- 11.2.1. Biomedical Research
- 11.2.2. Therapeutic Delivery
- 11.2.3. Protein Production
- 11.1. Market Analysis, Insights and Forecast - by Method
- 12. Competitive Analysis
- 12.1. Company Profiles
- 12.1.1 Mirus Bio
- 12.1.1.1. Company Overview
- 12.1.1.2. Products
- 12.1.1.3. Company Financials
- 12.1.1.4. SWOT Analysis
- 12.1.2 Promega Corporation
- 12.1.2.1. Company Overview
- 12.1.2.2. Products
- 12.1.2.3. Company Financials
- 12.1.2.4. SWOT Analysis
- 12.1.3 Bio-Rad Laboratories Inc
- 12.1.3.1. Company Overview
- 12.1.3.2. Products
- 12.1.3.3. Company Financials
- 12.1.3.4. SWOT Analysis
- 12.1.4 Merck KGaA
- 12.1.4.1. Company Overview
- 12.1.4.2. Products
- 12.1.4.3. Company Financials
- 12.1.4.4. SWOT Analysis
- 12.1.5 Lonza Group
- 12.1.5.1. Company Overview
- 12.1.5.2. Products
- 12.1.5.3. Company Financials
- 12.1.5.4. SWOT Analysis
- 12.1.6 Altogen Biosystems
- 12.1.6.1. Company Overview
- 12.1.6.2. Products
- 12.1.6.3. Company Financials
- 12.1.6.4. SWOT Analysis
- 12.1.7 Polyplus-transfection SA
- 12.1.7.1. Company Overview
- 12.1.7.2. Products
- 12.1.7.3. Company Financials
- 12.1.7.4. SWOT Analysis
- 12.1.8 SignaGen Laboratories
- 12.1.8.1. Company Overview
- 12.1.8.2. Products
- 12.1.8.3. Company Financials
- 12.1.8.4. SWOT Analysis
- 12.1.9 Qiagen NV
- 12.1.9.1. Company Overview
- 12.1.9.2. Products
- 12.1.9.3. Company Financials
- 12.1.9.4. SWOT Analysis
- 12.1.10 Thermo Fisher Scientific
- 12.1.10.1. Company Overview
- 12.1.10.2. Products
- 12.1.10.3. Company Financials
- 12.1.10.4. SWOT Analysis
- 12.1.1 Mirus Bio
- 12.2. Market Entropy
- 12.2.1 Company's Key Areas Served
- 12.2.2 Recent Developments
- 12.3. Company Market Share Analysis 2025
- 12.3.1 Top 5 Companies Market Share Analysis
- 12.3.2 Top 3 Companies Market Share Analysis
- 12.4. List of Potential Customers
- 13. Research Methodology
List of Figures
- Figure 1: Global Electroporation Instruments Industry Revenue Breakdown (million, %) by Region 2025 & 2033
- Figure 2: Global Electroporation Instruments Industry Volume Breakdown (K Unit, %) by Region 2025 & 2033
- Figure 3: North America Electroporation Instruments Industry Revenue (million), by Method 2025 & 2033
- Figure 4: North America Electroporation Instruments Industry Volume (K Unit), by Method 2025 & 2033
- Figure 5: North America Electroporation Instruments Industry Revenue Share (%), by Method 2025 & 2033
- Figure 6: North America Electroporation Instruments Industry Volume Share (%), by Method 2025 & 2033
- Figure 7: North America Electroporation Instruments Industry Revenue (million), by Application 2025 & 2033
- Figure 8: North America Electroporation Instruments Industry Volume (K Unit), by Application 2025 & 2033
- Figure 9: North America Electroporation Instruments Industry Revenue Share (%), by Application 2025 & 2033
- Figure 10: North America Electroporation Instruments Industry Volume Share (%), by Application 2025 & 2033
- Figure 11: North America Electroporation Instruments Industry Revenue (million), by Country 2025 & 2033
- Figure 12: North America Electroporation Instruments Industry Volume (K Unit), by Country 2025 & 2033
- Figure 13: North America Electroporation Instruments Industry Revenue Share (%), by Country 2025 & 2033
- Figure 14: North America Electroporation Instruments Industry Volume Share (%), by Country 2025 & 2033
- Figure 15: Europe Electroporation Instruments Industry Revenue (million), by Method 2025 & 2033
- Figure 16: Europe Electroporation Instruments Industry Volume (K Unit), by Method 2025 & 2033
- Figure 17: Europe Electroporation Instruments Industry Revenue Share (%), by Method 2025 & 2033
- Figure 18: Europe Electroporation Instruments Industry Volume Share (%), by Method 2025 & 2033
- Figure 19: Europe Electroporation Instruments Industry Revenue (million), by Application 2025 & 2033
- Figure 20: Europe Electroporation Instruments Industry Volume (K Unit), by Application 2025 & 2033
- Figure 21: Europe Electroporation Instruments Industry Revenue Share (%), by Application 2025 & 2033
- Figure 22: Europe Electroporation Instruments Industry Volume Share (%), by Application 2025 & 2033
- Figure 23: Europe Electroporation Instruments Industry Revenue (million), by Country 2025 & 2033
- Figure 24: Europe Electroporation Instruments Industry Volume (K Unit), by Country 2025 & 2033
- Figure 25: Europe Electroporation Instruments Industry Revenue Share (%), by Country 2025 & 2033
- Figure 26: Europe Electroporation Instruments Industry Volume Share (%), by Country 2025 & 2033
- Figure 27: Asia Pacific Electroporation Instruments Industry Revenue (million), by Method 2025 & 2033
- Figure 28: Asia Pacific Electroporation Instruments Industry Volume (K Unit), by Method 2025 & 2033
- Figure 29: Asia Pacific Electroporation Instruments Industry Revenue Share (%), by Method 2025 & 2033
- Figure 30: Asia Pacific Electroporation Instruments Industry Volume Share (%), by Method 2025 & 2033
- Figure 31: Asia Pacific Electroporation Instruments Industry Revenue (million), by Application 2025 & 2033
- Figure 32: Asia Pacific Electroporation Instruments Industry Volume (K Unit), by Application 2025 & 2033
- Figure 33: Asia Pacific Electroporation Instruments Industry Revenue Share (%), by Application 2025 & 2033
- Figure 34: Asia Pacific Electroporation Instruments Industry Volume Share (%), by Application 2025 & 2033
- Figure 35: Asia Pacific Electroporation Instruments Industry Revenue (million), by Country 2025 & 2033
- Figure 36: Asia Pacific Electroporation Instruments Industry Volume (K Unit), by Country 2025 & 2033
- Figure 37: Asia Pacific Electroporation Instruments Industry Revenue Share (%), by Country 2025 & 2033
- Figure 38: Asia Pacific Electroporation Instruments Industry Volume Share (%), by Country 2025 & 2033
- Figure 39: Middle East and Africa Electroporation Instruments Industry Revenue (million), by Method 2025 & 2033
- Figure 40: Middle East and Africa Electroporation Instruments Industry Volume (K Unit), by Method 2025 & 2033
- Figure 41: Middle East and Africa Electroporation Instruments Industry Revenue Share (%), by Method 2025 & 2033
- Figure 42: Middle East and Africa Electroporation Instruments Industry Volume Share (%), by Method 2025 & 2033
- Figure 43: Middle East and Africa Electroporation Instruments Industry Revenue (million), by Application 2025 & 2033
- Figure 44: Middle East and Africa Electroporation Instruments Industry Volume (K Unit), by Application 2025 & 2033
- Figure 45: Middle East and Africa Electroporation Instruments Industry Revenue Share (%), by Application 2025 & 2033
- Figure 46: Middle East and Africa Electroporation Instruments Industry Volume Share (%), by Application 2025 & 2033
- Figure 47: Middle East and Africa Electroporation Instruments Industry Revenue (million), by Country 2025 & 2033
- Figure 48: Middle East and Africa Electroporation Instruments Industry Volume (K Unit), by Country 2025 & 2033
- Figure 49: Middle East and Africa Electroporation Instruments Industry Revenue Share (%), by Country 2025 & 2033
- Figure 50: Middle East and Africa Electroporation Instruments Industry Volume Share (%), by Country 2025 & 2033
- Figure 51: South America Electroporation Instruments Industry Revenue (million), by Method 2025 & 2033
- Figure 52: South America Electroporation Instruments Industry Volume (K Unit), by Method 2025 & 2033
- Figure 53: South America Electroporation Instruments Industry Revenue Share (%), by Method 2025 & 2033
- Figure 54: South America Electroporation Instruments Industry Volume Share (%), by Method 2025 & 2033
- Figure 55: South America Electroporation Instruments Industry Revenue (million), by Application 2025 & 2033
- Figure 56: South America Electroporation Instruments Industry Volume (K Unit), by Application 2025 & 2033
- Figure 57: South America Electroporation Instruments Industry Revenue Share (%), by Application 2025 & 2033
- Figure 58: South America Electroporation Instruments Industry Volume Share (%), by Application 2025 & 2033
- Figure 59: South America Electroporation Instruments Industry Revenue (million), by Country 2025 & 2033
- Figure 60: South America Electroporation Instruments Industry Volume (K Unit), by Country 2025 & 2033
- Figure 61: South America Electroporation Instruments Industry Revenue Share (%), by Country 2025 & 2033
- Figure 62: South America Electroporation Instruments Industry Volume Share (%), by Country 2025 & 2033
List of Tables
- Table 1: Global Electroporation Instruments Industry Revenue million Forecast, by Method 2020 & 2033
- Table 2: Global Electroporation Instruments Industry Volume K Unit Forecast, by Method 2020 & 2033
- Table 3: Global Electroporation Instruments Industry Revenue million Forecast, by Application 2020 & 2033
- Table 4: Global Electroporation Instruments Industry Volume K Unit Forecast, by Application 2020 & 2033
- Table 5: Global Electroporation Instruments Industry Revenue million Forecast, by Region 2020 & 2033
- Table 6: Global Electroporation Instruments Industry Volume K Unit Forecast, by Region 2020 & 2033
- Table 7: Global Electroporation Instruments Industry Revenue million Forecast, by Method 2020 & 2033
- Table 8: Global Electroporation Instruments Industry Volume K Unit Forecast, by Method 2020 & 2033
- Table 9: Global Electroporation Instruments Industry Revenue million Forecast, by Application 2020 & 2033
- Table 10: Global Electroporation Instruments Industry Volume K Unit Forecast, by Application 2020 & 2033
- Table 11: Global Electroporation Instruments Industry Revenue million Forecast, by Country 2020 & 2033
- Table 12: Global Electroporation Instruments Industry Volume K Unit Forecast, by Country 2020 & 2033
- Table 13: United States Electroporation Instruments Industry Revenue (million) Forecast, by Application 2020 & 2033
- Table 14: United States Electroporation Instruments Industry Volume (K Unit) Forecast, by Application 2020 & 2033
- Table 15: Canada Electroporation Instruments Industry Revenue (million) Forecast, by Application 2020 & 2033
- Table 16: Canada Electroporation Instruments Industry Volume (K Unit) Forecast, by Application 2020 & 2033
- Table 17: Mexico Electroporation Instruments Industry Revenue (million) Forecast, by Application 2020 & 2033
- Table 18: Mexico Electroporation Instruments Industry Volume (K Unit) Forecast, by Application 2020 & 2033
- Table 19: Global Electroporation Instruments Industry Revenue million Forecast, by Method 2020 & 2033
- Table 20: Global Electroporation Instruments Industry Volume K Unit Forecast, by Method 2020 & 2033
- Table 21: Global Electroporation Instruments Industry Revenue million Forecast, by Application 2020 & 2033
- Table 22: Global Electroporation Instruments Industry Volume K Unit Forecast, by Application 2020 & 2033
- Table 23: Global Electroporation Instruments Industry Revenue million Forecast, by Country 2020 & 2033
- Table 24: Global Electroporation Instruments Industry Volume K Unit Forecast, by Country 2020 & 2033
- Table 25: Germany Electroporation Instruments Industry Revenue (million) Forecast, by Application 2020 & 2033
- Table 26: Germany Electroporation Instruments Industry Volume (K Unit) Forecast, by Application 2020 & 2033
- Table 27: United Kingdom Electroporation Instruments Industry Revenue (million) Forecast, by Application 2020 & 2033
- Table 28: United Kingdom Electroporation Instruments Industry Volume (K Unit) Forecast, by Application 2020 & 2033
- Table 29: France Electroporation Instruments Industry Revenue (million) Forecast, by Application 2020 & 2033
- Table 30: France Electroporation Instruments Industry Volume (K Unit) Forecast, by Application 2020 & 2033
- Table 31: Italy Electroporation Instruments Industry Revenue (million) Forecast, by Application 2020 & 2033
- Table 32: Italy Electroporation Instruments Industry Volume (K Unit) Forecast, by Application 2020 & 2033
- Table 33: Spain Electroporation Instruments Industry Revenue (million) Forecast, by Application 2020 & 2033
- Table 34: Spain Electroporation Instruments Industry Volume (K Unit) Forecast, by Application 2020 & 2033
- Table 35: Rest of Europe Electroporation Instruments Industry Revenue (million) Forecast, by Application 2020 & 2033
- Table 36: Rest of Europe Electroporation Instruments Industry Volume (K Unit) Forecast, by Application 2020 & 2033
- Table 37: Global Electroporation Instruments Industry Revenue million Forecast, by Method 2020 & 2033
- Table 38: Global Electroporation Instruments Industry Volume K Unit Forecast, by Method 2020 & 2033
- Table 39: Global Electroporation Instruments Industry Revenue million Forecast, by Application 2020 & 2033
- Table 40: Global Electroporation Instruments Industry Volume K Unit Forecast, by Application 2020 & 2033
- Table 41: Global Electroporation Instruments Industry Revenue million Forecast, by Country 2020 & 2033
- Table 42: Global Electroporation Instruments Industry Volume K Unit Forecast, by Country 2020 & 2033
- Table 43: China Electroporation Instruments Industry Revenue (million) Forecast, by Application 2020 & 2033
- Table 44: China Electroporation Instruments Industry Volume (K Unit) Forecast, by Application 2020 & 2033
- Table 45: Japan Electroporation Instruments Industry Revenue (million) Forecast, by Application 2020 & 2033
- Table 46: Japan Electroporation Instruments Industry Volume (K Unit) Forecast, by Application 2020 & 2033
- Table 47: India Electroporation Instruments Industry Revenue (million) Forecast, by Application 2020 & 2033
- Table 48: India Electroporation Instruments Industry Volume (K Unit) Forecast, by Application 2020 & 2033
- Table 49: Australia Electroporation Instruments Industry Revenue (million) Forecast, by Application 2020 & 2033
- Table 50: Australia Electroporation Instruments Industry Volume (K Unit) Forecast, by Application 2020 & 2033
- Table 51: South Korea Electroporation Instruments Industry Revenue (million) Forecast, by Application 2020 & 2033
- Table 52: South Korea Electroporation Instruments Industry Volume (K Unit) Forecast, by Application 2020 & 2033
- Table 53: Rest of Asia Pacific Electroporation Instruments Industry Revenue (million) Forecast, by Application 2020 & 2033
- Table 54: Rest of Asia Pacific Electroporation Instruments Industry Volume (K Unit) Forecast, by Application 2020 & 2033
- Table 55: Global Electroporation Instruments Industry Revenue million Forecast, by Method 2020 & 2033
- Table 56: Global Electroporation Instruments Industry Volume K Unit Forecast, by Method 2020 & 2033
- Table 57: Global Electroporation Instruments Industry Revenue million Forecast, by Application 2020 & 2033
- Table 58: Global Electroporation Instruments Industry Volume K Unit Forecast, by Application 2020 & 2033
- Table 59: Global Electroporation Instruments Industry Revenue million Forecast, by Country 2020 & 2033
- Table 60: Global Electroporation Instruments Industry Volume K Unit Forecast, by Country 2020 & 2033
- Table 61: GCC Electroporation Instruments Industry Revenue (million) Forecast, by Application 2020 & 2033
- Table 62: GCC Electroporation Instruments Industry Volume (K Unit) Forecast, by Application 2020 & 2033
- Table 63: South Africa Electroporation Instruments Industry Revenue (million) Forecast, by Application 2020 & 2033
- Table 64: South Africa Electroporation Instruments Industry Volume (K Unit) Forecast, by Application 2020 & 2033
- Table 65: Rest of Middle East and Africa Electroporation Instruments Industry Revenue (million) Forecast, by Application 2020 & 2033
- Table 66: Rest of Middle East and Africa Electroporation Instruments Industry Volume (K Unit) Forecast, by Application 2020 & 2033
- Table 67: Global Electroporation Instruments Industry Revenue million Forecast, by Method 2020 & 2033
- Table 68: Global Electroporation Instruments Industry Volume K Unit Forecast, by Method 2020 & 2033
- Table 69: Global Electroporation Instruments Industry Revenue million Forecast, by Application 2020 & 2033
- Table 70: Global Electroporation Instruments Industry Volume K Unit Forecast, by Application 2020 & 2033
- Table 71: Global Electroporation Instruments Industry Revenue million Forecast, by Country 2020 & 2033
- Table 72: Global Electroporation Instruments Industry Volume K Unit Forecast, by Country 2020 & 2033
- Table 73: Brazil Electroporation Instruments Industry Revenue (million) Forecast, by Application 2020 & 2033
- Table 74: Brazil Electroporation Instruments Industry Volume (K Unit) Forecast, by Application 2020 & 2033
- Table 75: Argentina Electroporation Instruments Industry Revenue (million) Forecast, by Application 2020 & 2033
- Table 76: Argentina Electroporation Instruments Industry Volume (K Unit) Forecast, by Application 2020 & 2033
- Table 77: Rest of South America Electroporation Instruments Industry Revenue (million) Forecast, by Application 2020 & 2033
- Table 78: Rest of South America Electroporation Instruments Industry Volume (K Unit) Forecast, by Application 2020 & 2033
Frequently Asked Questions
1. What is the projected Compound Annual Growth Rate (CAGR) of the Electroporation Instruments Industry?
The projected CAGR is approximately 7.73%.
2. Which companies are prominent players in the Electroporation Instruments Industry?
Key companies in the market include Mirus Bio, Promega Corporation, Bio-Rad Laboratories Inc, Merck KGaA, Lonza Group, Altogen Biosystems, Polyplus-transfection SA, SignaGen Laboratories, Qiagen NV, Thermo Fisher Scientific.
3. What are the main segments of the Electroporation Instruments Industry?
The market segments include Method, Application.
4. Can you provide details about the market size?
The market size is estimated to be USD 974.92 million as of 2022.
5. What are some drivers contributing to market growth?
Rising Incidences of Chronic Diseases; Increase in Research & Development in the Field of Cell Based Therapies.
6. What are the notable trends driving market growth?
Reagent-based Method is Showing Significant Growth in the Transfection Technologies Market.
7. Are there any restraints impacting market growth?
High Cost of Transfection Technology Instruments.
8. Can you provide examples of recent developments in the market?
September 2022: Polyplus, a leading upstream solutions provider for advanced biologic and cell and gene therapy production from research to commercial grade, continues to build out the mRNA support portfolio. The team has launched the in vivo-jetRNA+ transfection reagent for in vivo mRNA delivery using a preformed liposome.
9. What pricing options are available for accessing the report?
Pricing options include single-user, multi-user, and enterprise licenses priced at USD 4750, USD 5250, and USD 8750 respectively.
10. Is the market size provided in terms of value or volume?
The market size is provided in terms of value, measured in million and volume, measured in K Unit.
11. Are there any specific market keywords associated with the report?
Yes, the market keyword associated with the report is "Electroporation Instruments Industry," which aids in identifying and referencing the specific market segment covered.
12. How do I determine which pricing option suits my needs best?
The pricing options vary based on user requirements and access needs. Individual users may opt for single-user licenses, while businesses requiring broader access may choose multi-user or enterprise licenses for cost-effective access to the report.
13. Are there any additional resources or data provided in the Electroporation Instruments Industry report?
While the report offers comprehensive insights, it's advisable to review the specific contents or supplementary materials provided to ascertain if additional resources or data are available.
14. How can I stay updated on further developments or reports in the Electroporation Instruments Industry?
To stay informed about further developments, trends, and reports in the Electroporation Instruments Industry, consider subscribing to industry newsletters, following relevant companies and organizations, or regularly checking reputable industry news sources and publications.
Methodology
Step 1 - Identification of Relevant Samples Size from Population Database


Step 2 - Approaches for Defining Global Market Size (Value, Volume* & Price*)

Note*: In applicable scenarios
Step 3 - Data Sources
Primary Research
- Web Analytics
- Survey Reports
- Research Institute
- Latest Research Reports
- Opinion Leaders
Secondary Research
- Annual Reports
- White Paper
- Latest Press Release
- Industry Association
- Paid Database
- Investor Presentations

Step 4 - Data Triangulation
Involves using different sources of information in order to increase the validity of a study
These sources are likely to be stakeholders in a program - participants, other researchers, program staff, other community members, and so on.
Then we put all data in single framework & apply various statistical tools to find out the dynamic on the market.
During the analysis stage, feedback from the stakeholder groups would be compared to determine areas of agreement as well as areas of divergence