
Key Insights
The Electronic Contract Assembly (ECA) market is experiencing robust growth, driven by increasing demand for electronics across diverse sectors like healthcare, automotive, and IT & Telecom. The market's Compound Annual Growth Rate (CAGR) of 9.20% from 2019 to 2024 indicates a significant expansion, projected to continue throughout the forecast period (2025-2033). Key drivers include the rising adoption of sophisticated electronics in automobiles (e.g., advanced driver-assistance systems), the miniaturization of electronic components demanding specialized assembly expertise, and the growing prevalence of connected devices fueling demand in the IT and Telecom sectors. Furthermore, the increasing outsourcing of manufacturing processes by original equipment manufacturers (OEMs) to focus on core competencies is significantly boosting market growth. Segment-wise, PCB assembly services currently hold the largest market share, followed by cable/harness assembly services, reflecting the foundational role of printed circuit boards in most electronic devices. Geographically, North America and Asia-Pacific are major contributors to the market's overall size, driven by robust technological advancements and a large manufacturing base in these regions. However, the market faces some constraints, including supply chain disruptions, rising labor costs in certain regions, and the increasing complexity of electronic assemblies requiring specialized skills and equipment. These challenges are being addressed through automation, strategic partnerships, and the development of skilled workforces.
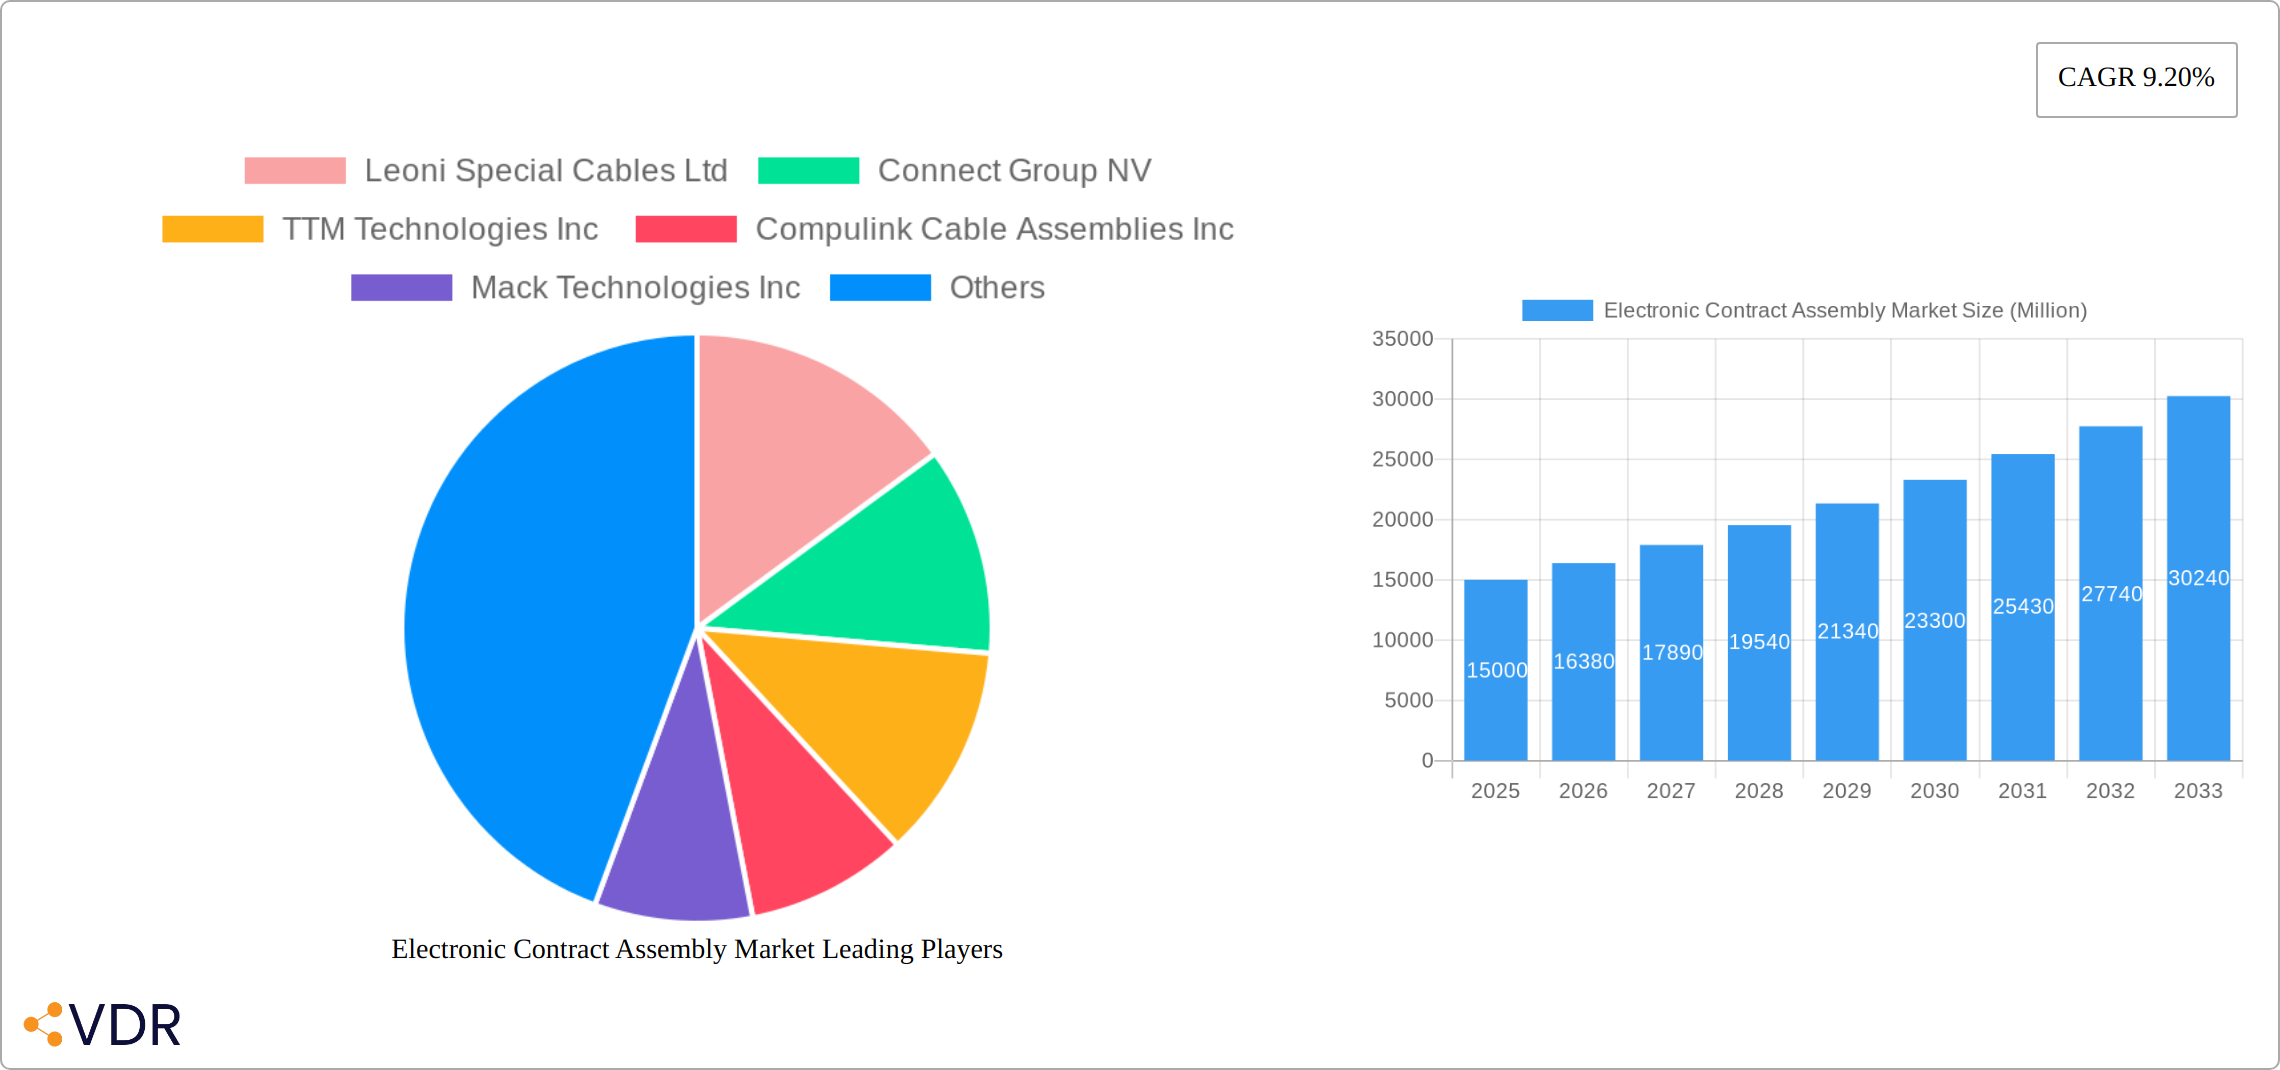
The market's future trajectory is promising, with continued growth anticipated across all major segments and regions. Emerging trends such as the Internet of Things (IoT), increasing demand for 5G technology, and the rising adoption of electric vehicles are poised to significantly contribute to market expansion in the coming years. Companies like Leoni Special Cables Ltd, Connect Group NV, and TTM Technologies Inc are major players, competing based on factors such as manufacturing capabilities, technological expertise, and geographical reach. Strategic acquisitions, technological innovations, and partnerships are expected to shape the competitive landscape in the coming decade, with a focus on offering customized solutions and meeting the evolving needs of diverse industries. The ECA market's continued growth hinges on adapting to technological advancements, mitigating supply chain vulnerabilities, and fostering a skilled workforce capable of handling increasingly complex assembly processes.
Electronic Contract Assembly Market: A Comprehensive Market Report (2019-2033)
This in-depth report provides a comprehensive analysis of the Electronic Contract Assembly market, encompassing market dynamics, growth trends, regional dominance, product landscape, key players, and future outlook. With a focus on parent markets (Electronics Manufacturing Services) and child markets (PCB Assembly, Cable/Harness Assembly, Membrane Switch Assembly), this report offers invaluable insights for industry professionals, investors, and strategic decision-makers. The study period covers 2019-2033, with a base year of 2025 and a forecast period of 2025-2033. The market size is presented in million units.
Electronic Contract Assembly Market Market Dynamics & Structure
The Electronic Contract Assembly market is characterized by moderate concentration, with several key players holding significant market share. Technological innovation, particularly in automation and miniaturization, is a primary growth driver. Stringent regulatory frameworks, particularly concerning environmental compliance and product safety, influence manufacturing processes. Competitive substitutes, such as in-house assembly, pose a challenge, although the advantages of specialized contract assembly often outweigh the cost. M&A activity is moderate, with strategic acquisitions aiming to expand geographic reach and technological capabilities.
- Market Concentration: Moderately concentrated, with the top 5 players holding approximately xx% of the market share in 2024.
- Technological Innovation: Focus on automation (e.g., SMT placement, automated optical inspection), miniaturization, and advanced materials.
- Regulatory Frameworks: Compliance with RoHS, REACH, and other relevant regulations impacting material selection and waste management.
- Competitive Substitutes: In-house assembly, representing a significant, albeit smaller, portion of the market (approximately xx%).
- End-User Demographics: Diverse, spanning healthcare, automotive, industrial, IT & telecom, and other applications.
- M&A Trends: Moderate activity, driven by expansion into new markets and technological capabilities. Approximately xx M&A deals were recorded between 2019 and 2024.
Electronic Contract Assembly Market Growth Trends & Insights
The Electronic Contract Assembly market demonstrated robust growth from 2019 to 2024, fueled by the escalating demand for electronic devices across diverse sectors. This trajectory is projected to continue, with a healthy CAGR of [Insert Precise CAGR]% anticipated throughout the forecast period (2025-2033), culminating in a market valuation of [Insert Precise Market Size in Units/Dollars] by 2033. Several key factors underpin this expansion: the ongoing miniaturization and enhanced functionality of electronic devices driven by technological advancements; the rising adoption rates in burgeoning economies; and the evolving consumer preferences towards interconnected devices and smart technologies. Further accelerating this growth are significant technological disruptions, such as the proliferation of 5G and the Internet of Things (IoT), coupled with increased automation leading to improved efficiency and cost reductions. Market penetration is expected to reach [Insert Precise Penetration Percentage]% by 2033.
Dominant Regions, Countries, or Segments in Electronic Contract Assembly Market
North America and the Asia-Pacific region are currently the leading markets for Electronic Contract Assembly, driven by substantial demand from the automotive, healthcare, and electronics industries. Within these regions, China and the United States command significant market shares. This dominance is attributed to factors such as established manufacturing infrastructure, robust technological capabilities, and substantial consumer bases.
Dominant Segments:
- Type of Activity: PCB Assembly Services maintains the largest market share at [Insert Precise Percentage]%, followed by Cable/Harness Assembly Services at [Insert Precise Percentage]% and Membrane/Keypad Switch Assembly Services at [Insert Precise Percentage]%. This reflects the pervasive use of PCBs across diverse electronic applications and the increasing demand for complex cable and interconnect solutions.
- Application: The Automotive sector emerges as the dominant application area, accounting for [Insert Precise Percentage]% of the market. This is a direct result of the growing integration of advanced electronic systems in modern vehicles. The Healthcare segment showcases considerable growth potential, with a projected growth rate of [Insert Precise Percentage]%, driven by the continuous development of sophisticated medical devices.
Key Drivers by Region:
- North America: This region benefits from strong demand from the automotive and healthcare industries, coupled with advanced technological infrastructure, a skilled workforce, and established regulatory frameworks that ensure high product quality and safety standards.
- Asia-Pacific: Rapid economic expansion, the escalating adoption of consumer electronics, and a vast manufacturing base are key drivers in this region. China, in particular, benefits from a comprehensive manufacturing ecosystem and supportive government policies aimed at boosting the electronics sector. Other countries in the region are also experiencing significant growth due to their rising technological capabilities and expanding consumer markets.
Electronic Contract Assembly Market Product Landscape
The Electronic Contract Assembly market offers a diverse range of services, including PCB assembly, cable/harness assembly, and membrane/keypad switch assembly. Recent product innovations focus on advanced automation technologies, high-precision assembly, and environmentally friendly materials. Key performance metrics include assembly speed, accuracy, defect rate, and cost-effectiveness. Unique selling propositions center on customized solutions, fast turnaround times, and adherence to stringent quality standards. Technological advancements encompass the integration of AI and machine learning in automated assembly lines.
Key Drivers, Barriers & Challenges in Electronic Contract Assembly Market
Key Drivers:
- Increasing demand for electronics across various sectors.
- Technological advancements driving miniaturization and increased functionality.
- Rising adoption rates in emerging economies.
- Growth of IoT and 5G technologies.
Key Challenges and Restraints:
- Supply chain disruptions impacting raw material availability and lead times.
- Stringent regulatory compliance requirements increasing manufacturing costs.
- Intense competition from established players and new entrants.
- Skilled labor shortages in certain regions. This shortage represents approximately xx% of the workforce.
Emerging Opportunities in Electronic Contract Assembly Market
- Expansion into Untapped Markets: Significant opportunities exist in developing economies with burgeoning middle classes and increasing demand for electronic devices. Strategic market entry and localization strategies are crucial for success in these regions.
- Specialized Assembly Services: Meeting the specialized needs of niche sectors such as medical devices, aerospace, and defense offers high-margin opportunities. This requires developing specialized expertise and adhering to stringent quality and regulatory requirements.
- Sustainable Assembly Processes: Growing environmental consciousness is driving demand for eco-friendly manufacturing processes, including the use of recycled materials and reduced energy consumption. Companies adopting sustainable practices gain a competitive edge and enhance their brand image.
- Integration of Advanced Technologies: The incorporation of artificial intelligence (AI) and robotics in assembly processes can dramatically improve efficiency, precision, and cost-effectiveness, leading to significant competitive advantages.
Growth Accelerators in the Electronic Contract Assembly Market Industry
Continuous technological advancements in automation and miniaturization are key catalysts for market expansion. Strategic collaborations between contract manufacturers and technology providers are crucial for fostering innovation and broadening market reach. Furthermore, effective market expansion strategies focused on emerging markets and diversification across application sectors are driving sustainable, long-term growth. These strategies often include establishing local partnerships, understanding cultural nuances, and adapting products to meet specific regional needs.
Key Players Shaping the Electronic Contract Assembly Market Market
- Leoni Special Cables Ltd
- Connect Group NV
- TTM Technologies Inc
- Compulink Cable Assemblies Inc
- Mack Technologies Inc
- ATL Technology
- Amphenol Interconnect Products Corp (AIPC)
- Season Group International Co Ltd
- Volex Group PLC
Notable Milestones in Electronic Contract Assembly Market Sector
- October 2021: Amphenol's launch of a new range of robust display solutions (Mini DisplayPort and HDMI connectors) for harsh environments highlights the ongoing innovation in connectivity technologies and the increasing demand for durable components in various applications.
- November 2020: Advanced Circuits' introduction of "PCB Artist," a free PCB design software, exemplifies the industry's commitment to simplifying the design process and fostering accessibility for smaller companies and independent designers.
- [Add more recent milestones with descriptions and dates]
In-Depth Electronic Contract Assembly Market Market Outlook
The Electronic Contract Assembly market is poised for sustained growth driven by ongoing technological advancements, increasing demand for electronics across various industries, and expansion into new geographical markets. Strategic partnerships, investments in automation, and focus on sustainable practices will be crucial for success in this dynamic market. The market’s potential for innovation and its role in enabling technological advancements across other sectors ensure its continued strong performance in the coming years.
Electronic Contract Assembly Market Segmentation
-
1. Type of Activity
- 1.1. PCB Assembly Services
- 1.2. Cable/Harness Assembly Services
- 1.3. Membrane/Keypad Switch Assembly Services
-
2. Application
- 2.1. Healthcare
- 2.2. Automotive
- 2.3. Industrial
- 2.4. IT and Telecom
- 2.5. Other Applications
Electronic Contract Assembly Market Segmentation By Geography
-
1. North America
- 1.1. United States
- 1.2. Canada
-
2. Europe
- 2.1. United Kingdom
- 2.2. Germany
- 2.3. France
- 2.4. Rest of Europe
-
3. Asia Pacific
- 3.1. China
- 3.2. Japan
- 3.3. India
- 3.4. Rest of Asia Pacific
-
4. Latin America
- 4.1. Brazil
- 4.2. Argentina
- 4.3. Rest of South America
-
5. Middle East and Africa
- 5.1. UAE
- 5.2. South Africa
- 5.3. Saudi Arabia
- 5.4. Rest Of MEA

Electronic Contract Assembly Market REPORT HIGHLIGHTS
| Aspects | Details |
|---|---|
| Study Period | 2019-2033 |
| Base Year | 2024 |
| Estimated Year | 2025 |
| Forecast Period | 2025-2033 |
| Historical Period | 2019-2024 |
| Growth Rate | CAGR of 9.20% from 2019-2033 |
| Segmentation |
|
Table of Contents
- 1. Introduction
- 1.1. Research Scope
- 1.2. Market Segmentation
- 1.3. Research Methodology
- 1.4. Definitions and Assumptions
- 2. Executive Summary
- 2.1. Introduction
- 3. Market Dynamics
- 3.1. Introduction
- 3.2. Market Drivers
- 3.2.1. Increasing Popularity of MEMS Technology; Increasing demand of water treatment facilities in the region
- 3.3. Market Restrains
- 3.3.1. ; Lack of Standard Protocols for the Development of Power Modules; Slow Adoption of New Technologies Derailing Innovation
- 3.4. Market Trends
- 3.4.1. Consumer Electronics to Drive the Market Growth
- 4. Market Factor Analysis
- 4.1. Porters Five Forces
- 4.2. Supply/Value Chain
- 4.3. PESTEL analysis
- 4.4. Market Entropy
- 4.5. Patent/Trademark Analysis
- 5. Global Electronic Contract Assembly Market Analysis, Insights and Forecast, 2019-2031
- 5.1. Market Analysis, Insights and Forecast - by Type of Activity
- 5.1.1. PCB Assembly Services
- 5.1.2. Cable/Harness Assembly Services
- 5.1.3. Membrane/Keypad Switch Assembly Services
- 5.2. Market Analysis, Insights and Forecast - by Application
- 5.2.1. Healthcare
- 5.2.2. Automotive
- 5.2.3. Industrial
- 5.2.4. IT and Telecom
- 5.2.5. Other Applications
- 5.3. Market Analysis, Insights and Forecast - by Region
- 5.3.1. North America
- 5.3.2. Europe
- 5.3.3. Asia Pacific
- 5.3.4. Latin America
- 5.3.5. Middle East and Africa
- 5.1. Market Analysis, Insights and Forecast - by Type of Activity
- 6. North America Electronic Contract Assembly Market Analysis, Insights and Forecast, 2019-2031
- 6.1. Market Analysis, Insights and Forecast - by Type of Activity
- 6.1.1. PCB Assembly Services
- 6.1.2. Cable/Harness Assembly Services
- 6.1.3. Membrane/Keypad Switch Assembly Services
- 6.2. Market Analysis, Insights and Forecast - by Application
- 6.2.1. Healthcare
- 6.2.2. Automotive
- 6.2.3. Industrial
- 6.2.4. IT and Telecom
- 6.2.5. Other Applications
- 6.1. Market Analysis, Insights and Forecast - by Type of Activity
- 7. Europe Electronic Contract Assembly Market Analysis, Insights and Forecast, 2019-2031
- 7.1. Market Analysis, Insights and Forecast - by Type of Activity
- 7.1.1. PCB Assembly Services
- 7.1.2. Cable/Harness Assembly Services
- 7.1.3. Membrane/Keypad Switch Assembly Services
- 7.2. Market Analysis, Insights and Forecast - by Application
- 7.2.1. Healthcare
- 7.2.2. Automotive
- 7.2.3. Industrial
- 7.2.4. IT and Telecom
- 7.2.5. Other Applications
- 7.1. Market Analysis, Insights and Forecast - by Type of Activity
- 8. Asia Pacific Electronic Contract Assembly Market Analysis, Insights and Forecast, 2019-2031
- 8.1. Market Analysis, Insights and Forecast - by Type of Activity
- 8.1.1. PCB Assembly Services
- 8.1.2. Cable/Harness Assembly Services
- 8.1.3. Membrane/Keypad Switch Assembly Services
- 8.2. Market Analysis, Insights and Forecast - by Application
- 8.2.1. Healthcare
- 8.2.2. Automotive
- 8.2.3. Industrial
- 8.2.4. IT and Telecom
- 8.2.5. Other Applications
- 8.1. Market Analysis, Insights and Forecast - by Type of Activity
- 9. Latin America Electronic Contract Assembly Market Analysis, Insights and Forecast, 2019-2031
- 9.1. Market Analysis, Insights and Forecast - by Type of Activity
- 9.1.1. PCB Assembly Services
- 9.1.2. Cable/Harness Assembly Services
- 9.1.3. Membrane/Keypad Switch Assembly Services
- 9.2. Market Analysis, Insights and Forecast - by Application
- 9.2.1. Healthcare
- 9.2.2. Automotive
- 9.2.3. Industrial
- 9.2.4. IT and Telecom
- 9.2.5. Other Applications
- 9.1. Market Analysis, Insights and Forecast - by Type of Activity
- 10. Middle East and Africa Electronic Contract Assembly Market Analysis, Insights and Forecast, 2019-2031
- 10.1. Market Analysis, Insights and Forecast - by Type of Activity
- 10.1.1. PCB Assembly Services
- 10.1.2. Cable/Harness Assembly Services
- 10.1.3. Membrane/Keypad Switch Assembly Services
- 10.2. Market Analysis, Insights and Forecast - by Application
- 10.2.1. Healthcare
- 10.2.2. Automotive
- 10.2.3. Industrial
- 10.2.4. IT and Telecom
- 10.2.5. Other Applications
- 10.1. Market Analysis, Insights and Forecast - by Type of Activity
- 11. North America Electronic Contract Assembly Market Analysis, Insights and Forecast, 2019-2031
- 11.1. Market Analysis, Insights and Forecast - By Country/Sub-region
- 11.1.1 United States
- 11.1.2 Canada
- 11.1.3 Mexico
- 12. Europe Electronic Contract Assembly Market Analysis, Insights and Forecast, 2019-2031
- 12.1. Market Analysis, Insights and Forecast - By Country/Sub-region
- 12.1.1 Germany
- 12.1.2 United Kingdom
- 12.1.3 France
- 12.1.4 Spain
- 12.1.5 Italy
- 12.1.6 Spain
- 12.1.7 Belgium
- 12.1.8 Netherland
- 12.1.9 Nordics
- 12.1.10 Rest of Europe
- 13. Asia Pacific Electronic Contract Assembly Market Analysis, Insights and Forecast, 2019-2031
- 13.1. Market Analysis, Insights and Forecast - By Country/Sub-region
- 13.1.1 China
- 13.1.2 Japan
- 13.1.3 India
- 13.1.4 South Korea
- 13.1.5 Southeast Asia
- 13.1.6 Australia
- 13.1.7 Indonesia
- 13.1.8 Phillipes
- 13.1.9 Singapore
- 13.1.10 Thailandc
- 13.1.11 Rest of Asia Pacific
- 14. South America Electronic Contract Assembly Market Analysis, Insights and Forecast, 2019-2031
- 14.1. Market Analysis, Insights and Forecast - By Country/Sub-region
- 14.1.1 Brazil
- 14.1.2 Argentina
- 14.1.3 Peru
- 14.1.4 Chile
- 14.1.5 Colombia
- 14.1.6 Ecuador
- 14.1.7 Venezuela
- 14.1.8 Rest of South America
- 15. North America Electronic Contract Assembly Market Analysis, Insights and Forecast, 2019-2031
- 15.1. Market Analysis, Insights and Forecast - By Country/Sub-region
- 15.1.1 United States
- 15.1.2 Canada
- 15.1.3 Mexico
- 16. MEA Electronic Contract Assembly Market Analysis, Insights and Forecast, 2019-2031
- 16.1. Market Analysis, Insights and Forecast - By Country/Sub-region
- 16.1.1 United Arab Emirates
- 16.1.2 Saudi Arabia
- 16.1.3 South Africa
- 16.1.4 Rest of Middle East and Africa
- 17. Competitive Analysis
- 17.1. Global Market Share Analysis 2024
- 17.2. Company Profiles
- 17.2.1 Leoni Special Cables Ltd
- 17.2.1.1. Overview
- 17.2.1.2. Products
- 17.2.1.3. SWOT Analysis
- 17.2.1.4. Recent Developments
- 17.2.1.5. Financials (Based on Availability)
- 17.2.2 Connect Group NV
- 17.2.2.1. Overview
- 17.2.2.2. Products
- 17.2.2.3. SWOT Analysis
- 17.2.2.4. Recent Developments
- 17.2.2.5. Financials (Based on Availability)
- 17.2.3 TTM Technologies Inc
- 17.2.3.1. Overview
- 17.2.3.2. Products
- 17.2.3.3. SWOT Analysis
- 17.2.3.4. Recent Developments
- 17.2.3.5. Financials (Based on Availability)
- 17.2.4 Compulink Cable Assemblies Inc
- 17.2.4.1. Overview
- 17.2.4.2. Products
- 17.2.4.3. SWOT Analysis
- 17.2.4.4. Recent Developments
- 17.2.4.5. Financials (Based on Availability)
- 17.2.5 Mack Technologies Inc
- 17.2.5.1. Overview
- 17.2.5.2. Products
- 17.2.5.3. SWOT Analysis
- 17.2.5.4. Recent Developments
- 17.2.5.5. Financials (Based on Availability)
- 17.2.6 ATL Technology
- 17.2.6.1. Overview
- 17.2.6.2. Products
- 17.2.6.3. SWOT Analysis
- 17.2.6.4. Recent Developments
- 17.2.6.5. Financials (Based on Availability)
- 17.2.7 Amphenol Interconnect Products Corp (AIPC)
- 17.2.7.1. Overview
- 17.2.7.2. Products
- 17.2.7.3. SWOT Analysis
- 17.2.7.4. Recent Developments
- 17.2.7.5. Financials (Based on Availability)
- 17.2.8 Season Group International Co Ltd
- 17.2.8.1. Overview
- 17.2.8.2. Products
- 17.2.8.3. SWOT Analysis
- 17.2.8.4. Recent Developments
- 17.2.8.5. Financials (Based on Availability)
- 17.2.9 Volex Group PLC
- 17.2.9.1. Overview
- 17.2.9.2. Products
- 17.2.9.3. SWOT Analysis
- 17.2.9.4. Recent Developments
- 17.2.9.5. Financials (Based on Availability)
- 17.2.1 Leoni Special Cables Ltd
List of Figures
- Figure 1: Global Electronic Contract Assembly Market Revenue Breakdown (Million, %) by Region 2024 & 2032
- Figure 2: Global Electronic Contract Assembly Market Volume Breakdown (K Unit, %) by Region 2024 & 2032
- Figure 3: North America Electronic Contract Assembly Market Revenue (Million), by Country 2024 & 2032
- Figure 4: North America Electronic Contract Assembly Market Volume (K Unit), by Country 2024 & 2032
- Figure 5: North America Electronic Contract Assembly Market Revenue Share (%), by Country 2024 & 2032
- Figure 6: North America Electronic Contract Assembly Market Volume Share (%), by Country 2024 & 2032
- Figure 7: Europe Electronic Contract Assembly Market Revenue (Million), by Country 2024 & 2032
- Figure 8: Europe Electronic Contract Assembly Market Volume (K Unit), by Country 2024 & 2032
- Figure 9: Europe Electronic Contract Assembly Market Revenue Share (%), by Country 2024 & 2032
- Figure 10: Europe Electronic Contract Assembly Market Volume Share (%), by Country 2024 & 2032
- Figure 11: Asia Pacific Electronic Contract Assembly Market Revenue (Million), by Country 2024 & 2032
- Figure 12: Asia Pacific Electronic Contract Assembly Market Volume (K Unit), by Country 2024 & 2032
- Figure 13: Asia Pacific Electronic Contract Assembly Market Revenue Share (%), by Country 2024 & 2032
- Figure 14: Asia Pacific Electronic Contract Assembly Market Volume Share (%), by Country 2024 & 2032
- Figure 15: South America Electronic Contract Assembly Market Revenue (Million), by Country 2024 & 2032
- Figure 16: South America Electronic Contract Assembly Market Volume (K Unit), by Country 2024 & 2032
- Figure 17: South America Electronic Contract Assembly Market Revenue Share (%), by Country 2024 & 2032
- Figure 18: South America Electronic Contract Assembly Market Volume Share (%), by Country 2024 & 2032
- Figure 19: North America Electronic Contract Assembly Market Revenue (Million), by Country 2024 & 2032
- Figure 20: North America Electronic Contract Assembly Market Volume (K Unit), by Country 2024 & 2032
- Figure 21: North America Electronic Contract Assembly Market Revenue Share (%), by Country 2024 & 2032
- Figure 22: North America Electronic Contract Assembly Market Volume Share (%), by Country 2024 & 2032
- Figure 23: MEA Electronic Contract Assembly Market Revenue (Million), by Country 2024 & 2032
- Figure 24: MEA Electronic Contract Assembly Market Volume (K Unit), by Country 2024 & 2032
- Figure 25: MEA Electronic Contract Assembly Market Revenue Share (%), by Country 2024 & 2032
- Figure 26: MEA Electronic Contract Assembly Market Volume Share (%), by Country 2024 & 2032
- Figure 27: North America Electronic Contract Assembly Market Revenue (Million), by Type of Activity 2024 & 2032
- Figure 28: North America Electronic Contract Assembly Market Volume (K Unit), by Type of Activity 2024 & 2032
- Figure 29: North America Electronic Contract Assembly Market Revenue Share (%), by Type of Activity 2024 & 2032
- Figure 30: North America Electronic Contract Assembly Market Volume Share (%), by Type of Activity 2024 & 2032
- Figure 31: North America Electronic Contract Assembly Market Revenue (Million), by Application 2024 & 2032
- Figure 32: North America Electronic Contract Assembly Market Volume (K Unit), by Application 2024 & 2032
- Figure 33: North America Electronic Contract Assembly Market Revenue Share (%), by Application 2024 & 2032
- Figure 34: North America Electronic Contract Assembly Market Volume Share (%), by Application 2024 & 2032
- Figure 35: North America Electronic Contract Assembly Market Revenue (Million), by Country 2024 & 2032
- Figure 36: North America Electronic Contract Assembly Market Volume (K Unit), by Country 2024 & 2032
- Figure 37: North America Electronic Contract Assembly Market Revenue Share (%), by Country 2024 & 2032
- Figure 38: North America Electronic Contract Assembly Market Volume Share (%), by Country 2024 & 2032
- Figure 39: Europe Electronic Contract Assembly Market Revenue (Million), by Type of Activity 2024 & 2032
- Figure 40: Europe Electronic Contract Assembly Market Volume (K Unit), by Type of Activity 2024 & 2032
- Figure 41: Europe Electronic Contract Assembly Market Revenue Share (%), by Type of Activity 2024 & 2032
- Figure 42: Europe Electronic Contract Assembly Market Volume Share (%), by Type of Activity 2024 & 2032
- Figure 43: Europe Electronic Contract Assembly Market Revenue (Million), by Application 2024 & 2032
- Figure 44: Europe Electronic Contract Assembly Market Volume (K Unit), by Application 2024 & 2032
- Figure 45: Europe Electronic Contract Assembly Market Revenue Share (%), by Application 2024 & 2032
- Figure 46: Europe Electronic Contract Assembly Market Volume Share (%), by Application 2024 & 2032
- Figure 47: Europe Electronic Contract Assembly Market Revenue (Million), by Country 2024 & 2032
- Figure 48: Europe Electronic Contract Assembly Market Volume (K Unit), by Country 2024 & 2032
- Figure 49: Europe Electronic Contract Assembly Market Revenue Share (%), by Country 2024 & 2032
- Figure 50: Europe Electronic Contract Assembly Market Volume Share (%), by Country 2024 & 2032
- Figure 51: Asia Pacific Electronic Contract Assembly Market Revenue (Million), by Type of Activity 2024 & 2032
- Figure 52: Asia Pacific Electronic Contract Assembly Market Volume (K Unit), by Type of Activity 2024 & 2032
- Figure 53: Asia Pacific Electronic Contract Assembly Market Revenue Share (%), by Type of Activity 2024 & 2032
- Figure 54: Asia Pacific Electronic Contract Assembly Market Volume Share (%), by Type of Activity 2024 & 2032
- Figure 55: Asia Pacific Electronic Contract Assembly Market Revenue (Million), by Application 2024 & 2032
- Figure 56: Asia Pacific Electronic Contract Assembly Market Volume (K Unit), by Application 2024 & 2032
- Figure 57: Asia Pacific Electronic Contract Assembly Market Revenue Share (%), by Application 2024 & 2032
- Figure 58: Asia Pacific Electronic Contract Assembly Market Volume Share (%), by Application 2024 & 2032
- Figure 59: Asia Pacific Electronic Contract Assembly Market Revenue (Million), by Country 2024 & 2032
- Figure 60: Asia Pacific Electronic Contract Assembly Market Volume (K Unit), by Country 2024 & 2032
- Figure 61: Asia Pacific Electronic Contract Assembly Market Revenue Share (%), by Country 2024 & 2032
- Figure 62: Asia Pacific Electronic Contract Assembly Market Volume Share (%), by Country 2024 & 2032
- Figure 63: Latin America Electronic Contract Assembly Market Revenue (Million), by Type of Activity 2024 & 2032
- Figure 64: Latin America Electronic Contract Assembly Market Volume (K Unit), by Type of Activity 2024 & 2032
- Figure 65: Latin America Electronic Contract Assembly Market Revenue Share (%), by Type of Activity 2024 & 2032
- Figure 66: Latin America Electronic Contract Assembly Market Volume Share (%), by Type of Activity 2024 & 2032
- Figure 67: Latin America Electronic Contract Assembly Market Revenue (Million), by Application 2024 & 2032
- Figure 68: Latin America Electronic Contract Assembly Market Volume (K Unit), by Application 2024 & 2032
- Figure 69: Latin America Electronic Contract Assembly Market Revenue Share (%), by Application 2024 & 2032
- Figure 70: Latin America Electronic Contract Assembly Market Volume Share (%), by Application 2024 & 2032
- Figure 71: Latin America Electronic Contract Assembly Market Revenue (Million), by Country 2024 & 2032
- Figure 72: Latin America Electronic Contract Assembly Market Volume (K Unit), by Country 2024 & 2032
- Figure 73: Latin America Electronic Contract Assembly Market Revenue Share (%), by Country 2024 & 2032
- Figure 74: Latin America Electronic Contract Assembly Market Volume Share (%), by Country 2024 & 2032
- Figure 75: Middle East and Africa Electronic Contract Assembly Market Revenue (Million), by Type of Activity 2024 & 2032
- Figure 76: Middle East and Africa Electronic Contract Assembly Market Volume (K Unit), by Type of Activity 2024 & 2032
- Figure 77: Middle East and Africa Electronic Contract Assembly Market Revenue Share (%), by Type of Activity 2024 & 2032
- Figure 78: Middle East and Africa Electronic Contract Assembly Market Volume Share (%), by Type of Activity 2024 & 2032
- Figure 79: Middle East and Africa Electronic Contract Assembly Market Revenue (Million), by Application 2024 & 2032
- Figure 80: Middle East and Africa Electronic Contract Assembly Market Volume (K Unit), by Application 2024 & 2032
- Figure 81: Middle East and Africa Electronic Contract Assembly Market Revenue Share (%), by Application 2024 & 2032
- Figure 82: Middle East and Africa Electronic Contract Assembly Market Volume Share (%), by Application 2024 & 2032
- Figure 83: Middle East and Africa Electronic Contract Assembly Market Revenue (Million), by Country 2024 & 2032
- Figure 84: Middle East and Africa Electronic Contract Assembly Market Volume (K Unit), by Country 2024 & 2032
- Figure 85: Middle East and Africa Electronic Contract Assembly Market Revenue Share (%), by Country 2024 & 2032
- Figure 86: Middle East and Africa Electronic Contract Assembly Market Volume Share (%), by Country 2024 & 2032
List of Tables
- Table 1: Global Electronic Contract Assembly Market Revenue Million Forecast, by Region 2019 & 2032
- Table 2: Global Electronic Contract Assembly Market Volume K Unit Forecast, by Region 2019 & 2032
- Table 3: Global Electronic Contract Assembly Market Revenue Million Forecast, by Type of Activity 2019 & 2032
- Table 4: Global Electronic Contract Assembly Market Volume K Unit Forecast, by Type of Activity 2019 & 2032
- Table 5: Global Electronic Contract Assembly Market Revenue Million Forecast, by Application 2019 & 2032
- Table 6: Global Electronic Contract Assembly Market Volume K Unit Forecast, by Application 2019 & 2032
- Table 7: Global Electronic Contract Assembly Market Revenue Million Forecast, by Region 2019 & 2032
- Table 8: Global Electronic Contract Assembly Market Volume K Unit Forecast, by Region 2019 & 2032
- Table 9: Global Electronic Contract Assembly Market Revenue Million Forecast, by Country 2019 & 2032
- Table 10: Global Electronic Contract Assembly Market Volume K Unit Forecast, by Country 2019 & 2032
- Table 11: United States Electronic Contract Assembly Market Revenue (Million) Forecast, by Application 2019 & 2032
- Table 12: United States Electronic Contract Assembly Market Volume (K Unit) Forecast, by Application 2019 & 2032
- Table 13: Canada Electronic Contract Assembly Market Revenue (Million) Forecast, by Application 2019 & 2032
- Table 14: Canada Electronic Contract Assembly Market Volume (K Unit) Forecast, by Application 2019 & 2032
- Table 15: Mexico Electronic Contract Assembly Market Revenue (Million) Forecast, by Application 2019 & 2032
- Table 16: Mexico Electronic Contract Assembly Market Volume (K Unit) Forecast, by Application 2019 & 2032
- Table 17: Global Electronic Contract Assembly Market Revenue Million Forecast, by Country 2019 & 2032
- Table 18: Global Electronic Contract Assembly Market Volume K Unit Forecast, by Country 2019 & 2032
- Table 19: Germany Electronic Contract Assembly Market Revenue (Million) Forecast, by Application 2019 & 2032
- Table 20: Germany Electronic Contract Assembly Market Volume (K Unit) Forecast, by Application 2019 & 2032
- Table 21: United Kingdom Electronic Contract Assembly Market Revenue (Million) Forecast, by Application 2019 & 2032
- Table 22: United Kingdom Electronic Contract Assembly Market Volume (K Unit) Forecast, by Application 2019 & 2032
- Table 23: France Electronic Contract Assembly Market Revenue (Million) Forecast, by Application 2019 & 2032
- Table 24: France Electronic Contract Assembly Market Volume (K Unit) Forecast, by Application 2019 & 2032
- Table 25: Spain Electronic Contract Assembly Market Revenue (Million) Forecast, by Application 2019 & 2032
- Table 26: Spain Electronic Contract Assembly Market Volume (K Unit) Forecast, by Application 2019 & 2032
- Table 27: Italy Electronic Contract Assembly Market Revenue (Million) Forecast, by Application 2019 & 2032
- Table 28: Italy Electronic Contract Assembly Market Volume (K Unit) Forecast, by Application 2019 & 2032
- Table 29: Spain Electronic Contract Assembly Market Revenue (Million) Forecast, by Application 2019 & 2032
- Table 30: Spain Electronic Contract Assembly Market Volume (K Unit) Forecast, by Application 2019 & 2032
- Table 31: Belgium Electronic Contract Assembly Market Revenue (Million) Forecast, by Application 2019 & 2032
- Table 32: Belgium Electronic Contract Assembly Market Volume (K Unit) Forecast, by Application 2019 & 2032
- Table 33: Netherland Electronic Contract Assembly Market Revenue (Million) Forecast, by Application 2019 & 2032
- Table 34: Netherland Electronic Contract Assembly Market Volume (K Unit) Forecast, by Application 2019 & 2032
- Table 35: Nordics Electronic Contract Assembly Market Revenue (Million) Forecast, by Application 2019 & 2032
- Table 36: Nordics Electronic Contract Assembly Market Volume (K Unit) Forecast, by Application 2019 & 2032
- Table 37: Rest of Europe Electronic Contract Assembly Market Revenue (Million) Forecast, by Application 2019 & 2032
- Table 38: Rest of Europe Electronic Contract Assembly Market Volume (K Unit) Forecast, by Application 2019 & 2032
- Table 39: Global Electronic Contract Assembly Market Revenue Million Forecast, by Country 2019 & 2032
- Table 40: Global Electronic Contract Assembly Market Volume K Unit Forecast, by Country 2019 & 2032
- Table 41: China Electronic Contract Assembly Market Revenue (Million) Forecast, by Application 2019 & 2032
- Table 42: China Electronic Contract Assembly Market Volume (K Unit) Forecast, by Application 2019 & 2032
- Table 43: Japan Electronic Contract Assembly Market Revenue (Million) Forecast, by Application 2019 & 2032
- Table 44: Japan Electronic Contract Assembly Market Volume (K Unit) Forecast, by Application 2019 & 2032
- Table 45: India Electronic Contract Assembly Market Revenue (Million) Forecast, by Application 2019 & 2032
- Table 46: India Electronic Contract Assembly Market Volume (K Unit) Forecast, by Application 2019 & 2032
- Table 47: South Korea Electronic Contract Assembly Market Revenue (Million) Forecast, by Application 2019 & 2032
- Table 48: South Korea Electronic Contract Assembly Market Volume (K Unit) Forecast, by Application 2019 & 2032
- Table 49: Southeast Asia Electronic Contract Assembly Market Revenue (Million) Forecast, by Application 2019 & 2032
- Table 50: Southeast Asia Electronic Contract Assembly Market Volume (K Unit) Forecast, by Application 2019 & 2032
- Table 51: Australia Electronic Contract Assembly Market Revenue (Million) Forecast, by Application 2019 & 2032
- Table 52: Australia Electronic Contract Assembly Market Volume (K Unit) Forecast, by Application 2019 & 2032
- Table 53: Indonesia Electronic Contract Assembly Market Revenue (Million) Forecast, by Application 2019 & 2032
- Table 54: Indonesia Electronic Contract Assembly Market Volume (K Unit) Forecast, by Application 2019 & 2032
- Table 55: Phillipes Electronic Contract Assembly Market Revenue (Million) Forecast, by Application 2019 & 2032
- Table 56: Phillipes Electronic Contract Assembly Market Volume (K Unit) Forecast, by Application 2019 & 2032
- Table 57: Singapore Electronic Contract Assembly Market Revenue (Million) Forecast, by Application 2019 & 2032
- Table 58: Singapore Electronic Contract Assembly Market Volume (K Unit) Forecast, by Application 2019 & 2032
- Table 59: Thailandc Electronic Contract Assembly Market Revenue (Million) Forecast, by Application 2019 & 2032
- Table 60: Thailandc Electronic Contract Assembly Market Volume (K Unit) Forecast, by Application 2019 & 2032
- Table 61: Rest of Asia Pacific Electronic Contract Assembly Market Revenue (Million) Forecast, by Application 2019 & 2032
- Table 62: Rest of Asia Pacific Electronic Contract Assembly Market Volume (K Unit) Forecast, by Application 2019 & 2032
- Table 63: Global Electronic Contract Assembly Market Revenue Million Forecast, by Country 2019 & 2032
- Table 64: Global Electronic Contract Assembly Market Volume K Unit Forecast, by Country 2019 & 2032
- Table 65: Brazil Electronic Contract Assembly Market Revenue (Million) Forecast, by Application 2019 & 2032
- Table 66: Brazil Electronic Contract Assembly Market Volume (K Unit) Forecast, by Application 2019 & 2032
- Table 67: Argentina Electronic Contract Assembly Market Revenue (Million) Forecast, by Application 2019 & 2032
- Table 68: Argentina Electronic Contract Assembly Market Volume (K Unit) Forecast, by Application 2019 & 2032
- Table 69: Peru Electronic Contract Assembly Market Revenue (Million) Forecast, by Application 2019 & 2032
- Table 70: Peru Electronic Contract Assembly Market Volume (K Unit) Forecast, by Application 2019 & 2032
- Table 71: Chile Electronic Contract Assembly Market Revenue (Million) Forecast, by Application 2019 & 2032
- Table 72: Chile Electronic Contract Assembly Market Volume (K Unit) Forecast, by Application 2019 & 2032
- Table 73: Colombia Electronic Contract Assembly Market Revenue (Million) Forecast, by Application 2019 & 2032
- Table 74: Colombia Electronic Contract Assembly Market Volume (K Unit) Forecast, by Application 2019 & 2032
- Table 75: Ecuador Electronic Contract Assembly Market Revenue (Million) Forecast, by Application 2019 & 2032
- Table 76: Ecuador Electronic Contract Assembly Market Volume (K Unit) Forecast, by Application 2019 & 2032
- Table 77: Venezuela Electronic Contract Assembly Market Revenue (Million) Forecast, by Application 2019 & 2032
- Table 78: Venezuela Electronic Contract Assembly Market Volume (K Unit) Forecast, by Application 2019 & 2032
- Table 79: Rest of South America Electronic Contract Assembly Market Revenue (Million) Forecast, by Application 2019 & 2032
- Table 80: Rest of South America Electronic Contract Assembly Market Volume (K Unit) Forecast, by Application 2019 & 2032
- Table 81: Global Electronic Contract Assembly Market Revenue Million Forecast, by Country 2019 & 2032
- Table 82: Global Electronic Contract Assembly Market Volume K Unit Forecast, by Country 2019 & 2032
- Table 83: United States Electronic Contract Assembly Market Revenue (Million) Forecast, by Application 2019 & 2032
- Table 84: United States Electronic Contract Assembly Market Volume (K Unit) Forecast, by Application 2019 & 2032
- Table 85: Canada Electronic Contract Assembly Market Revenue (Million) Forecast, by Application 2019 & 2032
- Table 86: Canada Electronic Contract Assembly Market Volume (K Unit) Forecast, by Application 2019 & 2032
- Table 87: Mexico Electronic Contract Assembly Market Revenue (Million) Forecast, by Application 2019 & 2032
- Table 88: Mexico Electronic Contract Assembly Market Volume (K Unit) Forecast, by Application 2019 & 2032
- Table 89: Global Electronic Contract Assembly Market Revenue Million Forecast, by Country 2019 & 2032
- Table 90: Global Electronic Contract Assembly Market Volume K Unit Forecast, by Country 2019 & 2032
- Table 91: United Arab Emirates Electronic Contract Assembly Market Revenue (Million) Forecast, by Application 2019 & 2032
- Table 92: United Arab Emirates Electronic Contract Assembly Market Volume (K Unit) Forecast, by Application 2019 & 2032
- Table 93: Saudi Arabia Electronic Contract Assembly Market Revenue (Million) Forecast, by Application 2019 & 2032
- Table 94: Saudi Arabia Electronic Contract Assembly Market Volume (K Unit) Forecast, by Application 2019 & 2032
- Table 95: South Africa Electronic Contract Assembly Market Revenue (Million) Forecast, by Application 2019 & 2032
- Table 96: South Africa Electronic Contract Assembly Market Volume (K Unit) Forecast, by Application 2019 & 2032
- Table 97: Rest of Middle East and Africa Electronic Contract Assembly Market Revenue (Million) Forecast, by Application 2019 & 2032
- Table 98: Rest of Middle East and Africa Electronic Contract Assembly Market Volume (K Unit) Forecast, by Application 2019 & 2032
- Table 99: Global Electronic Contract Assembly Market Revenue Million Forecast, by Type of Activity 2019 & 2032
- Table 100: Global Electronic Contract Assembly Market Volume K Unit Forecast, by Type of Activity 2019 & 2032
- Table 101: Global Electronic Contract Assembly Market Revenue Million Forecast, by Application 2019 & 2032
- Table 102: Global Electronic Contract Assembly Market Volume K Unit Forecast, by Application 2019 & 2032
- Table 103: Global Electronic Contract Assembly Market Revenue Million Forecast, by Country 2019 & 2032
- Table 104: Global Electronic Contract Assembly Market Volume K Unit Forecast, by Country 2019 & 2032
- Table 105: United States Electronic Contract Assembly Market Revenue (Million) Forecast, by Application 2019 & 2032
- Table 106: United States Electronic Contract Assembly Market Volume (K Unit) Forecast, by Application 2019 & 2032
- Table 107: Canada Electronic Contract Assembly Market Revenue (Million) Forecast, by Application 2019 & 2032
- Table 108: Canada Electronic Contract Assembly Market Volume (K Unit) Forecast, by Application 2019 & 2032
- Table 109: Global Electronic Contract Assembly Market Revenue Million Forecast, by Type of Activity 2019 & 2032
- Table 110: Global Electronic Contract Assembly Market Volume K Unit Forecast, by Type of Activity 2019 & 2032
- Table 111: Global Electronic Contract Assembly Market Revenue Million Forecast, by Application 2019 & 2032
- Table 112: Global Electronic Contract Assembly Market Volume K Unit Forecast, by Application 2019 & 2032
- Table 113: Global Electronic Contract Assembly Market Revenue Million Forecast, by Country 2019 & 2032
- Table 114: Global Electronic Contract Assembly Market Volume K Unit Forecast, by Country 2019 & 2032
- Table 115: United Kingdom Electronic Contract Assembly Market Revenue (Million) Forecast, by Application 2019 & 2032
- Table 116: United Kingdom Electronic Contract Assembly Market Volume (K Unit) Forecast, by Application 2019 & 2032
- Table 117: Germany Electronic Contract Assembly Market Revenue (Million) Forecast, by Application 2019 & 2032
- Table 118: Germany Electronic Contract Assembly Market Volume (K Unit) Forecast, by Application 2019 & 2032
- Table 119: France Electronic Contract Assembly Market Revenue (Million) Forecast, by Application 2019 & 2032
- Table 120: France Electronic Contract Assembly Market Volume (K Unit) Forecast, by Application 2019 & 2032
- Table 121: Rest of Europe Electronic Contract Assembly Market Revenue (Million) Forecast, by Application 2019 & 2032
- Table 122: Rest of Europe Electronic Contract Assembly Market Volume (K Unit) Forecast, by Application 2019 & 2032
- Table 123: Global Electronic Contract Assembly Market Revenue Million Forecast, by Type of Activity 2019 & 2032
- Table 124: Global Electronic Contract Assembly Market Volume K Unit Forecast, by Type of Activity 2019 & 2032
- Table 125: Global Electronic Contract Assembly Market Revenue Million Forecast, by Application 2019 & 2032
- Table 126: Global Electronic Contract Assembly Market Volume K Unit Forecast, by Application 2019 & 2032
- Table 127: Global Electronic Contract Assembly Market Revenue Million Forecast, by Country 2019 & 2032
- Table 128: Global Electronic Contract Assembly Market Volume K Unit Forecast, by Country 2019 & 2032
- Table 129: China Electronic Contract Assembly Market Revenue (Million) Forecast, by Application 2019 & 2032
- Table 130: China Electronic Contract Assembly Market Volume (K Unit) Forecast, by Application 2019 & 2032
- Table 131: Japan Electronic Contract Assembly Market Revenue (Million) Forecast, by Application 2019 & 2032
- Table 132: Japan Electronic Contract Assembly Market Volume (K Unit) Forecast, by Application 2019 & 2032
- Table 133: India Electronic Contract Assembly Market Revenue (Million) Forecast, by Application 2019 & 2032
- Table 134: India Electronic Contract Assembly Market Volume (K Unit) Forecast, by Application 2019 & 2032
- Table 135: Rest of Asia Pacific Electronic Contract Assembly Market Revenue (Million) Forecast, by Application 2019 & 2032
- Table 136: Rest of Asia Pacific Electronic Contract Assembly Market Volume (K Unit) Forecast, by Application 2019 & 2032
- Table 137: Global Electronic Contract Assembly Market Revenue Million Forecast, by Type of Activity 2019 & 2032
- Table 138: Global Electronic Contract Assembly Market Volume K Unit Forecast, by Type of Activity 2019 & 2032
- Table 139: Global Electronic Contract Assembly Market Revenue Million Forecast, by Application 2019 & 2032
- Table 140: Global Electronic Contract Assembly Market Volume K Unit Forecast, by Application 2019 & 2032
- Table 141: Global Electronic Contract Assembly Market Revenue Million Forecast, by Country 2019 & 2032
- Table 142: Global Electronic Contract Assembly Market Volume K Unit Forecast, by Country 2019 & 2032
- Table 143: Brazil Electronic Contract Assembly Market Revenue (Million) Forecast, by Application 2019 & 2032
- Table 144: Brazil Electronic Contract Assembly Market Volume (K Unit) Forecast, by Application 2019 & 2032
- Table 145: Argentina Electronic Contract Assembly Market Revenue (Million) Forecast, by Application 2019 & 2032
- Table 146: Argentina Electronic Contract Assembly Market Volume (K Unit) Forecast, by Application 2019 & 2032
- Table 147: Rest of South America Electronic Contract Assembly Market Revenue (Million) Forecast, by Application 2019 & 2032
- Table 148: Rest of South America Electronic Contract Assembly Market Volume (K Unit) Forecast, by Application 2019 & 2032
- Table 149: Global Electronic Contract Assembly Market Revenue Million Forecast, by Type of Activity 2019 & 2032
- Table 150: Global Electronic Contract Assembly Market Volume K Unit Forecast, by Type of Activity 2019 & 2032
- Table 151: Global Electronic Contract Assembly Market Revenue Million Forecast, by Application 2019 & 2032
- Table 152: Global Electronic Contract Assembly Market Volume K Unit Forecast, by Application 2019 & 2032
- Table 153: Global Electronic Contract Assembly Market Revenue Million Forecast, by Country 2019 & 2032
- Table 154: Global Electronic Contract Assembly Market Volume K Unit Forecast, by Country 2019 & 2032
- Table 155: UAE Electronic Contract Assembly Market Revenue (Million) Forecast, by Application 2019 & 2032
- Table 156: UAE Electronic Contract Assembly Market Volume (K Unit) Forecast, by Application 2019 & 2032
- Table 157: South Africa Electronic Contract Assembly Market Revenue (Million) Forecast, by Application 2019 & 2032
- Table 158: South Africa Electronic Contract Assembly Market Volume (K Unit) Forecast, by Application 2019 & 2032
- Table 159: Saudi Arabia Electronic Contract Assembly Market Revenue (Million) Forecast, by Application 2019 & 2032
- Table 160: Saudi Arabia Electronic Contract Assembly Market Volume (K Unit) Forecast, by Application 2019 & 2032
- Table 161: Rest Of MEA Electronic Contract Assembly Market Revenue (Million) Forecast, by Application 2019 & 2032
- Table 162: Rest Of MEA Electronic Contract Assembly Market Volume (K Unit) Forecast, by Application 2019 & 2032
Frequently Asked Questions
1. What is the projected Compound Annual Growth Rate (CAGR) of the Electronic Contract Assembly Market?
The projected CAGR is approximately 9.20%.
2. Which companies are prominent players in the Electronic Contract Assembly Market?
Key companies in the market include Leoni Special Cables Ltd, Connect Group NV, TTM Technologies Inc , Compulink Cable Assemblies Inc, Mack Technologies Inc, ATL Technology, Amphenol Interconnect Products Corp (AIPC), Season Group International Co Ltd, Volex Group PLC.
3. What are the main segments of the Electronic Contract Assembly Market?
The market segments include Type of Activity, Application.
4. Can you provide details about the market size?
The market size is estimated to be USD XX Million as of 2022.
5. What are some drivers contributing to market growth?
Increasing Popularity of MEMS Technology; Increasing demand of water treatment facilities in the region.
6. What are the notable trends driving market growth?
Consumer Electronics to Drive the Market Growth.
7. Are there any restraints impacting market growth?
; Lack of Standard Protocols for the Development of Power Modules; Slow Adoption of New Technologies Derailing Innovation.
8. Can you provide examples of recent developments in the market?
October 2021 - Amphenol has launched a new range of robust display solutions, the Mini DisplayPort and HDMI connectors. Amphenol's new solution is designed to transmit video data and information in the harsh environment of equipment such as C5ISR, ground vehicles, and the Navy. These new connectors are built to ensure reliable transmission between display screens, cameras, and computers. The new Rugged Display Solutions range covers protocols such as DisplayPort and HDMI. A standard DisplayPort or HDMI plug or cord set can be converted into a military-grade solution for harsh environments with a high level of sealing and durability.
9. What pricing options are available for accessing the report?
Pricing options include single-user, multi-user, and enterprise licenses priced at USD 4750, USD 5250, and USD 8750 respectively.
10. Is the market size provided in terms of value or volume?
The market size is provided in terms of value, measured in Million and volume, measured in K Unit.
11. Are there any specific market keywords associated with the report?
Yes, the market keyword associated with the report is "Electronic Contract Assembly Market," which aids in identifying and referencing the specific market segment covered.
12. How do I determine which pricing option suits my needs best?
The pricing options vary based on user requirements and access needs. Individual users may opt for single-user licenses, while businesses requiring broader access may choose multi-user or enterprise licenses for cost-effective access to the report.
13. Are there any additional resources or data provided in the Electronic Contract Assembly Market report?
While the report offers comprehensive insights, it's advisable to review the specific contents or supplementary materials provided to ascertain if additional resources or data are available.
14. How can I stay updated on further developments or reports in the Electronic Contract Assembly Market?
To stay informed about further developments, trends, and reports in the Electronic Contract Assembly Market, consider subscribing to industry newsletters, following relevant companies and organizations, or regularly checking reputable industry news sources and publications.
Methodology
Step 1 - Identification of Relevant Samples Size from Population Database


Step 2 - Approaches for Defining Global Market Size (Value, Volume* & Price*)

Note*: In applicable scenarios
Step 3 - Data Sources
Primary Research
- Web Analytics
- Survey Reports
- Research Institute
- Latest Research Reports
- Opinion Leaders
Secondary Research
- Annual Reports
- White Paper
- Latest Press Release
- Industry Association
- Paid Database
- Investor Presentations

Step 4 - Data Triangulation
Involves using different sources of information in order to increase the validity of a study
These sources are likely to be stakeholders in a program - participants, other researchers, program staff, other community members, and so on.
Then we put all data in single framework & apply various statistical tools to find out the dynamic on the market.
During the analysis stage, feedback from the stakeholder groups would be compared to determine areas of agreement as well as areas of divergence


