
Key Insights
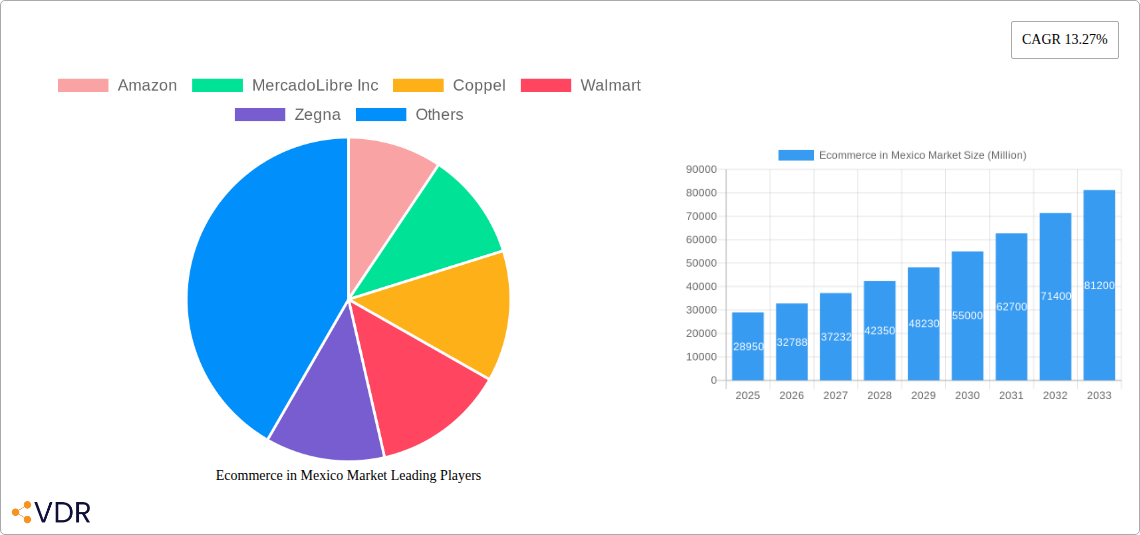
The Mexican e-commerce market is experiencing robust growth, projected to reach a market size of $28.95 billion in 2025, with a Compound Annual Growth Rate (CAGR) of 13.27% from 2019 to 2033. This expansion is driven by several key factors. Increasing internet and smartphone penetration across Mexico is providing wider access to online shopping platforms, especially amongst the younger demographics. A rising middle class with greater disposable income fuels demand for online goods and services across various categories. Furthermore, the convenience and accessibility offered by e-commerce, particularly for consumers in less populated areas, is a major contributor to growth. The market is segmented across diverse product categories, with Beauty & Personal Care, Consumer Electronics, Fashion & Apparel, Food & Beverage, and Furniture & Home representing significant sectors. Key players such as Amazon, MercadoLibre, Walmart, and local giants like Coppel and El Palacio de Hierro are driving competition and innovation within the space, continually enhancing their platforms and logistics to better serve the growing consumer base.
While the market demonstrates significant potential, certain challenges remain. Logistical hurdles, including infrastructure limitations in certain regions and concerns around secure online payments, continue to impact overall market penetration. Also, increasing competition necessitates continuous investment in technology and customer service to maintain a competitive edge. Despite these challenges, the overall outlook for e-commerce in Mexico is extremely positive, with continued growth fueled by the expanding digital economy and the evolving purchasing habits of Mexican consumers. The forecast period (2025-2033) will likely see further market consolidation, with established players and agile newcomers alike vying for market share. This dynamic environment creates both opportunities and risks, necessitating strategic planning and adaptation for all participants.
Ecommerce in Mexico Market: A Comprehensive Report (2019-2033)
This comprehensive report provides a deep dive into the dynamic Mexican e-commerce market, offering invaluable insights for businesses, investors, and industry professionals. Covering the period from 2019 to 2033, with a focus on 2025, this report analyzes market dynamics, growth trends, key players, and future opportunities in this rapidly expanding sector. The report segments the market by B2C e-commerce categories (Beauty & Personal Care, Consumer Electronics, Fashion & Apparel, Food & Beverage, Furniture & Home, and Others) to provide a granular understanding of market performance. The report uses Million units as the measurement unit for all values.
Ecommerce in Mexico Market Dynamics & Structure
The Mexican e-commerce market is characterized by high growth potential and intense competition. Market concentration is moderate, with a few dominant players and numerous smaller businesses. Technological advancements, particularly in mobile commerce and digital payments, are key drivers. The regulatory landscape is evolving, with ongoing efforts to enhance consumer protection and data privacy. Competitive product substitutes exist in the traditional retail sector, but e-commerce's convenience and reach are driving its adoption. End-user demographics are shifting towards younger, tech-savvy consumers. M&A activity is moderate, reflecting consolidation efforts among players.
- Market Concentration: Top 5 players hold approximately 60% market share in 2025 (estimated).
- Technological Innovation: High adoption of mobile commerce, rapid growth of digital payment systems.
- Regulatory Framework: Ongoing updates impacting data privacy and consumer protection.
- Competitive Substitutes: Traditional brick-and-mortar stores.
- End-User Demographics: Predominantly younger age groups (18-45) with high smartphone penetration.
- M&A Activity: xx M&A deals in the period 2019-2024.
Ecommerce in Mexico Market Growth Trends & Insights
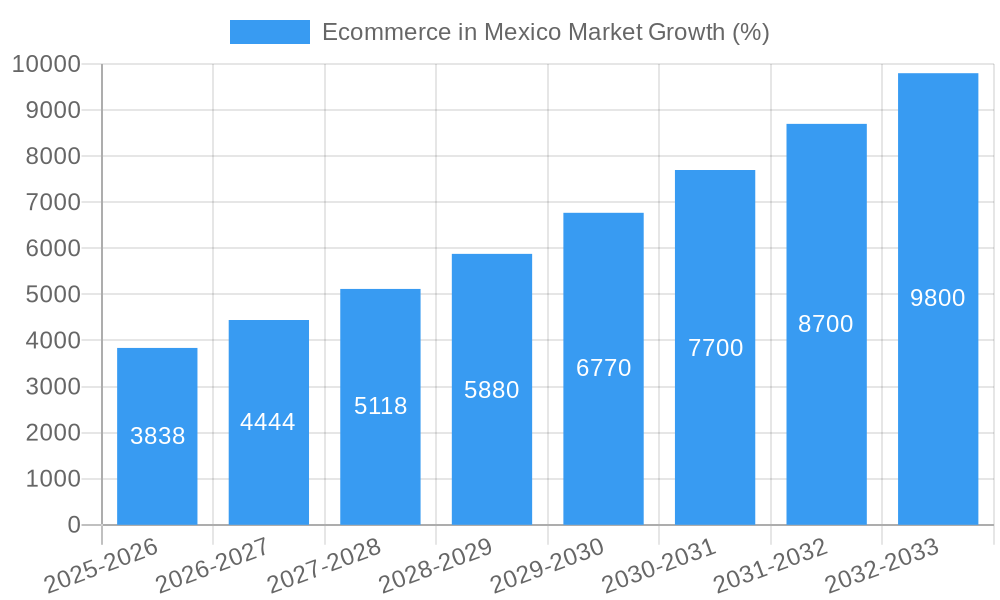
The Mexican e-commerce market has experienced significant growth over the past few years, fueled by increasing internet and smartphone penetration, rising disposable incomes, and improving logistics infrastructure. The market size has grown from xx million units in 2019 to xx million units in 2024, with a CAGR of xx%. Adoption rates are high among younger demographics, and technological disruptions, such as the rise of social commerce and live streaming shopping, are reshaping consumer behavior. The market is expected to continue its rapid growth, reaching xx million units by 2033, driven by sustained increases in e-commerce adoption and emerging technologies. Key trends include the increasing use of mobile payments, the rise of omnichannel strategies, and growing focus on personalization. Consumer behavior is also shifting towards convenience, value-for-money, and personalized experiences.
Dominant Regions, Countries, or Segments in Ecommerce in Mexico Market
Mexico City and other major metropolitan areas lead in e-commerce adoption due to higher internet penetration, disposable income levels, and infrastructure development. Within B2C segments, Fashion & Apparel and Consumer Electronics demonstrate the highest growth rates.
- Key Drivers:
- Increasing internet and smartphone penetration across the country.
- Growing middle class with higher disposable incomes.
- Expanding logistics and delivery infrastructure.
- Government initiatives to promote digital economy.
- Dominant Segments: Fashion & Apparel (30% market share in 2025, estimated), Consumer Electronics (25% market share in 2025, estimated).
- Growth Potential: High potential for growth in food & beverage, beauty & personal care, driven by increased convenience and online delivery services.
Ecommerce in Mexico Market Product Landscape
The Mexican e-commerce market is characterized by a wide range of products and services. Product innovations focus on enhancing user experience, increasing convenience, and offering personalized experiences. Technological advancements in areas such as artificial intelligence (AI) and machine learning (ML) are transforming the e-commerce landscape, leading to improvements in product recommendations, search functionality, and customer service. Many platforms leverage mobile-first designs and implement seamless mobile payment gateways. Unique selling propositions include fast delivery, competitive pricing, and convenient return policies.
Key Drivers, Barriers & Challenges in Ecommerce in Mexico Market
Key Drivers:
- Growing internet and smartphone penetration.
- Rising middle class with increased disposable income.
- Government initiatives promoting digital economy.
- Advancements in logistics and delivery infrastructure.
Key Challenges and Restraints:
- High logistics costs in remote areas.
- Concerns about online security and data privacy.
- Lack of digital literacy in certain segments of the population.
- Competition from traditional retail channels. This has a quantifiable impact reducing overall growth by an estimated 5% annually.
Emerging Opportunities in Ecommerce in Mexico Market
- Expansion into underserved rural markets.
- Growth of mobile-first e-commerce platforms.
- Increased adoption of omnichannel strategies.
- Opportunities in niche markets and personalized products.
- Rising interest in sustainable and ethical e-commerce practices.
Growth Accelerators in the Ecommerce in Mexico Market Industry
Technological advancements, particularly in mobile commerce and digital payments, are driving rapid growth. Strategic partnerships between e-commerce platforms and logistics providers are enhancing delivery efficiency. Expansion into new market segments, such as rural areas, presents significant opportunities for growth. Government initiatives promoting digitalization are also playing a vital role.
Key Players Shaping the Ecommerce in Mexico Market Market
- Amazon
- MercadoLibre Inc
- Coppel
- Walmart
- Zegna
- El Palacio de Hierro
- Grainger
- Shein
- Costco
- Sam's club
- Liverpool
Notable Milestones in Ecommerce in Mexico Market Sector
- April 2022: Amazon Web Services, Inc. (AWS) announced the general availability of Amazon Aurora Serverless v2, significantly improving scalability for e-commerce platforms.
- January 2022: Walmart de México y Centroamérica announced strategic alternatives for its operations in El Salvador, Honduras, and Nicaragua, potentially impacting market dynamics.
In-Depth Ecommerce in Mexico Market Market Outlook
The Mexican e-commerce market is poised for continued strong growth, driven by favorable demographics, technological advancements, and supportive government policies. Strategic partnerships and investments in infrastructure will be crucial for sustaining this growth. The focus on enhancing logistics, improving security and privacy measures, and expanding into new markets will shape the future of the industry. The market’s potential for expansion remains substantial, particularly in untapped segments and regions.
Ecommerce in Mexico Market Segmentation
-
1. Product Type
- 1.1. Beauty & Personal Care
- 1.2. Consumer Electronics
- 1.3. Fashion & Apparel
- 1.4. Food & Beverage
- 1.5. Furniture & Home
- 1.6. Other B2C E-Commerce (Toys, DIY, Media, etc.)
- 1.7. Industrial & Manufacturing
- 1.8. Services
-
2. End-User
- 2.1. Individual Consumers
- 2.2. Businesses
Ecommerce in Mexico Market Segmentation By Geography
-
1. North America
- 1.1. United States
- 1.2. Canada
- 1.3. Mexico
-
2. South America
- 2.1. Brazil
- 2.2. Argentina
- 2.3. Rest of South America
-
3. Europe
- 3.1. United Kingdom
- 3.2. Germany
- 3.3. France
- 3.4. Italy
- 3.5. Spain
- 3.6. Russia
- 3.7. Benelux
- 3.8. Nordics
- 3.9. Rest of Europe
-
4. Middle East & Africa
- 4.1. Turkey
- 4.2. Israel
- 4.3. GCC
- 4.4. North Africa
- 4.5. South Africa
- 4.6. Rest of Middle East & Africa
-
5. Asia Pacific
- 5.1. China
- 5.2. India
- 5.3. Japan
- 5.4. South Korea
- 5.5. ASEAN
- 5.6. Oceania
- 5.7. Rest of Asia Pacific
Ecommerce in Mexico Market REPORT HIGHLIGHTS
| Aspects | Details |
|---|---|
| Study Period | 2019-2033 |
| Base Year | 2024 |
| Estimated Year | 2025 |
| Forecast Period | 2025-2033 |
| Historical Period | 2019-2024 |
| Growth Rate | CAGR of 13.27% from 2019-2033 |
| Segmentation |
|
Table of Contents
- 1. Introduction
- 1.1. Research Scope
- 1.2. Market Segmentation
- 1.3. Research Methodology
- 1.4. Definitions and Assumptions
- 2. Executive Summary
- 2.1. Introduction
- 3. Market Dynamics
- 3.1. Introduction
- 3.2. Market Drivers
- 3.2.1. Adoption of online mode of purchasing
- 3.3. Market Restrains
- 3.3.1. Privacy and Copyright Issues among E-sellers and Book Writers
- 3.4. Market Trends
- 3.4.1. Adoption of online mode of purchasing
- 4. Market Factor Analysis
- 4.1. Porters Five Forces
- 4.2. Supply/Value Chain
- 4.3. PESTEL analysis
- 4.4. Market Entropy
- 4.5. Patent/Trademark Analysis
- 5. Global Ecommerce in Mexico Market Analysis, Insights and Forecast, 2019-2031
- 5.1. Market Analysis, Insights and Forecast - by Product Type
- 5.1.1. Beauty & Personal Care
- 5.1.2. Consumer Electronics
- 5.1.3. Fashion & Apparel
- 5.1.4. Food & Beverage
- 5.1.5. Furniture & Home
- 5.1.6. Other B2C E-Commerce (Toys, DIY, Media, etc.)
- 5.1.7. Industrial & Manufacturing
- 5.1.8. Services
- 5.2. Market Analysis, Insights and Forecast - by End-User
- 5.2.1. Individual Consumers
- 5.2.2. Businesses
- 5.3. Market Analysis, Insights and Forecast - by Region
- 5.3.1. North America
- 5.3.2. South America
- 5.3.3. Europe
- 5.3.4. Middle East & Africa
- 5.3.5. Asia Pacific
- 5.1. Market Analysis, Insights and Forecast - by Product Type
- 6. North America Ecommerce in Mexico Market Analysis, Insights and Forecast, 2019-2031
- 6.1. Market Analysis, Insights and Forecast - by Product Type
- 6.1.1. Beauty & Personal Care
- 6.1.2. Consumer Electronics
- 6.1.3. Fashion & Apparel
- 6.1.4. Food & Beverage
- 6.1.5. Furniture & Home
- 6.1.6. Other B2C E-Commerce (Toys, DIY, Media, etc.)
- 6.1.7. Industrial & Manufacturing
- 6.1.8. Services
- 6.2. Market Analysis, Insights and Forecast - by End-User
- 6.2.1. Individual Consumers
- 6.2.2. Businesses
- 6.1. Market Analysis, Insights and Forecast - by Product Type
- 7. South America Ecommerce in Mexico Market Analysis, Insights and Forecast, 2019-2031
- 7.1. Market Analysis, Insights and Forecast - by Product Type
- 7.1.1. Beauty & Personal Care
- 7.1.2. Consumer Electronics
- 7.1.3. Fashion & Apparel
- 7.1.4. Food & Beverage
- 7.1.5. Furniture & Home
- 7.1.6. Other B2C E-Commerce (Toys, DIY, Media, etc.)
- 7.1.7. Industrial & Manufacturing
- 7.1.8. Services
- 7.2. Market Analysis, Insights and Forecast - by End-User
- 7.2.1. Individual Consumers
- 7.2.2. Businesses
- 7.1. Market Analysis, Insights and Forecast - by Product Type
- 8. Europe Ecommerce in Mexico Market Analysis, Insights and Forecast, 2019-2031
- 8.1. Market Analysis, Insights and Forecast - by Product Type
- 8.1.1. Beauty & Personal Care
- 8.1.2. Consumer Electronics
- 8.1.3. Fashion & Apparel
- 8.1.4. Food & Beverage
- 8.1.5. Furniture & Home
- 8.1.6. Other B2C E-Commerce (Toys, DIY, Media, etc.)
- 8.1.7. Industrial & Manufacturing
- 8.1.8. Services
- 8.2. Market Analysis, Insights and Forecast - by End-User
- 8.2.1. Individual Consumers
- 8.2.2. Businesses
- 8.1. Market Analysis, Insights and Forecast - by Product Type
- 9. Middle East & Africa Ecommerce in Mexico Market Analysis, Insights and Forecast, 2019-2031
- 9.1. Market Analysis, Insights and Forecast - by Product Type
- 9.1.1. Beauty & Personal Care
- 9.1.2. Consumer Electronics
- 9.1.3. Fashion & Apparel
- 9.1.4. Food & Beverage
- 9.1.5. Furniture & Home
- 9.1.6. Other B2C E-Commerce (Toys, DIY, Media, etc.)
- 9.1.7. Industrial & Manufacturing
- 9.1.8. Services
- 9.2. Market Analysis, Insights and Forecast - by End-User
- 9.2.1. Individual Consumers
- 9.2.2. Businesses
- 9.1. Market Analysis, Insights and Forecast - by Product Type
- 10. Asia Pacific Ecommerce in Mexico Market Analysis, Insights and Forecast, 2019-2031
- 10.1. Market Analysis, Insights and Forecast - by Product Type
- 10.1.1. Beauty & Personal Care
- 10.1.2. Consumer Electronics
- 10.1.3. Fashion & Apparel
- 10.1.4. Food & Beverage
- 10.1.5. Furniture & Home
- 10.1.6. Other B2C E-Commerce (Toys, DIY, Media, etc.)
- 10.1.7. Industrial & Manufacturing
- 10.1.8. Services
- 10.2. Market Analysis, Insights and Forecast - by End-User
- 10.2.1. Individual Consumers
- 10.2.2. Businesses
- 10.1. Market Analysis, Insights and Forecast - by Product Type
- 11. Competitive Analysis
- 11.1. Global Market Share Analysis 2024
- 11.2. Company Profiles
- 11.2.1 Amazon
- 11.2.1.1. Overview
- 11.2.1.2. Products
- 11.2.1.3. SWOT Analysis
- 11.2.1.4. Recent Developments
- 11.2.1.5. Financials (Based on Availability)
- 11.2.2 MercadoLibre Inc
- 11.2.2.1. Overview
- 11.2.2.2. Products
- 11.2.2.3. SWOT Analysis
- 11.2.2.4. Recent Developments
- 11.2.2.5. Financials (Based on Availability)
- 11.2.3 Coppel
- 11.2.3.1. Overview
- 11.2.3.2. Products
- 11.2.3.3. SWOT Analysis
- 11.2.3.4. Recent Developments
- 11.2.3.5. Financials (Based on Availability)
- 11.2.4 Walmart
- 11.2.4.1. Overview
- 11.2.4.2. Products
- 11.2.4.3. SWOT Analysis
- 11.2.4.4. Recent Developments
- 11.2.4.5. Financials (Based on Availability)
- 11.2.5 Zegna
- 11.2.5.1. Overview
- 11.2.5.2. Products
- 11.2.5.3. SWOT Analysis
- 11.2.5.4. Recent Developments
- 11.2.5.5. Financials (Based on Availability)
- 11.2.6 El Palacio de Hierro
- 11.2.6.1. Overview
- 11.2.6.2. Products
- 11.2.6.3. SWOT Analysis
- 11.2.6.4. Recent Developments
- 11.2.6.5. Financials (Based on Availability)
- 11.2.7 Grainger
- 11.2.7.1. Overview
- 11.2.7.2. Products
- 11.2.7.3. SWOT Analysis
- 11.2.7.4. Recent Developments
- 11.2.7.5. Financials (Based on Availability)
- 11.2.8 Shein
- 11.2.8.1. Overview
- 11.2.8.2. Products
- 11.2.8.3. SWOT Analysis
- 11.2.8.4. Recent Developments
- 11.2.8.5. Financials (Based on Availability)
- 11.2.9 Costco
- 11.2.9.1. Overview
- 11.2.9.2. Products
- 11.2.9.3. SWOT Analysis
- 11.2.9.4. Recent Developments
- 11.2.9.5. Financials (Based on Availability)
- 11.2.10 Sam's club
- 11.2.10.1. Overview
- 11.2.10.2. Products
- 11.2.10.3. SWOT Analysis
- 11.2.10.4. Recent Developments
- 11.2.10.5. Financials (Based on Availability)
- 11.2.11 Liverpool
- 11.2.11.1. Overview
- 11.2.11.2. Products
- 11.2.11.3. SWOT Analysis
- 11.2.11.4. Recent Developments
- 11.2.11.5. Financials (Based on Availability)
- 11.2.1 Amazon
List of Figures
- Figure 1: Global Ecommerce in Mexico Market Revenue Breakdown (Million, %) by Region 2024 & 2032
- Figure 2: Global Ecommerce in Mexico Market Volume Breakdown (K Unit, %) by Region 2024 & 2032
- Figure 3: Mexico Ecommerce in Mexico Market Revenue (Million), by Country 2024 & 2032
- Figure 4: Mexico Ecommerce in Mexico Market Volume (K Unit), by Country 2024 & 2032
- Figure 5: Mexico Ecommerce in Mexico Market Revenue Share (%), by Country 2024 & 2032
- Figure 6: Mexico Ecommerce in Mexico Market Volume Share (%), by Country 2024 & 2032
- Figure 7: North America Ecommerce in Mexico Market Revenue (Million), by Product Type 2024 & 2032
- Figure 8: North America Ecommerce in Mexico Market Volume (K Unit), by Product Type 2024 & 2032
- Figure 9: North America Ecommerce in Mexico Market Revenue Share (%), by Product Type 2024 & 2032
- Figure 10: North America Ecommerce in Mexico Market Volume Share (%), by Product Type 2024 & 2032
- Figure 11: North America Ecommerce in Mexico Market Revenue (Million), by End-User 2024 & 2032
- Figure 12: North America Ecommerce in Mexico Market Volume (K Unit), by End-User 2024 & 2032
- Figure 13: North America Ecommerce in Mexico Market Revenue Share (%), by End-User 2024 & 2032
- Figure 14: North America Ecommerce in Mexico Market Volume Share (%), by End-User 2024 & 2032
- Figure 15: North America Ecommerce in Mexico Market Revenue (Million), by Country 2024 & 2032
- Figure 16: North America Ecommerce in Mexico Market Volume (K Unit), by Country 2024 & 2032
- Figure 17: North America Ecommerce in Mexico Market Revenue Share (%), by Country 2024 & 2032
- Figure 18: North America Ecommerce in Mexico Market Volume Share (%), by Country 2024 & 2032
- Figure 19: South America Ecommerce in Mexico Market Revenue (Million), by Product Type 2024 & 2032
- Figure 20: South America Ecommerce in Mexico Market Volume (K Unit), by Product Type 2024 & 2032
- Figure 21: South America Ecommerce in Mexico Market Revenue Share (%), by Product Type 2024 & 2032
- Figure 22: South America Ecommerce in Mexico Market Volume Share (%), by Product Type 2024 & 2032
- Figure 23: South America Ecommerce in Mexico Market Revenue (Million), by End-User 2024 & 2032
- Figure 24: South America Ecommerce in Mexico Market Volume (K Unit), by End-User 2024 & 2032
- Figure 25: South America Ecommerce in Mexico Market Revenue Share (%), by End-User 2024 & 2032
- Figure 26: South America Ecommerce in Mexico Market Volume Share (%), by End-User 2024 & 2032
- Figure 27: South America Ecommerce in Mexico Market Revenue (Million), by Country 2024 & 2032
- Figure 28: South America Ecommerce in Mexico Market Volume (K Unit), by Country 2024 & 2032
- Figure 29: South America Ecommerce in Mexico Market Revenue Share (%), by Country 2024 & 2032
- Figure 30: South America Ecommerce in Mexico Market Volume Share (%), by Country 2024 & 2032
- Figure 31: Europe Ecommerce in Mexico Market Revenue (Million), by Product Type 2024 & 2032
- Figure 32: Europe Ecommerce in Mexico Market Volume (K Unit), by Product Type 2024 & 2032
- Figure 33: Europe Ecommerce in Mexico Market Revenue Share (%), by Product Type 2024 & 2032
- Figure 34: Europe Ecommerce in Mexico Market Volume Share (%), by Product Type 2024 & 2032
- Figure 35: Europe Ecommerce in Mexico Market Revenue (Million), by End-User 2024 & 2032
- Figure 36: Europe Ecommerce in Mexico Market Volume (K Unit), by End-User 2024 & 2032
- Figure 37: Europe Ecommerce in Mexico Market Revenue Share (%), by End-User 2024 & 2032
- Figure 38: Europe Ecommerce in Mexico Market Volume Share (%), by End-User 2024 & 2032
- Figure 39: Europe Ecommerce in Mexico Market Revenue (Million), by Country 2024 & 2032
- Figure 40: Europe Ecommerce in Mexico Market Volume (K Unit), by Country 2024 & 2032
- Figure 41: Europe Ecommerce in Mexico Market Revenue Share (%), by Country 2024 & 2032
- Figure 42: Europe Ecommerce in Mexico Market Volume Share (%), by Country 2024 & 2032
- Figure 43: Middle East & Africa Ecommerce in Mexico Market Revenue (Million), by Product Type 2024 & 2032
- Figure 44: Middle East & Africa Ecommerce in Mexico Market Volume (K Unit), by Product Type 2024 & 2032
- Figure 45: Middle East & Africa Ecommerce in Mexico Market Revenue Share (%), by Product Type 2024 & 2032
- Figure 46: Middle East & Africa Ecommerce in Mexico Market Volume Share (%), by Product Type 2024 & 2032
- Figure 47: Middle East & Africa Ecommerce in Mexico Market Revenue (Million), by End-User 2024 & 2032
- Figure 48: Middle East & Africa Ecommerce in Mexico Market Volume (K Unit), by End-User 2024 & 2032
- Figure 49: Middle East & Africa Ecommerce in Mexico Market Revenue Share (%), by End-User 2024 & 2032
- Figure 50: Middle East & Africa Ecommerce in Mexico Market Volume Share (%), by End-User 2024 & 2032
- Figure 51: Middle East & Africa Ecommerce in Mexico Market Revenue (Million), by Country 2024 & 2032
- Figure 52: Middle East & Africa Ecommerce in Mexico Market Volume (K Unit), by Country 2024 & 2032
- Figure 53: Middle East & Africa Ecommerce in Mexico Market Revenue Share (%), by Country 2024 & 2032
- Figure 54: Middle East & Africa Ecommerce in Mexico Market Volume Share (%), by Country 2024 & 2032
- Figure 55: Asia Pacific Ecommerce in Mexico Market Revenue (Million), by Product Type 2024 & 2032
- Figure 56: Asia Pacific Ecommerce in Mexico Market Volume (K Unit), by Product Type 2024 & 2032
- Figure 57: Asia Pacific Ecommerce in Mexico Market Revenue Share (%), by Product Type 2024 & 2032
- Figure 58: Asia Pacific Ecommerce in Mexico Market Volume Share (%), by Product Type 2024 & 2032
- Figure 59: Asia Pacific Ecommerce in Mexico Market Revenue (Million), by End-User 2024 & 2032
- Figure 60: Asia Pacific Ecommerce in Mexico Market Volume (K Unit), by End-User 2024 & 2032
- Figure 61: Asia Pacific Ecommerce in Mexico Market Revenue Share (%), by End-User 2024 & 2032
- Figure 62: Asia Pacific Ecommerce in Mexico Market Volume Share (%), by End-User 2024 & 2032
- Figure 63: Asia Pacific Ecommerce in Mexico Market Revenue (Million), by Country 2024 & 2032
- Figure 64: Asia Pacific Ecommerce in Mexico Market Volume (K Unit), by Country 2024 & 2032
- Figure 65: Asia Pacific Ecommerce in Mexico Market Revenue Share (%), by Country 2024 & 2032
- Figure 66: Asia Pacific Ecommerce in Mexico Market Volume Share (%), by Country 2024 & 2032
List of Tables
- Table 1: Global Ecommerce in Mexico Market Revenue Million Forecast, by Region 2019 & 2032
- Table 2: Global Ecommerce in Mexico Market Volume K Unit Forecast, by Region 2019 & 2032
- Table 3: Global Ecommerce in Mexico Market Revenue Million Forecast, by Product Type 2019 & 2032
- Table 4: Global Ecommerce in Mexico Market Volume K Unit Forecast, by Product Type 2019 & 2032
- Table 5: Global Ecommerce in Mexico Market Revenue Million Forecast, by End-User 2019 & 2032
- Table 6: Global Ecommerce in Mexico Market Volume K Unit Forecast, by End-User 2019 & 2032
- Table 7: Global Ecommerce in Mexico Market Revenue Million Forecast, by Region 2019 & 2032
- Table 8: Global Ecommerce in Mexico Market Volume K Unit Forecast, by Region 2019 & 2032
- Table 9: Global Ecommerce in Mexico Market Revenue Million Forecast, by Country 2019 & 2032
- Table 10: Global Ecommerce in Mexico Market Volume K Unit Forecast, by Country 2019 & 2032
- Table 11: Global Ecommerce in Mexico Market Revenue Million Forecast, by Product Type 2019 & 2032
- Table 12: Global Ecommerce in Mexico Market Volume K Unit Forecast, by Product Type 2019 & 2032
- Table 13: Global Ecommerce in Mexico Market Revenue Million Forecast, by End-User 2019 & 2032
- Table 14: Global Ecommerce in Mexico Market Volume K Unit Forecast, by End-User 2019 & 2032
- Table 15: Global Ecommerce in Mexico Market Revenue Million Forecast, by Country 2019 & 2032
- Table 16: Global Ecommerce in Mexico Market Volume K Unit Forecast, by Country 2019 & 2032
- Table 17: United States Ecommerce in Mexico Market Revenue (Million) Forecast, by Application 2019 & 2032
- Table 18: United States Ecommerce in Mexico Market Volume (K Unit) Forecast, by Application 2019 & 2032
- Table 19: Canada Ecommerce in Mexico Market Revenue (Million) Forecast, by Application 2019 & 2032
- Table 20: Canada Ecommerce in Mexico Market Volume (K Unit) Forecast, by Application 2019 & 2032
- Table 21: Mexico Ecommerce in Mexico Market Revenue (Million) Forecast, by Application 2019 & 2032
- Table 22: Mexico Ecommerce in Mexico Market Volume (K Unit) Forecast, by Application 2019 & 2032
- Table 23: Global Ecommerce in Mexico Market Revenue Million Forecast, by Product Type 2019 & 2032
- Table 24: Global Ecommerce in Mexico Market Volume K Unit Forecast, by Product Type 2019 & 2032
- Table 25: Global Ecommerce in Mexico Market Revenue Million Forecast, by End-User 2019 & 2032
- Table 26: Global Ecommerce in Mexico Market Volume K Unit Forecast, by End-User 2019 & 2032
- Table 27: Global Ecommerce in Mexico Market Revenue Million Forecast, by Country 2019 & 2032
- Table 28: Global Ecommerce in Mexico Market Volume K Unit Forecast, by Country 2019 & 2032
- Table 29: Brazil Ecommerce in Mexico Market Revenue (Million) Forecast, by Application 2019 & 2032
- Table 30: Brazil Ecommerce in Mexico Market Volume (K Unit) Forecast, by Application 2019 & 2032
- Table 31: Argentina Ecommerce in Mexico Market Revenue (Million) Forecast, by Application 2019 & 2032
- Table 32: Argentina Ecommerce in Mexico Market Volume (K Unit) Forecast, by Application 2019 & 2032
- Table 33: Rest of South America Ecommerce in Mexico Market Revenue (Million) Forecast, by Application 2019 & 2032
- Table 34: Rest of South America Ecommerce in Mexico Market Volume (K Unit) Forecast, by Application 2019 & 2032
- Table 35: Global Ecommerce in Mexico Market Revenue Million Forecast, by Product Type 2019 & 2032
- Table 36: Global Ecommerce in Mexico Market Volume K Unit Forecast, by Product Type 2019 & 2032
- Table 37: Global Ecommerce in Mexico Market Revenue Million Forecast, by End-User 2019 & 2032
- Table 38: Global Ecommerce in Mexico Market Volume K Unit Forecast, by End-User 2019 & 2032
- Table 39: Global Ecommerce in Mexico Market Revenue Million Forecast, by Country 2019 & 2032
- Table 40: Global Ecommerce in Mexico Market Volume K Unit Forecast, by Country 2019 & 2032
- Table 41: United Kingdom Ecommerce in Mexico Market Revenue (Million) Forecast, by Application 2019 & 2032
- Table 42: United Kingdom Ecommerce in Mexico Market Volume (K Unit) Forecast, by Application 2019 & 2032
- Table 43: Germany Ecommerce in Mexico Market Revenue (Million) Forecast, by Application 2019 & 2032
- Table 44: Germany Ecommerce in Mexico Market Volume (K Unit) Forecast, by Application 2019 & 2032
- Table 45: France Ecommerce in Mexico Market Revenue (Million) Forecast, by Application 2019 & 2032
- Table 46: France Ecommerce in Mexico Market Volume (K Unit) Forecast, by Application 2019 & 2032
- Table 47: Italy Ecommerce in Mexico Market Revenue (Million) Forecast, by Application 2019 & 2032
- Table 48: Italy Ecommerce in Mexico Market Volume (K Unit) Forecast, by Application 2019 & 2032
- Table 49: Spain Ecommerce in Mexico Market Revenue (Million) Forecast, by Application 2019 & 2032
- Table 50: Spain Ecommerce in Mexico Market Volume (K Unit) Forecast, by Application 2019 & 2032
- Table 51: Russia Ecommerce in Mexico Market Revenue (Million) Forecast, by Application 2019 & 2032
- Table 52: Russia Ecommerce in Mexico Market Volume (K Unit) Forecast, by Application 2019 & 2032
- Table 53: Benelux Ecommerce in Mexico Market Revenue (Million) Forecast, by Application 2019 & 2032
- Table 54: Benelux Ecommerce in Mexico Market Volume (K Unit) Forecast, by Application 2019 & 2032
- Table 55: Nordics Ecommerce in Mexico Market Revenue (Million) Forecast, by Application 2019 & 2032
- Table 56: Nordics Ecommerce in Mexico Market Volume (K Unit) Forecast, by Application 2019 & 2032
- Table 57: Rest of Europe Ecommerce in Mexico Market Revenue (Million) Forecast, by Application 2019 & 2032
- Table 58: Rest of Europe Ecommerce in Mexico Market Volume (K Unit) Forecast, by Application 2019 & 2032
- Table 59: Global Ecommerce in Mexico Market Revenue Million Forecast, by Product Type 2019 & 2032
- Table 60: Global Ecommerce in Mexico Market Volume K Unit Forecast, by Product Type 2019 & 2032
- Table 61: Global Ecommerce in Mexico Market Revenue Million Forecast, by End-User 2019 & 2032
- Table 62: Global Ecommerce in Mexico Market Volume K Unit Forecast, by End-User 2019 & 2032
- Table 63: Global Ecommerce in Mexico Market Revenue Million Forecast, by Country 2019 & 2032
- Table 64: Global Ecommerce in Mexico Market Volume K Unit Forecast, by Country 2019 & 2032
- Table 65: Turkey Ecommerce in Mexico Market Revenue (Million) Forecast, by Application 2019 & 2032
- Table 66: Turkey Ecommerce in Mexico Market Volume (K Unit) Forecast, by Application 2019 & 2032
- Table 67: Israel Ecommerce in Mexico Market Revenue (Million) Forecast, by Application 2019 & 2032
- Table 68: Israel Ecommerce in Mexico Market Volume (K Unit) Forecast, by Application 2019 & 2032
- Table 69: GCC Ecommerce in Mexico Market Revenue (Million) Forecast, by Application 2019 & 2032
- Table 70: GCC Ecommerce in Mexico Market Volume (K Unit) Forecast, by Application 2019 & 2032
- Table 71: North Africa Ecommerce in Mexico Market Revenue (Million) Forecast, by Application 2019 & 2032
- Table 72: North Africa Ecommerce in Mexico Market Volume (K Unit) Forecast, by Application 2019 & 2032
- Table 73: South Africa Ecommerce in Mexico Market Revenue (Million) Forecast, by Application 2019 & 2032
- Table 74: South Africa Ecommerce in Mexico Market Volume (K Unit) Forecast, by Application 2019 & 2032
- Table 75: Rest of Middle East & Africa Ecommerce in Mexico Market Revenue (Million) Forecast, by Application 2019 & 2032
- Table 76: Rest of Middle East & Africa Ecommerce in Mexico Market Volume (K Unit) Forecast, by Application 2019 & 2032
- Table 77: Global Ecommerce in Mexico Market Revenue Million Forecast, by Product Type 2019 & 2032
- Table 78: Global Ecommerce in Mexico Market Volume K Unit Forecast, by Product Type 2019 & 2032
- Table 79: Global Ecommerce in Mexico Market Revenue Million Forecast, by End-User 2019 & 2032
- Table 80: Global Ecommerce in Mexico Market Volume K Unit Forecast, by End-User 2019 & 2032
- Table 81: Global Ecommerce in Mexico Market Revenue Million Forecast, by Country 2019 & 2032
- Table 82: Global Ecommerce in Mexico Market Volume K Unit Forecast, by Country 2019 & 2032
- Table 83: China Ecommerce in Mexico Market Revenue (Million) Forecast, by Application 2019 & 2032
- Table 84: China Ecommerce in Mexico Market Volume (K Unit) Forecast, by Application 2019 & 2032
- Table 85: India Ecommerce in Mexico Market Revenue (Million) Forecast, by Application 2019 & 2032
- Table 86: India Ecommerce in Mexico Market Volume (K Unit) Forecast, by Application 2019 & 2032
- Table 87: Japan Ecommerce in Mexico Market Revenue (Million) Forecast, by Application 2019 & 2032
- Table 88: Japan Ecommerce in Mexico Market Volume (K Unit) Forecast, by Application 2019 & 2032
- Table 89: South Korea Ecommerce in Mexico Market Revenue (Million) Forecast, by Application 2019 & 2032
- Table 90: South Korea Ecommerce in Mexico Market Volume (K Unit) Forecast, by Application 2019 & 2032
- Table 91: ASEAN Ecommerce in Mexico Market Revenue (Million) Forecast, by Application 2019 & 2032
- Table 92: ASEAN Ecommerce in Mexico Market Volume (K Unit) Forecast, by Application 2019 & 2032
- Table 93: Oceania Ecommerce in Mexico Market Revenue (Million) Forecast, by Application 2019 & 2032
- Table 94: Oceania Ecommerce in Mexico Market Volume (K Unit) Forecast, by Application 2019 & 2032
- Table 95: Rest of Asia Pacific Ecommerce in Mexico Market Revenue (Million) Forecast, by Application 2019 & 2032
- Table 96: Rest of Asia Pacific Ecommerce in Mexico Market Volume (K Unit) Forecast, by Application 2019 & 2032
Frequently Asked Questions
1. What is the projected Compound Annual Growth Rate (CAGR) of the Ecommerce in Mexico Market?
The projected CAGR is approximately 13.27%.
2. Which companies are prominent players in the Ecommerce in Mexico Market?
Key companies in the market include Amazon, MercadoLibre Inc, Coppel, Walmart, Zegna, El Palacio de Hierro, Grainger, Shein, Costco, Sam's club, Liverpool.
3. What are the main segments of the Ecommerce in Mexico Market?
The market segments include Product Type , End-User .
4. Can you provide details about the market size?
The market size is estimated to be USD 28.95 Million as of 2022.
5. What are some drivers contributing to market growth?
Adoption of online mode of purchasing.
6. What are the notable trends driving market growth?
Adoption of online mode of purchasing.
7. Are there any restraints impacting market growth?
Privacy and Copyright Issues among E-sellers and Book Writers.
8. Can you provide examples of recent developments in the market?
April 2022 - Amazon Web Services, Inc. (AWS) announced the general availability of Amazon Aurora Serverless v2, the next generation of Amazon Aurora Serverless that automatically scales to hundreds of thousands of e-commerce transactions in a fraction of a second to support even the most demanding applications.
9. What pricing options are available for accessing the report?
Pricing options include single-user, multi-user, and enterprise licenses priced at USD 3800, USD 4500, and USD 5800 respectively.
10. Is the market size provided in terms of value or volume?
The market size is provided in terms of value, measured in Million and volume, measured in K Unit.
11. Are there any specific market keywords associated with the report?
Yes, the market keyword associated with the report is "Ecommerce in Mexico Market," which aids in identifying and referencing the specific market segment covered.
12. How do I determine which pricing option suits my needs best?
The pricing options vary based on user requirements and access needs. Individual users may opt for single-user licenses, while businesses requiring broader access may choose multi-user or enterprise licenses for cost-effective access to the report.
13. Are there any additional resources or data provided in the Ecommerce in Mexico Market report?
While the report offers comprehensive insights, it's advisable to review the specific contents or supplementary materials provided to ascertain if additional resources or data are available.
14. How can I stay updated on further developments or reports in the Ecommerce in Mexico Market?
To stay informed about further developments, trends, and reports in the Ecommerce in Mexico Market, consider subscribing to industry newsletters, following relevant companies and organizations, or regularly checking reputable industry news sources and publications.
Methodology
Step 1 - Identification of Relevant Samples Size from Population Database


Step 2 - Approaches for Defining Global Market Size (Value, Volume* & Price*)

Note*: In applicable scenarios
Step 3 - Data Sources
Primary Research
- Web Analytics
- Survey Reports
- Research Institute
- Latest Research Reports
- Opinion Leaders
Secondary Research
- Annual Reports
- White Paper
- Latest Press Release
- Industry Association
- Paid Database
- Investor Presentations

Step 4 - Data Triangulation
Involves using different sources of information in order to increase the validity of a study
These sources are likely to be stakeholders in a program - participants, other researchers, program staff, other community members, and so on.
Then we put all data in single framework & apply various statistical tools to find out the dynamic on the market.
During the analysis stage, feedback from the stakeholder groups would be compared to determine areas of agreement as well as areas of divergence


