

Key Insights
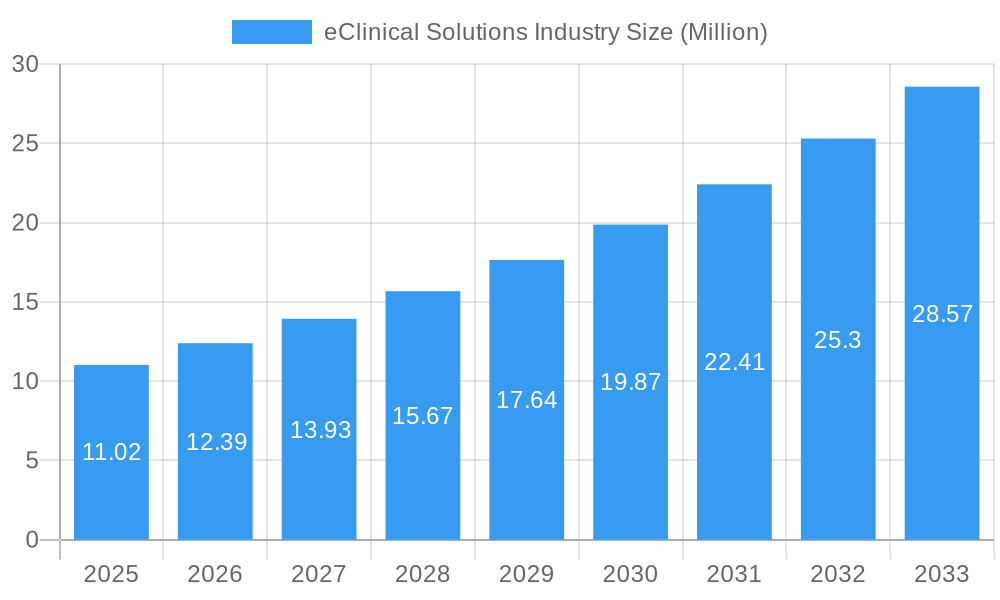
The eClinical Solutions market is experiencing robust growth, projected to reach $11.02 Million by 2025, with a compelling Compound Annual Growth Rate (CAGR) of 12.42% over the forecast period of 2025-2033. This expansion is fueled by a growing emphasis on streamlining clinical trial processes, enhancing data accuracy, and accelerating drug development timelines. Key drivers include the increasing complexity of clinical trials, the rising adoption of cloud-based solutions for their scalability and accessibility, and the persistent demand for efficient data management and analysis. The pharmaceutical and biotechnology sectors, alongside contract research organizations (CROs), represent the primary end-users, actively investing in these advanced technologies to gain a competitive edge in bringing novel therapies to market faster. The market is characterized by significant technological advancements, with platforms like Clinical Data Management Systems (CDMS), Clinical Trial Management Systems (CTMS), and Electronic Data Capture (EDC) systems at the forefront of innovation. The integration of artificial intelligence and machine learning is also emerging as a significant trend, promising to further revolutionize data analytics and predictive capabilities within clinical research.
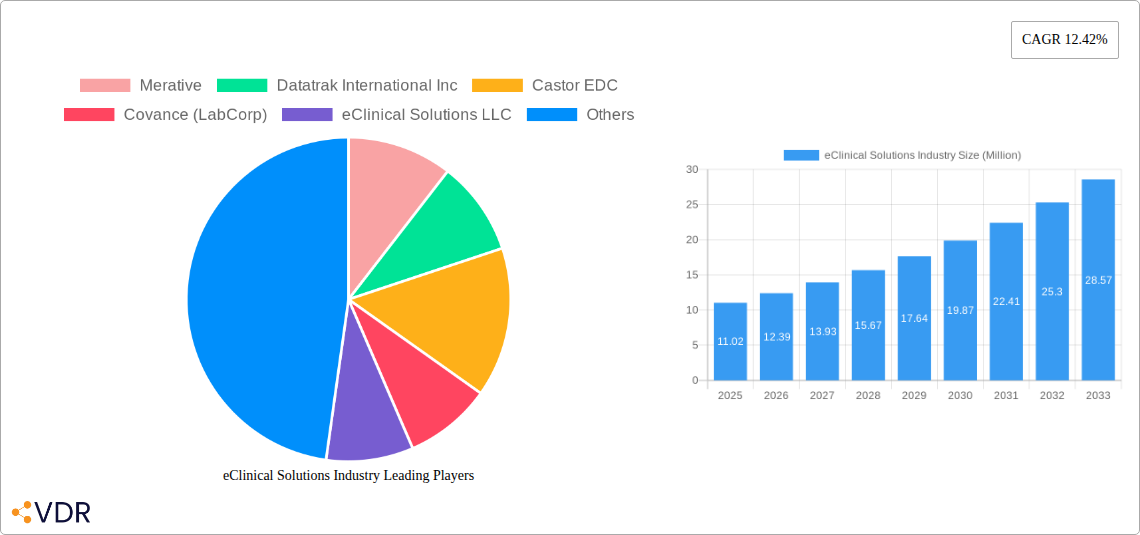
eClinical Solutions Industry Market Size (In Million)
Several factors contribute to the sustained upward trajectory of the eClinical Solutions market. The stringent regulatory landscape, coupled with the need for real-time data monitoring and compliance, propels the adoption of sophisticated eClinical tools. Furthermore, the increasing prevalence of chronic diseases and the subsequent surge in research and development activities by pharmaceutical and biotech companies directly translate into a higher demand for efficient clinical trial management. While the market benefits from numerous growth catalysts, potential restraints could include the high initial implementation costs for some solutions and the ongoing challenge of ensuring robust data security and privacy in an increasingly interconnected digital environment. However, the undeniable benefits of improved operational efficiency, reduced trial timelines, and enhanced data integrity are expected to outweigh these concerns, solidifying the eClinical Solutions market's position as a vital component of modern healthcare innovation. Key players like Veeva Systems, Oracle Corporation, and IQVIA Holdings Inc. are actively shaping this landscape through continuous product development and strategic acquisitions, driving the market towards greater integration and intelligence.
eClinical Solutions Industry Company Market Share
eClinical Solutions Industry Market Dynamics & Structure
The global eClinical solutions market is characterized by a moderately concentrated structure, with leading players like Veeva Systems, Oracle Corporation, and IQVIA Holdings Inc. holding significant market share. Technological innovation is the primary driver, fueled by the increasing demand for efficient, data-driven clinical trials and the growing adoption of cloud-based solutions. Robust regulatory frameworks, including those from the FDA and EMA, necessitate stringent compliance, pushing for more sophisticated and secure eClinical platforms. While competitive product substitutes exist, the specialized nature of eClinical software, encompassing Clinical Data Management Systems (CDMS), Clinical Trial Management Systems (CTMS), Electronic Data Capture (EDC), and Electronic Trial Master File (eTMF), limits direct competition. The primary end-users, pharmaceutical and biotechnology companies, along with Contract Research Organizations (CROs), are increasingly prioritizing integrated solutions. Mergers and acquisitions (M&A) are a notable trend, with companies seeking to expand their portfolios and geographical reach. For instance, recent M&A activities indicate a consolidation trend aiming to offer end-to-end clinical trial management capabilities. Barriers to innovation include the high cost of R&D, the lengthy validation processes for new software, and the need for deep domain expertise.
- Market Concentration: Moderately concentrated, with top players holding substantial market share.
- Technological Innovation Drivers: Demand for efficiency, data integrity, remote monitoring, and AI integration in clinical trials.
- Regulatory Frameworks: Stringent compliance requirements from global health authorities (FDA, EMA) drive demand for validated and secure solutions.
- Competitive Product Substitutes: Limited due to specialized functionalities, though some overlap exists in broader clinical trial software categories.
- End-User Demographics: Dominated by pharmaceutical & biotech companies and CROs, seeking integrated and scalable solutions.
- M&A Trends: Active consolidation to enhance service offerings and market presence.
eClinical Solutions Industry Growth Trends & Insights
The eClinical solutions market is poised for substantial expansion, driven by a confluence of factors that are reshaping the landscape of clinical research. Market size is projected to grow from approximately $12,500 million in 2025 to $22,800 million by 2033, exhibiting a Compound Annual Growth Rate (CAGR) of approximately 7.8% during the forecast period of 2025–2033. This robust growth trajectory is underpinned by a significant increase in adoption rates of eClinical technologies across all stages of clinical development. The shift towards cloud-based eClinical solutions, offering enhanced scalability, accessibility, and cost-effectiveness, is a key driver. This trend is further accelerated by the growing complexity of clinical trials, the rise of decentralized clinical trials (DCTs), and the imperative for real-time data analytics and artificial intelligence (AI) integration.
Technological disruptions, such as the integration of AI and machine learning (ML) for predictive analytics, patient recruitment optimization, and data anomaly detection, are revolutionizing trial efficiency and data quality. Consumer behavior shifts are also playing a role; patients are increasingly comfortable with digital health technologies, which supports the adoption of remote patient monitoring and direct-to-patient trial models. The sheer volume of data generated in clinical trials necessitates sophisticated management and analysis tools, further fueling demand for advanced eClinical platforms. The historical period of 2019–2024 has witnessed a steady rise in eClinical adoption, with the base year of 2025 setting the stage for accelerated growth. The industry is moving towards a more agile and data-centric approach, where eClinical solutions are no longer just compliance tools but strategic assets for optimizing trial outcomes and reducing time-to-market for new therapies. The increasing investment in drug discovery and development, particularly in areas like oncology and rare diseases, directly translates to a higher demand for robust eClinical infrastructure to manage the ensuing clinical trials effectively. Furthermore, the global emphasis on personalized medicine and the growing number of complex adaptive trials are creating a fertile ground for advanced eClinical functionalities.
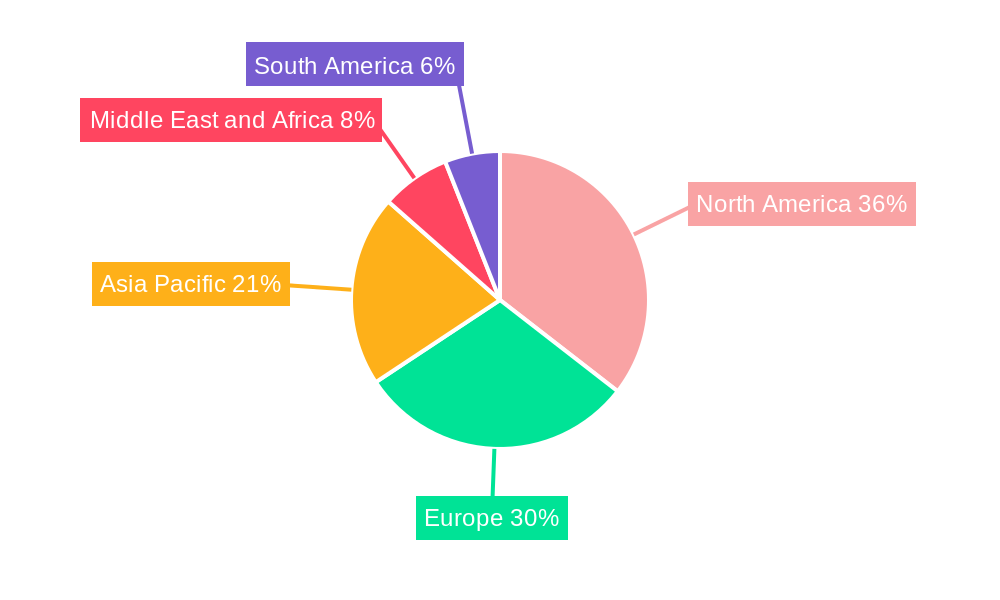
Dominant Regions, Countries, or Segments in eClinical Solutions Industry
The eClinical solutions industry is witnessing a dominant growth trajectory driven by specific segments and geographical regions that are at the forefront of clinical research innovation and adoption. Among the Product Types, Clinical Data Management Systems (CDMS) and Electronic Data Capture (EDC) solutions are currently leading the market, accounting for a significant portion of the market share, estimated to be over 35% combined in 2025. This dominance stems from their foundational role in collecting, cleaning, and managing trial data, which is critical for ensuring data integrity and regulatory compliance. Electronic Trial Master File (eTMF) systems are also experiencing rapid growth, driven by the need for centralized and compliant management of essential trial documents.
In terms of Deployment Mode, Cloud-based eClinical Solutions are unequivocally dominating the market, projected to capture over 75% of the market share in 2025. This overwhelming preference for cloud solutions is attributed to their inherent scalability, flexibility, enhanced accessibility for global research teams, and often, a more predictable cost structure compared to on-premise alternatives. Cloud platforms facilitate seamless collaboration, faster study builds, and easier integration with other clinical trial technologies.
The End User segment is primarily led by Pharmaceutical and Biotechnology Companies, who are estimated to hold over 60% of the market share in 2025. Their substantial investment in research and development, coupled with the inherent complexity and regulatory demands of drug development, makes them the largest consumers of eClinical solutions. Contract Research Organizations (CROs) follow closely, representing approximately 30% of the market share, as they increasingly leverage these technologies to offer efficient and compliant services to their clients.
Geographically, North America currently leads the eClinical solutions market, holding an estimated 45% of the global market share in 2025. This dominance is fueled by a mature pharmaceutical and biotechnology sector, a high concentration of leading CROs, a well-established regulatory framework (FDA), and significant investment in clinical research infrastructure. The region's early adoption of digital health technologies and its role as a hub for innovation in drug development further solidify its leadership. Following North America, Europe is the second-largest market, driven by a robust life sciences industry, strong government support for R&D, and increasing collaboration among European research institutions.
- Dominant Product Types: Clinical Data Management Systems (CDMS), Electronic Data Capture (EDC), Electronic Trial Master File (eTMF).
- Leading Deployment Mode: Cloud-based eClinical Solutions, accounting for a significant majority.
- Primary End Users: Pharmaceutical and Biotechnology Companies, followed by Contract Research Organizations (CROs).
- Key Geographical Market: North America, due to its advanced life sciences ecosystem and regulatory landscape.
eClinical Solutions Industry Product Landscape
The eClinical solutions product landscape is characterized by innovation focused on streamlining clinical trials and enhancing data integrity. Key product types include robust Clinical Data Management Systems (CDMS) for efficient data cleaning and validation, comprehensive Clinical Trial Management Systems (CTMS) for oversight and control, and advanced Electronic Data Capture (EDC) systems for real-time data entry and validation. Randomization and Trial Supply Management solutions ensure proper allocation of treatments and efficient drug distribution. Clinical Analytics Platforms are increasingly integrated, offering powerful insights from trial data, while Electronic Trial Master File (eTMF) systems centralize critical study documentation. These products often feature user-friendly interfaces, advanced security protocols, and interoperability capabilities. Unique selling propositions include AI-powered anomaly detection, real-time dashboards, and seamless integration across the entire clinical trial lifecycle, leading to faster study completion and improved data quality.
Key Drivers, Barriers & Challenges in eClinical Solutions Industry
Key Drivers: The eClinical solutions industry is propelled by several key drivers. The increasing complexity and global nature of clinical trials necessitate advanced technology for efficient data management and regulatory compliance. Government initiatives promoting digital health and data security further encourage adoption. The demand for faster drug development timelines and cost reduction strategies makes eClinical solutions indispensable. Advancements in AI and machine learning are enabling more sophisticated data analytics and predictive capabilities, enhancing trial efficiency and patient outcomes.
Key Barriers & Challenges: Despite the growth, the industry faces challenges. High implementation costs and the need for extensive user training can be significant barriers, particularly for smaller organizations. Stringent regulatory requirements and data privacy concerns (e.g., GDPR, HIPAA) demand robust security measures and continuous compliance updates. Interoperability issues between different eClinical systems and legacy IT infrastructures can hinder seamless data flow. Furthermore, the ongoing shortage of skilled personnel capable of managing and utilizing these advanced platforms poses a challenge to widespread adoption and effective implementation. Supply chain issues are generally less impactful on software compared to physical goods, but disruptions in IT infrastructure or cloud service providers could indirectly affect accessibility.
Emerging Opportunities in eClinical Solutions Industry
Emerging opportunities in the eClinical solutions industry lie in the continued expansion of decentralized clinical trials (DCTs) and the integration of artificial intelligence (AI) and machine learning (ML) across the entire trial lifecycle. Untapped markets include the growing number of early-stage biotech companies and emerging economies with developing healthcare infrastructure, which are increasingly recognizing the benefits of eClinical adoption. Innovative applications such as real-time patient monitoring via wearable devices, predictive analytics for patient recruitment and retention, and automated data quality checks present significant growth avenues. Evolving consumer preferences for more convenient and less invasive trial participation are further driving demand for remote and hybrid trial models enabled by eClinical solutions. The increasing focus on rare disease research and personalized medicine also opens up opportunities for highly specialized and adaptable eClinical platforms.
Growth Accelerators in the eClinical Solutions Industry Industry
Several catalysts are accelerating the growth of the eClinical solutions industry. Technological breakthroughs, particularly in AI and cloud computing, are enabling more powerful, scalable, and accessible solutions. Strategic partnerships between eClinical vendors and pharmaceutical companies, CROs, and technology providers are fostering innovation and expanding market reach. The increasing adoption of integrated platforms that offer end-to-end clinical trial management capabilities is a significant growth accelerator, reducing inefficiencies and improving collaboration. Market expansion strategies targeting emerging economies and niche therapeutic areas are also contributing to sustained growth. The growing emphasis on data analytics and real-world evidence (RWE) generation is further pushing the demand for advanced eClinical tools that can effectively capture and process diverse data sources.
Key Players Shaping the eClinical Solutions Industry Market
- Merative
- Datatrak International Inc
- Castor EDC
- Covance (LabCorp)
- eClinical Solutions LLC
- Saama Technologies Inc
- Dassault Systemes (Medidata Solutions Inc)
- Mednet Solutions
- Clario (BioClinicia Inc)
- Signant Health
- IQVIA Holdings Inc
- PAREXEL International Corporation (Calyx)
- Oracle Corporation
- Medrio Inc
- Veeva Systems
Notable Milestones in eClinical Solutions Industry Sector
- January 2023: Veeva Systems was selected by Adare Pharma Solutions to implement its Veeva Vault Quality Suite, aimed at harmonizing quality systems across the organization, enhancing operational efficiency and compliance.
- May 2022: Emmes introduced its third-generation Advantage eClinical platform, a cloud-based system designed for faster study builds, increased flexibility, and improved insights for clinical trial sponsors of all sizes, at the Society for Clinical Trials (SCT) conference.
In-Depth eClinical Solutions Industry Market Outlook
The future outlook for the eClinical solutions industry is exceptionally promising, driven by sustained demand for efficiency, data integrity, and regulatory compliance in clinical research. Growth accelerators such as the pervasive adoption of cloud-based infrastructure, the increasing sophistication of AI and ML for trial optimization, and the rise of decentralized clinical trials will continue to shape the market. Strategic opportunities lie in developing highly integrated, user-centric platforms that can cater to the evolving needs of pharmaceutical companies and CROs, particularly in niche therapeutic areas and emerging markets. The ongoing digital transformation of healthcare, coupled with significant investments in drug discovery and development, ensures that eClinical solutions will remain critical enablers of innovation and faster therapeutic advancements. The market is set to expand its reach by offering solutions that not only improve operational aspects but also contribute significantly to generating real-world evidence and facilitating personalized medicine approaches.
eClinical Solutions Industry Segmentation
-
1. Product Type
- 1.1. Clinical Data Management Systems (CDMS)
- 1.2. Clinical Trial Management Systems (CTMS)
- 1.3. Randomization and Trial Supply Management
- 1.4. Electronic Data Capture (EDC)
- 1.5. Electron
- 1.6. Clinical Analytics Platforms
- 1.7. Electronic Trial Master File (eTMF)
- 1.8. Other Product Types
-
2. Deployment Mode
- 2.1. Cloud-based eClinical Solutions
- 2.2. On-premise eClinical Solutions
-
3. End User
- 3.1. Pharmaceutical and Biotechnology Companies
- 3.2. Contract Research Organizations (CROs)
- 3.3. Other End Users
eClinical Solutions Industry Segmentation By Geography
-
1. North America
- 1.1. United States
- 1.2. Canada
- 1.3. Mexico
-
2. Europe
- 2.1. Germany
- 2.2. United kingdom
- 2.3. France
- 2.4. Italy
- 2.5. Spain
- 2.6. Rest of Europe
-
3. Asia Pacific
- 3.1. China
- 3.2. Japan
- 3.3. India
- 3.4. Australia
- 3.5. South Korea
- 3.6. Rest of Asia Pacific
-
4. Middle East and Africa
- 4.1. GCC
- 4.2. South Africa
- 4.3. Rest of Middle East and Africa
-
5. South America
- 5.1. Brazil
- 5.2. Argentina
- 5.3. Rest of South America
eClinical Solutions Industry Regional Market Share
Geographic Coverage of eClinical Solutions Industry
eClinical Solutions Industry REPORT HIGHLIGHTS
| Aspects | Details |
|---|---|
| Study Period | 2020-2034 |
| Base Year | 2025 |
| Estimated Year | 2026 |
| Forecast Period | 2026-2034 |
| Historical Period | 2020-2025 |
| Growth Rate | CAGR of 12.42% from 2020-2034 |
| Segmentation |
|
Table of Contents
- 1. Introduction
- 1.1. Research Scope
- 1.2. Market Segmentation
- 1.3. Research Objective
- 1.4. Definitions and Assumptions
- 2. Executive Summary
- 2.1. Market Snapshot
- 3. Market Dynamics
- 3.1. Market Drivers
- 3.2. Market Restrains
- 3.3. Market Trends
- 3.4. Market Opportunities
- 4. Market Factor Analysis
- 4.1. Porters Five Forces
- 4.1.1. Bargaining Power of Suppliers
- 4.1.2. Bargaining Power of Buyers
- 4.1.3. Threat of New Entrants
- 4.1.4. Threat of Substitutes
- 4.1.5. Competitive Rivalry
- 4.2. PESTEL analysis
- 4.3. BCG Analysis
- 4.3.1. Stars (High Growth, High Market Share)
- 4.3.2. Cash Cows (Low Growth, High Market Share)
- 4.3.3. Question Mark (High Growth, Low Market Share)
- 4.3.4. Dogs (Low Growth, Low Market Share)
- 4.4. Ansoff Matrix Analysis
- 4.5. Supply Chain Analysis
- 4.6. Regulatory Landscape
- 4.7. Current Market Potential and Opportunity Assessment (TAM–SAM–SOM Framework)
- 4.8. VDR Analyst Note
- 4.1. Porters Five Forces
- 5. Market Analysis, Insights and Forecast 2021-2033
- 5.1. Market Analysis, Insights and Forecast - by Product Type
- 5.1.1. Clinical Data Management Systems (CDMS)
- 5.1.2. Clinical Trial Management Systems (CTMS)
- 5.1.3. Randomization and Trial Supply Management
- 5.1.4. Electronic Data Capture (EDC)
- 5.1.5. Electron
- 5.1.6. Clinical Analytics Platforms
- 5.1.7. Electronic Trial Master File (eTMF)
- 5.1.8. Other Product Types
- 5.2. Market Analysis, Insights and Forecast - by Deployment Mode
- 5.2.1. Cloud-based eClinical Solutions
- 5.2.2. On-premise eClinical Solutions
- 5.3. Market Analysis, Insights and Forecast - by End User
- 5.3.1. Pharmaceutical and Biotechnology Companies
- 5.3.2. Contract Research Organizations (CROs)
- 5.3.3. Other End Users
- 5.4. Market Analysis, Insights and Forecast - by Region
- 5.4.1. North America
- 5.4.2. Europe
- 5.4.3. Asia Pacific
- 5.4.4. Middle East and Africa
- 5.4.5. South America
- 5.1. Market Analysis, Insights and Forecast - by Product Type
- 6. Global eClinical Solutions Industry Analysis, Insights and Forecast, 2021-2033
- 6.1. Market Analysis, Insights and Forecast - by Product Type
- 6.1.1. Clinical Data Management Systems (CDMS)
- 6.1.2. Clinical Trial Management Systems (CTMS)
- 6.1.3. Randomization and Trial Supply Management
- 6.1.4. Electronic Data Capture (EDC)
- 6.1.5. Electron
- 6.1.6. Clinical Analytics Platforms
- 6.1.7. Electronic Trial Master File (eTMF)
- 6.1.8. Other Product Types
- 6.2. Market Analysis, Insights and Forecast - by Deployment Mode
- 6.2.1. Cloud-based eClinical Solutions
- 6.2.2. On-premise eClinical Solutions
- 6.3. Market Analysis, Insights and Forecast - by End User
- 6.3.1. Pharmaceutical and Biotechnology Companies
- 6.3.2. Contract Research Organizations (CROs)
- 6.3.3. Other End Users
- 6.1. Market Analysis, Insights and Forecast - by Product Type
- 7. North America eClinical Solutions Industry Analysis, Insights and Forecast, 2021-2033
- 7.1. Market Analysis, Insights and Forecast - by Product Type
- 7.1.1. Clinical Data Management Systems (CDMS)
- 7.1.2. Clinical Trial Management Systems (CTMS)
- 7.1.3. Randomization and Trial Supply Management
- 7.1.4. Electronic Data Capture (EDC)
- 7.1.5. Electron
- 7.1.6. Clinical Analytics Platforms
- 7.1.7. Electronic Trial Master File (eTMF)
- 7.1.8. Other Product Types
- 7.2. Market Analysis, Insights and Forecast - by Deployment Mode
- 7.2.1. Cloud-based eClinical Solutions
- 7.2.2. On-premise eClinical Solutions
- 7.3. Market Analysis, Insights and Forecast - by End User
- 7.3.1. Pharmaceutical and Biotechnology Companies
- 7.3.2. Contract Research Organizations (CROs)
- 7.3.3. Other End Users
- 7.1. Market Analysis, Insights and Forecast - by Product Type
- 8. Europe eClinical Solutions Industry Analysis, Insights and Forecast, 2021-2033
- 8.1. Market Analysis, Insights and Forecast - by Product Type
- 8.1.1. Clinical Data Management Systems (CDMS)
- 8.1.2. Clinical Trial Management Systems (CTMS)
- 8.1.3. Randomization and Trial Supply Management
- 8.1.4. Electronic Data Capture (EDC)
- 8.1.5. Electron
- 8.1.6. Clinical Analytics Platforms
- 8.1.7. Electronic Trial Master File (eTMF)
- 8.1.8. Other Product Types
- 8.2. Market Analysis, Insights and Forecast - by Deployment Mode
- 8.2.1. Cloud-based eClinical Solutions
- 8.2.2. On-premise eClinical Solutions
- 8.3. Market Analysis, Insights and Forecast - by End User
- 8.3.1. Pharmaceutical and Biotechnology Companies
- 8.3.2. Contract Research Organizations (CROs)
- 8.3.3. Other End Users
- 8.1. Market Analysis, Insights and Forecast - by Product Type
- 9. Asia Pacific eClinical Solutions Industry Analysis, Insights and Forecast, 2021-2033
- 9.1. Market Analysis, Insights and Forecast - by Product Type
- 9.1.1. Clinical Data Management Systems (CDMS)
- 9.1.2. Clinical Trial Management Systems (CTMS)
- 9.1.3. Randomization and Trial Supply Management
- 9.1.4. Electronic Data Capture (EDC)
- 9.1.5. Electron
- 9.1.6. Clinical Analytics Platforms
- 9.1.7. Electronic Trial Master File (eTMF)
- 9.1.8. Other Product Types
- 9.2. Market Analysis, Insights and Forecast - by Deployment Mode
- 9.2.1. Cloud-based eClinical Solutions
- 9.2.2. On-premise eClinical Solutions
- 9.3. Market Analysis, Insights and Forecast - by End User
- 9.3.1. Pharmaceutical and Biotechnology Companies
- 9.3.2. Contract Research Organizations (CROs)
- 9.3.3. Other End Users
- 9.1. Market Analysis, Insights and Forecast - by Product Type
- 10. Middle East and Africa eClinical Solutions Industry Analysis, Insights and Forecast, 2021-2033
- 10.1. Market Analysis, Insights and Forecast - by Product Type
- 10.1.1. Clinical Data Management Systems (CDMS)
- 10.1.2. Clinical Trial Management Systems (CTMS)
- 10.1.3. Randomization and Trial Supply Management
- 10.1.4. Electronic Data Capture (EDC)
- 10.1.5. Electron
- 10.1.6. Clinical Analytics Platforms
- 10.1.7. Electronic Trial Master File (eTMF)
- 10.1.8. Other Product Types
- 10.2. Market Analysis, Insights and Forecast - by Deployment Mode
- 10.2.1. Cloud-based eClinical Solutions
- 10.2.2. On-premise eClinical Solutions
- 10.3. Market Analysis, Insights and Forecast - by End User
- 10.3.1. Pharmaceutical and Biotechnology Companies
- 10.3.2. Contract Research Organizations (CROs)
- 10.3.3. Other End Users
- 10.1. Market Analysis, Insights and Forecast - by Product Type
- 11. South America eClinical Solutions Industry Analysis, Insights and Forecast, 2021-2033
- 11.1. Market Analysis, Insights and Forecast - by Product Type
- 11.1.1. Clinical Data Management Systems (CDMS)
- 11.1.2. Clinical Trial Management Systems (CTMS)
- 11.1.3. Randomization and Trial Supply Management
- 11.1.4. Electronic Data Capture (EDC)
- 11.1.5. Electron
- 11.1.6. Clinical Analytics Platforms
- 11.1.7. Electronic Trial Master File (eTMF)
- 11.1.8. Other Product Types
- 11.2. Market Analysis, Insights and Forecast - by Deployment Mode
- 11.2.1. Cloud-based eClinical Solutions
- 11.2.2. On-premise eClinical Solutions
- 11.3. Market Analysis, Insights and Forecast - by End User
- 11.3.1. Pharmaceutical and Biotechnology Companies
- 11.3.2. Contract Research Organizations (CROs)
- 11.3.3. Other End Users
- 11.1. Market Analysis, Insights and Forecast - by Product Type
- 12. Competitive Analysis
- 12.1. Company Profiles
- 12.1.1 Merative
- 12.1.1.1. Company Overview
- 12.1.1.2. Products
- 12.1.1.3. Company Financials
- 12.1.1.4. SWOT Analysis
- 12.1.2 Datatrak International Inc
- 12.1.2.1. Company Overview
- 12.1.2.2. Products
- 12.1.2.3. Company Financials
- 12.1.2.4. SWOT Analysis
- 12.1.3 Castor EDC
- 12.1.3.1. Company Overview
- 12.1.3.2. Products
- 12.1.3.3. Company Financials
- 12.1.3.4. SWOT Analysis
- 12.1.4 Covance (LabCorp)
- 12.1.4.1. Company Overview
- 12.1.4.2. Products
- 12.1.4.3. Company Financials
- 12.1.4.4. SWOT Analysis
- 12.1.5 eClinical Solutions LLC
- 12.1.5.1. Company Overview
- 12.1.5.2. Products
- 12.1.5.3. Company Financials
- 12.1.5.4. SWOT Analysis
- 12.1.6 Saama Technologies Inc
- 12.1.6.1. Company Overview
- 12.1.6.2. Products
- 12.1.6.3. Company Financials
- 12.1.6.4. SWOT Analysis
- 12.1.7 Dassault Systemes (Medidata Solutions Inc )
- 12.1.7.1. Company Overview
- 12.1.7.2. Products
- 12.1.7.3. Company Financials
- 12.1.7.4. SWOT Analysis
- 12.1.8 Mednet Solutions
- 12.1.8.1. Company Overview
- 12.1.8.2. Products
- 12.1.8.3. Company Financials
- 12.1.8.4. SWOT Analysis
- 12.1.9 Clario (BioClinicia Inc )
- 12.1.9.1. Company Overview
- 12.1.9.2. Products
- 12.1.9.3. Company Financials
- 12.1.9.4. SWOT Analysis
- 12.1.10 Signant Health
- 12.1.10.1. Company Overview
- 12.1.10.2. Products
- 12.1.10.3. Company Financials
- 12.1.10.4. SWOT Analysis
- 12.1.11 IQVIA Holdings Inc
- 12.1.11.1. Company Overview
- 12.1.11.2. Products
- 12.1.11.3. Company Financials
- 12.1.11.4. SWOT Analysis
- 12.1.12 PAREXEL International Corporation (Calyx)
- 12.1.12.1. Company Overview
- 12.1.12.2. Products
- 12.1.12.3. Company Financials
- 12.1.12.4. SWOT Analysis
- 12.1.13 Oracle Corporation
- 12.1.13.1. Company Overview
- 12.1.13.2. Products
- 12.1.13.3. Company Financials
- 12.1.13.4. SWOT Analysis
- 12.1.14 Medrio Inc
- 12.1.14.1. Company Overview
- 12.1.14.2. Products
- 12.1.14.3. Company Financials
- 12.1.14.4. SWOT Analysis
- 12.1.15 Veeva Systems
- 12.1.15.1. Company Overview
- 12.1.15.2. Products
- 12.1.15.3. Company Financials
- 12.1.15.4. SWOT Analysis
- 12.1.1 Merative
- 12.2. Market Entropy
- 12.2.1 Company's Key Areas Served
- 12.2.2 Recent Developments
- 12.3. Company Market Share Analysis 2025
- 12.3.1 Top 5 Companies Market Share Analysis
- 12.3.2 Top 3 Companies Market Share Analysis
- 12.4. List of Potential Customers
- 13. Research Methodology
List of Figures
- Figure 1: Global eClinical Solutions Industry Revenue Breakdown (Million, %) by Region 2025 & 2033
- Figure 2: Global eClinical Solutions Industry Volume Breakdown (K Unit, %) by Region 2025 & 2033
- Figure 3: North America eClinical Solutions Industry Revenue (Million), by Product Type 2025 & 2033
- Figure 4: North America eClinical Solutions Industry Volume (K Unit), by Product Type 2025 & 2033
- Figure 5: North America eClinical Solutions Industry Revenue Share (%), by Product Type 2025 & 2033
- Figure 6: North America eClinical Solutions Industry Volume Share (%), by Product Type 2025 & 2033
- Figure 7: North America eClinical Solutions Industry Revenue (Million), by Deployment Mode 2025 & 2033
- Figure 8: North America eClinical Solutions Industry Volume (K Unit), by Deployment Mode 2025 & 2033
- Figure 9: North America eClinical Solutions Industry Revenue Share (%), by Deployment Mode 2025 & 2033
- Figure 10: North America eClinical Solutions Industry Volume Share (%), by Deployment Mode 2025 & 2033
- Figure 11: North America eClinical Solutions Industry Revenue (Million), by End User 2025 & 2033
- Figure 12: North America eClinical Solutions Industry Volume (K Unit), by End User 2025 & 2033
- Figure 13: North America eClinical Solutions Industry Revenue Share (%), by End User 2025 & 2033
- Figure 14: North America eClinical Solutions Industry Volume Share (%), by End User 2025 & 2033
- Figure 15: North America eClinical Solutions Industry Revenue (Million), by Country 2025 & 2033
- Figure 16: North America eClinical Solutions Industry Volume (K Unit), by Country 2025 & 2033
- Figure 17: North America eClinical Solutions Industry Revenue Share (%), by Country 2025 & 2033
- Figure 18: North America eClinical Solutions Industry Volume Share (%), by Country 2025 & 2033
- Figure 19: Europe eClinical Solutions Industry Revenue (Million), by Product Type 2025 & 2033
- Figure 20: Europe eClinical Solutions Industry Volume (K Unit), by Product Type 2025 & 2033
- Figure 21: Europe eClinical Solutions Industry Revenue Share (%), by Product Type 2025 & 2033
- Figure 22: Europe eClinical Solutions Industry Volume Share (%), by Product Type 2025 & 2033
- Figure 23: Europe eClinical Solutions Industry Revenue (Million), by Deployment Mode 2025 & 2033
- Figure 24: Europe eClinical Solutions Industry Volume (K Unit), by Deployment Mode 2025 & 2033
- Figure 25: Europe eClinical Solutions Industry Revenue Share (%), by Deployment Mode 2025 & 2033
- Figure 26: Europe eClinical Solutions Industry Volume Share (%), by Deployment Mode 2025 & 2033
- Figure 27: Europe eClinical Solutions Industry Revenue (Million), by End User 2025 & 2033
- Figure 28: Europe eClinical Solutions Industry Volume (K Unit), by End User 2025 & 2033
- Figure 29: Europe eClinical Solutions Industry Revenue Share (%), by End User 2025 & 2033
- Figure 30: Europe eClinical Solutions Industry Volume Share (%), by End User 2025 & 2033
- Figure 31: Europe eClinical Solutions Industry Revenue (Million), by Country 2025 & 2033
- Figure 32: Europe eClinical Solutions Industry Volume (K Unit), by Country 2025 & 2033
- Figure 33: Europe eClinical Solutions Industry Revenue Share (%), by Country 2025 & 2033
- Figure 34: Europe eClinical Solutions Industry Volume Share (%), by Country 2025 & 2033
- Figure 35: Asia Pacific eClinical Solutions Industry Revenue (Million), by Product Type 2025 & 2033
- Figure 36: Asia Pacific eClinical Solutions Industry Volume (K Unit), by Product Type 2025 & 2033
- Figure 37: Asia Pacific eClinical Solutions Industry Revenue Share (%), by Product Type 2025 & 2033
- Figure 38: Asia Pacific eClinical Solutions Industry Volume Share (%), by Product Type 2025 & 2033
- Figure 39: Asia Pacific eClinical Solutions Industry Revenue (Million), by Deployment Mode 2025 & 2033
- Figure 40: Asia Pacific eClinical Solutions Industry Volume (K Unit), by Deployment Mode 2025 & 2033
- Figure 41: Asia Pacific eClinical Solutions Industry Revenue Share (%), by Deployment Mode 2025 & 2033
- Figure 42: Asia Pacific eClinical Solutions Industry Volume Share (%), by Deployment Mode 2025 & 2033
- Figure 43: Asia Pacific eClinical Solutions Industry Revenue (Million), by End User 2025 & 2033
- Figure 44: Asia Pacific eClinical Solutions Industry Volume (K Unit), by End User 2025 & 2033
- Figure 45: Asia Pacific eClinical Solutions Industry Revenue Share (%), by End User 2025 & 2033
- Figure 46: Asia Pacific eClinical Solutions Industry Volume Share (%), by End User 2025 & 2033
- Figure 47: Asia Pacific eClinical Solutions Industry Revenue (Million), by Country 2025 & 2033
- Figure 48: Asia Pacific eClinical Solutions Industry Volume (K Unit), by Country 2025 & 2033
- Figure 49: Asia Pacific eClinical Solutions Industry Revenue Share (%), by Country 2025 & 2033
- Figure 50: Asia Pacific eClinical Solutions Industry Volume Share (%), by Country 2025 & 2033
- Figure 51: Middle East and Africa eClinical Solutions Industry Revenue (Million), by Product Type 2025 & 2033
- Figure 52: Middle East and Africa eClinical Solutions Industry Volume (K Unit), by Product Type 2025 & 2033
- Figure 53: Middle East and Africa eClinical Solutions Industry Revenue Share (%), by Product Type 2025 & 2033
- Figure 54: Middle East and Africa eClinical Solutions Industry Volume Share (%), by Product Type 2025 & 2033
- Figure 55: Middle East and Africa eClinical Solutions Industry Revenue (Million), by Deployment Mode 2025 & 2033
- Figure 56: Middle East and Africa eClinical Solutions Industry Volume (K Unit), by Deployment Mode 2025 & 2033
- Figure 57: Middle East and Africa eClinical Solutions Industry Revenue Share (%), by Deployment Mode 2025 & 2033
- Figure 58: Middle East and Africa eClinical Solutions Industry Volume Share (%), by Deployment Mode 2025 & 2033
- Figure 59: Middle East and Africa eClinical Solutions Industry Revenue (Million), by End User 2025 & 2033
- Figure 60: Middle East and Africa eClinical Solutions Industry Volume (K Unit), by End User 2025 & 2033
- Figure 61: Middle East and Africa eClinical Solutions Industry Revenue Share (%), by End User 2025 & 2033
- Figure 62: Middle East and Africa eClinical Solutions Industry Volume Share (%), by End User 2025 & 2033
- Figure 63: Middle East and Africa eClinical Solutions Industry Revenue (Million), by Country 2025 & 2033
- Figure 64: Middle East and Africa eClinical Solutions Industry Volume (K Unit), by Country 2025 & 2033
- Figure 65: Middle East and Africa eClinical Solutions Industry Revenue Share (%), by Country 2025 & 2033
- Figure 66: Middle East and Africa eClinical Solutions Industry Volume Share (%), by Country 2025 & 2033
- Figure 67: South America eClinical Solutions Industry Revenue (Million), by Product Type 2025 & 2033
- Figure 68: South America eClinical Solutions Industry Volume (K Unit), by Product Type 2025 & 2033
- Figure 69: South America eClinical Solutions Industry Revenue Share (%), by Product Type 2025 & 2033
- Figure 70: South America eClinical Solutions Industry Volume Share (%), by Product Type 2025 & 2033
- Figure 71: South America eClinical Solutions Industry Revenue (Million), by Deployment Mode 2025 & 2033
- Figure 72: South America eClinical Solutions Industry Volume (K Unit), by Deployment Mode 2025 & 2033
- Figure 73: South America eClinical Solutions Industry Revenue Share (%), by Deployment Mode 2025 & 2033
- Figure 74: South America eClinical Solutions Industry Volume Share (%), by Deployment Mode 2025 & 2033
- Figure 75: South America eClinical Solutions Industry Revenue (Million), by End User 2025 & 2033
- Figure 76: South America eClinical Solutions Industry Volume (K Unit), by End User 2025 & 2033
- Figure 77: South America eClinical Solutions Industry Revenue Share (%), by End User 2025 & 2033
- Figure 78: South America eClinical Solutions Industry Volume Share (%), by End User 2025 & 2033
- Figure 79: South America eClinical Solutions Industry Revenue (Million), by Country 2025 & 2033
- Figure 80: South America eClinical Solutions Industry Volume (K Unit), by Country 2025 & 2033
- Figure 81: South America eClinical Solutions Industry Revenue Share (%), by Country 2025 & 2033
- Figure 82: South America eClinical Solutions Industry Volume Share (%), by Country 2025 & 2033
List of Tables
- Table 1: Global eClinical Solutions Industry Revenue Million Forecast, by Product Type 2020 & 2033
- Table 2: Global eClinical Solutions Industry Volume K Unit Forecast, by Product Type 2020 & 2033
- Table 3: Global eClinical Solutions Industry Revenue Million Forecast, by Deployment Mode 2020 & 2033
- Table 4: Global eClinical Solutions Industry Volume K Unit Forecast, by Deployment Mode 2020 & 2033
- Table 5: Global eClinical Solutions Industry Revenue Million Forecast, by End User 2020 & 2033
- Table 6: Global eClinical Solutions Industry Volume K Unit Forecast, by End User 2020 & 2033
- Table 7: Global eClinical Solutions Industry Revenue Million Forecast, by Region 2020 & 2033
- Table 8: Global eClinical Solutions Industry Volume K Unit Forecast, by Region 2020 & 2033
- Table 9: Global eClinical Solutions Industry Revenue Million Forecast, by Product Type 2020 & 2033
- Table 10: Global eClinical Solutions Industry Volume K Unit Forecast, by Product Type 2020 & 2033
- Table 11: Global eClinical Solutions Industry Revenue Million Forecast, by Deployment Mode 2020 & 2033
- Table 12: Global eClinical Solutions Industry Volume K Unit Forecast, by Deployment Mode 2020 & 2033
- Table 13: Global eClinical Solutions Industry Revenue Million Forecast, by End User 2020 & 2033
- Table 14: Global eClinical Solutions Industry Volume K Unit Forecast, by End User 2020 & 2033
- Table 15: Global eClinical Solutions Industry Revenue Million Forecast, by Country 2020 & 2033
- Table 16: Global eClinical Solutions Industry Volume K Unit Forecast, by Country 2020 & 2033
- Table 17: United States eClinical Solutions Industry Revenue (Million) Forecast, by Application 2020 & 2033
- Table 18: United States eClinical Solutions Industry Volume (K Unit) Forecast, by Application 2020 & 2033
- Table 19: Canada eClinical Solutions Industry Revenue (Million) Forecast, by Application 2020 & 2033
- Table 20: Canada eClinical Solutions Industry Volume (K Unit) Forecast, by Application 2020 & 2033
- Table 21: Mexico eClinical Solutions Industry Revenue (Million) Forecast, by Application 2020 & 2033
- Table 22: Mexico eClinical Solutions Industry Volume (K Unit) Forecast, by Application 2020 & 2033
- Table 23: Global eClinical Solutions Industry Revenue Million Forecast, by Product Type 2020 & 2033
- Table 24: Global eClinical Solutions Industry Volume K Unit Forecast, by Product Type 2020 & 2033
- Table 25: Global eClinical Solutions Industry Revenue Million Forecast, by Deployment Mode 2020 & 2033
- Table 26: Global eClinical Solutions Industry Volume K Unit Forecast, by Deployment Mode 2020 & 2033
- Table 27: Global eClinical Solutions Industry Revenue Million Forecast, by End User 2020 & 2033
- Table 28: Global eClinical Solutions Industry Volume K Unit Forecast, by End User 2020 & 2033
- Table 29: Global eClinical Solutions Industry Revenue Million Forecast, by Country 2020 & 2033
- Table 30: Global eClinical Solutions Industry Volume K Unit Forecast, by Country 2020 & 2033
- Table 31: Germany eClinical Solutions Industry Revenue (Million) Forecast, by Application 2020 & 2033
- Table 32: Germany eClinical Solutions Industry Volume (K Unit) Forecast, by Application 2020 & 2033
- Table 33: United kingdom eClinical Solutions Industry Revenue (Million) Forecast, by Application 2020 & 2033
- Table 34: United kingdom eClinical Solutions Industry Volume (K Unit) Forecast, by Application 2020 & 2033
- Table 35: France eClinical Solutions Industry Revenue (Million) Forecast, by Application 2020 & 2033
- Table 36: France eClinical Solutions Industry Volume (K Unit) Forecast, by Application 2020 & 2033
- Table 37: Italy eClinical Solutions Industry Revenue (Million) Forecast, by Application 2020 & 2033
- Table 38: Italy eClinical Solutions Industry Volume (K Unit) Forecast, by Application 2020 & 2033
- Table 39: Spain eClinical Solutions Industry Revenue (Million) Forecast, by Application 2020 & 2033
- Table 40: Spain eClinical Solutions Industry Volume (K Unit) Forecast, by Application 2020 & 2033
- Table 41: Rest of Europe eClinical Solutions Industry Revenue (Million) Forecast, by Application 2020 & 2033
- Table 42: Rest of Europe eClinical Solutions Industry Volume (K Unit) Forecast, by Application 2020 & 2033
- Table 43: Global eClinical Solutions Industry Revenue Million Forecast, by Product Type 2020 & 2033
- Table 44: Global eClinical Solutions Industry Volume K Unit Forecast, by Product Type 2020 & 2033
- Table 45: Global eClinical Solutions Industry Revenue Million Forecast, by Deployment Mode 2020 & 2033
- Table 46: Global eClinical Solutions Industry Volume K Unit Forecast, by Deployment Mode 2020 & 2033
- Table 47: Global eClinical Solutions Industry Revenue Million Forecast, by End User 2020 & 2033
- Table 48: Global eClinical Solutions Industry Volume K Unit Forecast, by End User 2020 & 2033
- Table 49: Global eClinical Solutions Industry Revenue Million Forecast, by Country 2020 & 2033
- Table 50: Global eClinical Solutions Industry Volume K Unit Forecast, by Country 2020 & 2033
- Table 51: China eClinical Solutions Industry Revenue (Million) Forecast, by Application 2020 & 2033
- Table 52: China eClinical Solutions Industry Volume (K Unit) Forecast, by Application 2020 & 2033
- Table 53: Japan eClinical Solutions Industry Revenue (Million) Forecast, by Application 2020 & 2033
- Table 54: Japan eClinical Solutions Industry Volume (K Unit) Forecast, by Application 2020 & 2033
- Table 55: India eClinical Solutions Industry Revenue (Million) Forecast, by Application 2020 & 2033
- Table 56: India eClinical Solutions Industry Volume (K Unit) Forecast, by Application 2020 & 2033
- Table 57: Australia eClinical Solutions Industry Revenue (Million) Forecast, by Application 2020 & 2033
- Table 58: Australia eClinical Solutions Industry Volume (K Unit) Forecast, by Application 2020 & 2033
- Table 59: South Korea eClinical Solutions Industry Revenue (Million) Forecast, by Application 2020 & 2033
- Table 60: South Korea eClinical Solutions Industry Volume (K Unit) Forecast, by Application 2020 & 2033
- Table 61: Rest of Asia Pacific eClinical Solutions Industry Revenue (Million) Forecast, by Application 2020 & 2033
- Table 62: Rest of Asia Pacific eClinical Solutions Industry Volume (K Unit) Forecast, by Application 2020 & 2033
- Table 63: Global eClinical Solutions Industry Revenue Million Forecast, by Product Type 2020 & 2033
- Table 64: Global eClinical Solutions Industry Volume K Unit Forecast, by Product Type 2020 & 2033
- Table 65: Global eClinical Solutions Industry Revenue Million Forecast, by Deployment Mode 2020 & 2033
- Table 66: Global eClinical Solutions Industry Volume K Unit Forecast, by Deployment Mode 2020 & 2033
- Table 67: Global eClinical Solutions Industry Revenue Million Forecast, by End User 2020 & 2033
- Table 68: Global eClinical Solutions Industry Volume K Unit Forecast, by End User 2020 & 2033
- Table 69: Global eClinical Solutions Industry Revenue Million Forecast, by Country 2020 & 2033
- Table 70: Global eClinical Solutions Industry Volume K Unit Forecast, by Country 2020 & 2033
- Table 71: GCC eClinical Solutions Industry Revenue (Million) Forecast, by Application 2020 & 2033
- Table 72: GCC eClinical Solutions Industry Volume (K Unit) Forecast, by Application 2020 & 2033
- Table 73: South Africa eClinical Solutions Industry Revenue (Million) Forecast, by Application 2020 & 2033
- Table 74: South Africa eClinical Solutions Industry Volume (K Unit) Forecast, by Application 2020 & 2033
- Table 75: Rest of Middle East and Africa eClinical Solutions Industry Revenue (Million) Forecast, by Application 2020 & 2033
- Table 76: Rest of Middle East and Africa eClinical Solutions Industry Volume (K Unit) Forecast, by Application 2020 & 2033
- Table 77: Global eClinical Solutions Industry Revenue Million Forecast, by Product Type 2020 & 2033
- Table 78: Global eClinical Solutions Industry Volume K Unit Forecast, by Product Type 2020 & 2033
- Table 79: Global eClinical Solutions Industry Revenue Million Forecast, by Deployment Mode 2020 & 2033
- Table 80: Global eClinical Solutions Industry Volume K Unit Forecast, by Deployment Mode 2020 & 2033
- Table 81: Global eClinical Solutions Industry Revenue Million Forecast, by End User 2020 & 2033
- Table 82: Global eClinical Solutions Industry Volume K Unit Forecast, by End User 2020 & 2033
- Table 83: Global eClinical Solutions Industry Revenue Million Forecast, by Country 2020 & 2033
- Table 84: Global eClinical Solutions Industry Volume K Unit Forecast, by Country 2020 & 2033
- Table 85: Brazil eClinical Solutions Industry Revenue (Million) Forecast, by Application 2020 & 2033
- Table 86: Brazil eClinical Solutions Industry Volume (K Unit) Forecast, by Application 2020 & 2033
- Table 87: Argentina eClinical Solutions Industry Revenue (Million) Forecast, by Application 2020 & 2033
- Table 88: Argentina eClinical Solutions Industry Volume (K Unit) Forecast, by Application 2020 & 2033
- Table 89: Rest of South America eClinical Solutions Industry Revenue (Million) Forecast, by Application 2020 & 2033
- Table 90: Rest of South America eClinical Solutions Industry Volume (K Unit) Forecast, by Application 2020 & 2033
Frequently Asked Questions
1. What is the projected Compound Annual Growth Rate (CAGR) of the eClinical Solutions Industry?
The projected CAGR is approximately 12.42%.
2. Which companies are prominent players in the eClinical Solutions Industry?
Key companies in the market include Merative, Datatrak International Inc, Castor EDC, Covance (LabCorp), eClinical Solutions LLC, Saama Technologies Inc, Dassault Systemes (Medidata Solutions Inc ), Mednet Solutions, Clario (BioClinicia Inc ), Signant Health, IQVIA Holdings Inc, PAREXEL International Corporation (Calyx), Oracle Corporation, Medrio Inc, Veeva Systems.
3. What are the main segments of the eClinical Solutions Industry?
The market segments include Product Type, Deployment Mode, End User.
4. Can you provide details about the market size?
The market size is estimated to be USD 11.02 Million as of 2022.
5. What are some drivers contributing to market growth?
Enormous Data Mounting from the Healthcare Industry; Rising Number of Clinical Trials; Government Emphasis on Clinical Research.
6. What are the notable trends driving market growth?
Clinical Data Management Systems Segment is Expected to Hold a Significant Market Share Over the Forecast Period.
7. Are there any restraints impacting market growth?
Lack of Awareness and Infrastructure in Developing Countries; High Implementation Costs.
8. Can you provide examples of recent developments in the market?
January 2023: Veeva Systems was selected by Adare Pharma Solutions, a contract development and manufacturing organization (CDMO) with expertise in oral dosage forms. The company selected Veeva Vault Quality Suite to harmonize quality systems across the organization.
9. What pricing options are available for accessing the report?
Pricing options include single-user, multi-user, and enterprise licenses priced at USD 4750, USD 5250, and USD 8750 respectively.
10. Is the market size provided in terms of value or volume?
The market size is provided in terms of value, measured in Million and volume, measured in K Unit.
11. Are there any specific market keywords associated with the report?
Yes, the market keyword associated with the report is "eClinical Solutions Industry," which aids in identifying and referencing the specific market segment covered.
12. How do I determine which pricing option suits my needs best?
The pricing options vary based on user requirements and access needs. Individual users may opt for single-user licenses, while businesses requiring broader access may choose multi-user or enterprise licenses for cost-effective access to the report.
13. Are there any additional resources or data provided in the eClinical Solutions Industry report?
While the report offers comprehensive insights, it's advisable to review the specific contents or supplementary materials provided to ascertain if additional resources or data are available.
14. How can I stay updated on further developments or reports in the eClinical Solutions Industry?
To stay informed about further developments, trends, and reports in the eClinical Solutions Industry, consider subscribing to industry newsletters, following relevant companies and organizations, or regularly checking reputable industry news sources and publications.
Methodology
Step 1 - Identification of Relevant Samples Size from Population Database


Step 2 - Approaches for Defining Global Market Size (Value, Volume* & Price*)

Note*: In applicable scenarios
Step 3 - Data Sources
Primary Research
- Web Analytics
- Survey Reports
- Research Institute
- Latest Research Reports
- Opinion Leaders
Secondary Research
- Annual Reports
- White Paper
- Latest Press Release
- Industry Association
- Paid Database
- Investor Presentations

Step 4 - Data Triangulation
Involves using different sources of information in order to increase the validity of a study
These sources are likely to be stakeholders in a program - participants, other researchers, program staff, other community members, and so on.
Then we put all data in single framework & apply various statistical tools to find out the dynamic on the market.
During the analysis stage, feedback from the stakeholder groups would be compared to determine areas of agreement as well as areas of divergence