
Key Insights
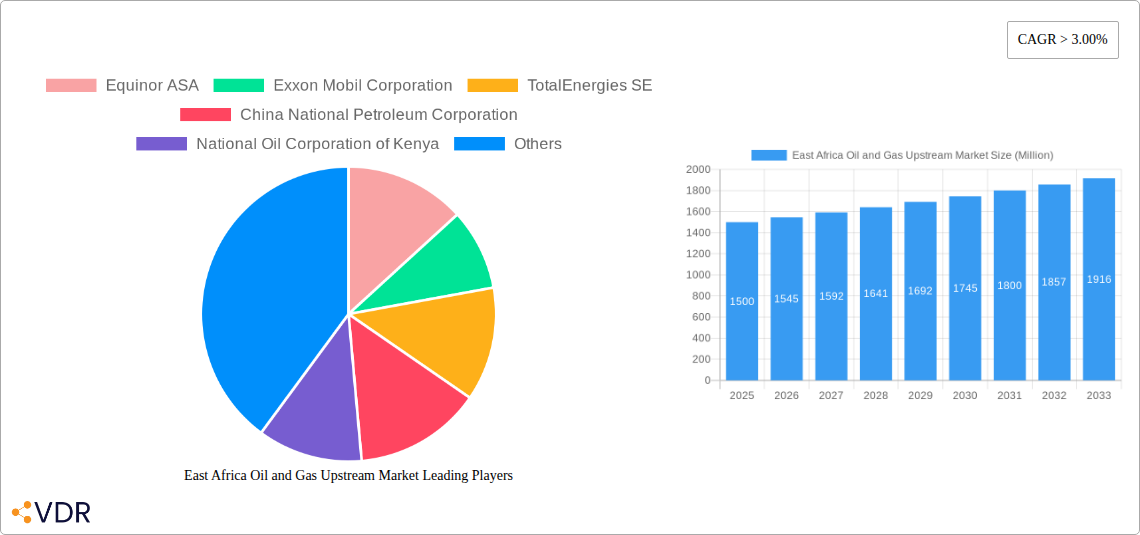
The East African oil and gas upstream market, encompassing exploration, development, and production activities, is projected to experience robust growth between 2025 and 2033. Driven by significant discoveries in countries like Kenya, Uganda, and Tanzania, and supported by increasing global energy demand, the market is poised for expansion. The onshore segment currently dominates, but offshore exploration is gaining traction, with potential for significant future contributions. Government initiatives to improve infrastructure and attract foreign investment are further fueling this growth. However, challenges remain, including geopolitical instability in some regions, the complex regulatory environment, and environmental concerns related to oil and gas extraction. The major players—Equinor ASA, ExxonMobil Corporation, TotalEnergies SE, China National Petroleum Corporation, National Oil Corporation of Kenya, and PanAfrican Energy Tanzania Ltd—are strategically positioning themselves to capitalize on the opportunities presented by this burgeoning market. The significant investment in exploration and development projects suggests a promising outlook for the sector's long-term growth.
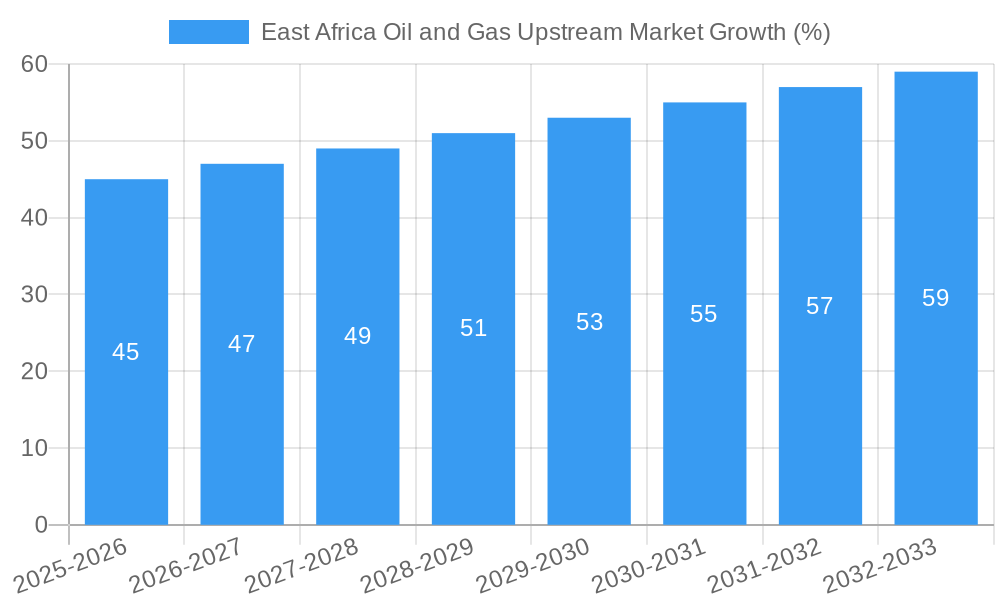
Despite challenges, ongoing exploration and the development of existing fields are expected to drive sustained growth. The market is likely to see increased activity in deepwater exploration and the application of advanced technologies to enhance efficiency and reduce environmental impact. Diversification into gas production is also anticipated, given the growing global demand for cleaner energy sources. While the historical period (2019-2024) might show lower growth due to factors like the COVID-19 pandemic, the forecast period (2025-2033) is predicted to see a higher CAGR exceeding 3.00%, primarily driven by new discoveries and investment in infrastructure. The market's future success hinges on sustainable practices, efficient resource management, and the continued cooperation between governments and industry players.
East Africa Oil & Gas Upstream Market Report: 2019-2033
This comprehensive report provides an in-depth analysis of the East Africa oil and gas upstream market, covering the historical period (2019-2024), base year (2025), and forecast period (2025-2033). It delves into market dynamics, growth trends, dominant segments (onshore and offshore), key players, and emerging opportunities, offering invaluable insights for industry professionals, investors, and strategic decision-makers. The report analyzes the parent market (East Africa Energy Market) and the child market (East Africa Oil and Gas Upstream Market) providing a holistic view of the sector.
The report quantifies the market in Million units, wherever possible, offering precise data and forecasts for informed decision-making. Key players like Equinor ASA, Exxon Mobil Corporation, TotalEnergies SE, China National Petroleum Corporation, National Oil Corporation of Kenya, and PanAfrican Energy Tanzania Ltd are profiled, showcasing their strategies and contributions to the market's evolution.
East Africa Oil and Gas Upstream Market Dynamics & Structure
This section analyzes the competitive landscape, technological advancements, regulatory influences, and market trends within the East African oil and gas upstream sector. We examine market concentration, identifying the dominant players and their market share percentages. The report explores the impact of technological innovations, including advancements in drilling techniques and exploration technologies, on market growth. Further, it assesses the role of regulatory frameworks and their influence on investment decisions and operational efficiency. The analysis also considers the presence of substitute products or alternative energy sources, and their influence on market demand. Finally, we investigate mergers and acquisitions (M&A) trends, quantifying the volume of deals and analyzing their impact on market consolidation.
- Market Concentration: xx% of the market is controlled by the top 5 players in 2025.
- Technological Innovation: Significant investments in seismic imaging and advanced drilling technologies are driving exploration efficiency.
- Regulatory Framework: Government policies related to licensing and environmental regulations significantly influence investment decisions. xx new regulations are expected by 2030.
- Competitive Substitutes: Renewables pose a growing threat, with an estimated xx% market share by 2033.
- M&A Activity: A total of xx M&A deals were recorded during 2019-2024, with an average deal value of xx Million.
East Africa Oil and Gas Upstream Market Growth Trends & Insights
This section presents a comprehensive analysis of the East Africa oil and gas upstream market's growth trajectory, employing proprietary data and forecasting methodologies. The report details market size evolution from 2019 to 2024, projecting future growth based on various factors including technological advancements, exploration success rates, and geopolitical dynamics. Key metrics such as Compound Annual Growth Rate (CAGR), market penetration rates, and adoption rates are provided to offer a detailed understanding of market expansion. We analyze shifting consumer behavior and its implications for future market demand alongside technological disruptions such as automation and digitalization of operations.
- Market Size: The market was valued at xx Million in 2024 and is projected to reach xx Million by 2033.
- CAGR: The projected CAGR for the forecast period (2025-2033) is xx%.
- Market Penetration: The market penetration rate is expected to increase from xx% in 2024 to xx% by 2033.
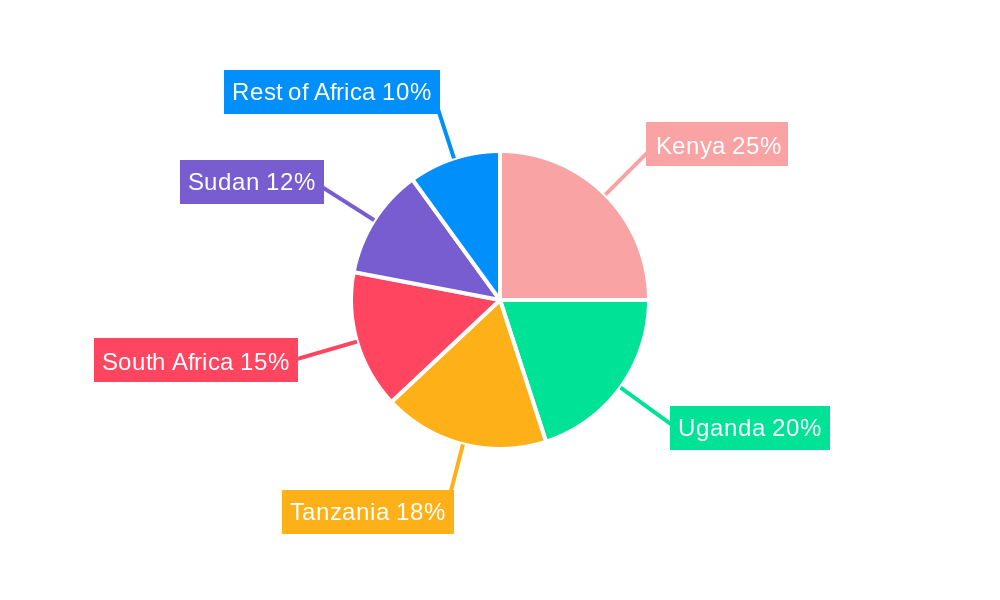
Dominant Regions, Countries, or Segments in East Africa Oil and Gas Upstream Market
This section identifies the leading regions, countries, and segments (onshore vs. offshore) within the East African oil and gas upstream market. It provides a detailed analysis of the factors driving growth in the dominant areas, including supportive economic policies, investment incentives, and robust infrastructure development. The analysis will include market share data and future growth potential for each identified region and segment.
- Onshore vs. Offshore: Offshore exploration is projected to dominate, accounting for xx% of the market by 2033 due to large discoveries.
- Key Countries: Tanzania and Mozambique are leading the market growth due to substantial gas reserves and supportive government policies.
- Growth Drivers:
- Favorable Government Policies: Tax incentives and streamlined licensing processes are attracting significant investments.
- Infrastructure Development: Improved port infrastructure and transportation networks are facilitating exploration and production activities.
East Africa Oil and Gas Upstream Market Product Landscape
This section provides a concise overview of the product landscape, highlighting key innovations, applications, and performance metrics. It will describe the unique selling propositions of different products and technologies. The analysis will cover the technological advancements that are driving efficiency and productivity in the upstream sector.
The market is characterized by continuous innovation in drilling technologies, resulting in improved efficiency and reduced environmental impact. New applications of data analytics and artificial intelligence are also transforming exploration and production activities.
Key Drivers, Barriers & Challenges in East Africa Oil and Gas Upstream Market
This section identifies the key drivers and challenges influencing the East African oil and gas upstream market. Drivers include technological advancements, supportive government policies, and rising energy demand. Challenges encompass issues like geopolitical instability, regulatory uncertainties, and infrastructure constraints. Quantifiable impacts of these factors will be provided where possible.
Key Drivers:
- Growing Energy Demand: Rapid economic growth is driving the need for increased energy production.
- Technological Advancements: Innovations in exploration and production techniques are improving efficiency.
Key Challenges:
- Geopolitical Risks: Political instability in some regions poses a significant risk to investment.
- Regulatory Uncertainty: Changes in government regulations can impact investment decisions. The average licensing delay is estimated at xx months.
Emerging Opportunities in East Africa Oil and Gas Upstream Market
This section outlines emerging trends and untapped market opportunities. It focuses on potential areas for growth, including new exploration areas, innovative technologies, and evolving consumer preferences.
- Deepwater Exploration: Significant potential exists in deepwater exploration.
- Gas Monetization: Development of gas infrastructure for domestic and export markets.
Growth Accelerators in the East Africa Oil and Gas Upstream Market Industry
This section highlights the factors that will accelerate market growth in the long term, including technological breakthroughs, strategic partnerships, and effective market expansion strategies.
Long-term growth will be fueled by continued technological advancements, strategic partnerships between international and local companies, and successful implementation of government initiatives promoting investment in the sector. The increasing adoption of sustainable practices will also play a significant role.
Key Players Shaping the East Africa Oil and Gas Upstream Market Market
- Equinor ASA
- Exxon Mobil Corporation
- TotalEnergies SE
- China National Petroleum Corporation
- National Oil Corporation of Kenya
- PanAfrican Energy Tanzania Ltd
Notable Milestones in East Africa Oil and Gas Upstream Market Sector
- January 2022: Commissioning of the Coral South FLNG facility in Mozambique (USD 2.5 billion investment).
- June 2022: Equinor and Shell sign a framework deal with Tanzania for a USD 30 billion LNG export project.
In-Depth East Africa Oil and Gas Upstream Market Market Outlook
The East Africa oil and gas upstream market presents significant opportunities for growth driven by substantial hydrocarbon reserves, supportive government policies, and increasing energy demand. Strategic investments in infrastructure development, technological innovation, and skilled workforce development are crucial for realizing the market's full potential. The continued exploration of offshore reserves and the development of gas infrastructure will be key drivers of long-term growth.
East Africa Oil and Gas Upstream Market Segmentation
-
1. Location
- 1.1. Onshore
- 1.2. Offshore
-
2. Geography
- 2.1. Tanzania
- 2.2. Mozambique
- 2.3. Kenya
- 2.4. Rest of East Africa
East Africa Oil and Gas Upstream Market Segmentation By Geography
- 1. Tanzania
- 2. Mozambique
- 3. Kenya
- 4. Rest of East Africa
East Africa Oil and Gas Upstream Market REPORT HIGHLIGHTS
| Aspects | Details |
|---|---|
| Study Period | 2019-2033 |
| Base Year | 2024 |
| Estimated Year | 2025 |
| Forecast Period | 2025-2033 |
| Historical Period | 2019-2024 |
| Growth Rate | CAGR of > 3.00% from 2019-2033 |
| Segmentation |
|
Table of Contents
- 1. Introduction
- 1.1. Research Scope
- 1.2. Market Segmentation
- 1.3. Research Methodology
- 1.4. Definitions and Assumptions
- 2. Executive Summary
- 2.1. Introduction
- 3. Market Dynamics
- 3.1. Introduction
- 3.2. Market Drivers
- 3.2.1. 4.; Abundant Oil and Gas Reserves4.; Favorable Investment in Upstream Sector
- 3.3. Market Restrains
- 3.3.1. 4.; Volatility of Crude Oil Prices
- 3.4. Market Trends
- 3.4.1. Onshore Sector to Dominate the Market
- 4. Market Factor Analysis
- 4.1. Porters Five Forces
- 4.2. Supply/Value Chain
- 4.3. PESTEL analysis
- 4.4. Market Entropy
- 4.5. Patent/Trademark Analysis
- 5. East Africa Oil and Gas Upstream Market Analysis, Insights and Forecast, 2019-2031
- 5.1. Market Analysis, Insights and Forecast - by Location
- 5.1.1. Onshore
- 5.1.2. Offshore
- 5.2. Market Analysis, Insights and Forecast - by Geography
- 5.2.1. Tanzania
- 5.2.2. Mozambique
- 5.2.3. Kenya
- 5.2.4. Rest of East Africa
- 5.3. Market Analysis, Insights and Forecast - by Region
- 5.3.1. Tanzania
- 5.3.2. Mozambique
- 5.3.3. Kenya
- 5.3.4. Rest of East Africa
- 5.1. Market Analysis, Insights and Forecast - by Location
- 6. Tanzania East Africa Oil and Gas Upstream Market Analysis, Insights and Forecast, 2019-2031
- 6.1. Market Analysis, Insights and Forecast - by Location
- 6.1.1. Onshore
- 6.1.2. Offshore
- 6.2. Market Analysis, Insights and Forecast - by Geography
- 6.2.1. Tanzania
- 6.2.2. Mozambique
- 6.2.3. Kenya
- 6.2.4. Rest of East Africa
- 6.1. Market Analysis, Insights and Forecast - by Location
- 7. Mozambique East Africa Oil and Gas Upstream Market Analysis, Insights and Forecast, 2019-2031
- 7.1. Market Analysis, Insights and Forecast - by Location
- 7.1.1. Onshore
- 7.1.2. Offshore
- 7.2. Market Analysis, Insights and Forecast - by Geography
- 7.2.1. Tanzania
- 7.2.2. Mozambique
- 7.2.3. Kenya
- 7.2.4. Rest of East Africa
- 7.1. Market Analysis, Insights and Forecast - by Location
- 8. Kenya East Africa Oil and Gas Upstream Market Analysis, Insights and Forecast, 2019-2031
- 8.1. Market Analysis, Insights and Forecast - by Location
- 8.1.1. Onshore
- 8.1.2. Offshore
- 8.2. Market Analysis, Insights and Forecast - by Geography
- 8.2.1. Tanzania
- 8.2.2. Mozambique
- 8.2.3. Kenya
- 8.2.4. Rest of East Africa
- 8.1. Market Analysis, Insights and Forecast - by Location
- 9. Rest of East Africa East Africa Oil and Gas Upstream Market Analysis, Insights and Forecast, 2019-2031
- 9.1. Market Analysis, Insights and Forecast - by Location
- 9.1.1. Onshore
- 9.1.2. Offshore
- 9.2. Market Analysis, Insights and Forecast - by Geography
- 9.2.1. Tanzania
- 9.2.2. Mozambique
- 9.2.3. Kenya
- 9.2.4. Rest of East Africa
- 9.1. Market Analysis, Insights and Forecast - by Location
- 10. South Africa East Africa Oil and Gas Upstream Market Analysis, Insights and Forecast, 2019-2031
- 11. Sudan East Africa Oil and Gas Upstream Market Analysis, Insights and Forecast, 2019-2031
- 12. Uganda East Africa Oil and Gas Upstream Market Analysis, Insights and Forecast, 2019-2031
- 13. Tanzania East Africa Oil and Gas Upstream Market Analysis, Insights and Forecast, 2019-2031
- 14. Kenya East Africa Oil and Gas Upstream Market Analysis, Insights and Forecast, 2019-2031
- 15. Rest of Africa East Africa Oil and Gas Upstream Market Analysis, Insights and Forecast, 2019-2031
- 16. Competitive Analysis
- 16.1. Market Share Analysis 2024
- 16.2. Company Profiles
- 16.2.1 Equinor ASA
- 16.2.1.1. Overview
- 16.2.1.2. Products
- 16.2.1.3. SWOT Analysis
- 16.2.1.4. Recent Developments
- 16.2.1.5. Financials (Based on Availability)
- 16.2.2 Exxon Mobil Corporation
- 16.2.2.1. Overview
- 16.2.2.2. Products
- 16.2.2.3. SWOT Analysis
- 16.2.2.4. Recent Developments
- 16.2.2.5. Financials (Based on Availability)
- 16.2.3 TotalEnergies SE
- 16.2.3.1. Overview
- 16.2.3.2. Products
- 16.2.3.3. SWOT Analysis
- 16.2.3.4. Recent Developments
- 16.2.3.5. Financials (Based on Availability)
- 16.2.4 China National Petroleum Corporation
- 16.2.4.1. Overview
- 16.2.4.2. Products
- 16.2.4.3. SWOT Analysis
- 16.2.4.4. Recent Developments
- 16.2.4.5. Financials (Based on Availability)
- 16.2.5 National Oil Corporation of Kenya
- 16.2.5.1. Overview
- 16.2.5.2. Products
- 16.2.5.3. SWOT Analysis
- 16.2.5.4. Recent Developments
- 16.2.5.5. Financials (Based on Availability)
- 16.2.6 PanAfrican Energy Tanzania Ltd
- 16.2.6.1. Overview
- 16.2.6.2. Products
- 16.2.6.3. SWOT Analysis
- 16.2.6.4. Recent Developments
- 16.2.6.5. Financials (Based on Availability)
- 16.2.1 Equinor ASA
List of Figures
- Figure 1: East Africa Oil and Gas Upstream Market Revenue Breakdown (Million, %) by Product 2024 & 2032
- Figure 2: East Africa Oil and Gas Upstream Market Share (%) by Company 2024
List of Tables
- Table 1: East Africa Oil and Gas Upstream Market Revenue Million Forecast, by Region 2019 & 2032
- Table 2: East Africa Oil and Gas Upstream Market Volume K Tons Forecast, by Region 2019 & 2032
- Table 3: East Africa Oil and Gas Upstream Market Revenue Million Forecast, by Location 2019 & 2032
- Table 4: East Africa Oil and Gas Upstream Market Volume K Tons Forecast, by Location 2019 & 2032
- Table 5: East Africa Oil and Gas Upstream Market Revenue Million Forecast, by Geography 2019 & 2032
- Table 6: East Africa Oil and Gas Upstream Market Volume K Tons Forecast, by Geography 2019 & 2032
- Table 7: East Africa Oil and Gas Upstream Market Revenue Million Forecast, by Region 2019 & 2032
- Table 8: East Africa Oil and Gas Upstream Market Volume K Tons Forecast, by Region 2019 & 2032
- Table 9: East Africa Oil and Gas Upstream Market Revenue Million Forecast, by Country 2019 & 2032
- Table 10: East Africa Oil and Gas Upstream Market Volume K Tons Forecast, by Country 2019 & 2032
- Table 11: South Africa East Africa Oil and Gas Upstream Market Revenue (Million) Forecast, by Application 2019 & 2032
- Table 12: South Africa East Africa Oil and Gas Upstream Market Volume (K Tons) Forecast, by Application 2019 & 2032
- Table 13: Sudan East Africa Oil and Gas Upstream Market Revenue (Million) Forecast, by Application 2019 & 2032
- Table 14: Sudan East Africa Oil and Gas Upstream Market Volume (K Tons) Forecast, by Application 2019 & 2032
- Table 15: Uganda East Africa Oil and Gas Upstream Market Revenue (Million) Forecast, by Application 2019 & 2032
- Table 16: Uganda East Africa Oil and Gas Upstream Market Volume (K Tons) Forecast, by Application 2019 & 2032
- Table 17: Tanzania East Africa Oil and Gas Upstream Market Revenue (Million) Forecast, by Application 2019 & 2032
- Table 18: Tanzania East Africa Oil and Gas Upstream Market Volume (K Tons) Forecast, by Application 2019 & 2032
- Table 19: Kenya East Africa Oil and Gas Upstream Market Revenue (Million) Forecast, by Application 2019 & 2032
- Table 20: Kenya East Africa Oil and Gas Upstream Market Volume (K Tons) Forecast, by Application 2019 & 2032
- Table 21: Rest of Africa East Africa Oil and Gas Upstream Market Revenue (Million) Forecast, by Application 2019 & 2032
- Table 22: Rest of Africa East Africa Oil and Gas Upstream Market Volume (K Tons) Forecast, by Application 2019 & 2032
- Table 23: East Africa Oil and Gas Upstream Market Revenue Million Forecast, by Location 2019 & 2032
- Table 24: East Africa Oil and Gas Upstream Market Volume K Tons Forecast, by Location 2019 & 2032
- Table 25: East Africa Oil and Gas Upstream Market Revenue Million Forecast, by Geography 2019 & 2032
- Table 26: East Africa Oil and Gas Upstream Market Volume K Tons Forecast, by Geography 2019 & 2032
- Table 27: East Africa Oil and Gas Upstream Market Revenue Million Forecast, by Country 2019 & 2032
- Table 28: East Africa Oil and Gas Upstream Market Volume K Tons Forecast, by Country 2019 & 2032
- Table 29: East Africa Oil and Gas Upstream Market Revenue Million Forecast, by Location 2019 & 2032
- Table 30: East Africa Oil and Gas Upstream Market Volume K Tons Forecast, by Location 2019 & 2032
- Table 31: East Africa Oil and Gas Upstream Market Revenue Million Forecast, by Geography 2019 & 2032
- Table 32: East Africa Oil and Gas Upstream Market Volume K Tons Forecast, by Geography 2019 & 2032
- Table 33: East Africa Oil and Gas Upstream Market Revenue Million Forecast, by Country 2019 & 2032
- Table 34: East Africa Oil and Gas Upstream Market Volume K Tons Forecast, by Country 2019 & 2032
- Table 35: East Africa Oil and Gas Upstream Market Revenue Million Forecast, by Location 2019 & 2032
- Table 36: East Africa Oil and Gas Upstream Market Volume K Tons Forecast, by Location 2019 & 2032
- Table 37: East Africa Oil and Gas Upstream Market Revenue Million Forecast, by Geography 2019 & 2032
- Table 38: East Africa Oil and Gas Upstream Market Volume K Tons Forecast, by Geography 2019 & 2032
- Table 39: East Africa Oil and Gas Upstream Market Revenue Million Forecast, by Country 2019 & 2032
- Table 40: East Africa Oil and Gas Upstream Market Volume K Tons Forecast, by Country 2019 & 2032
- Table 41: East Africa Oil and Gas Upstream Market Revenue Million Forecast, by Location 2019 & 2032
- Table 42: East Africa Oil and Gas Upstream Market Volume K Tons Forecast, by Location 2019 & 2032
- Table 43: East Africa Oil and Gas Upstream Market Revenue Million Forecast, by Geography 2019 & 2032
- Table 44: East Africa Oil and Gas Upstream Market Volume K Tons Forecast, by Geography 2019 & 2032
- Table 45: East Africa Oil and Gas Upstream Market Revenue Million Forecast, by Country 2019 & 2032
- Table 46: East Africa Oil and Gas Upstream Market Volume K Tons Forecast, by Country 2019 & 2032
Frequently Asked Questions
1. What is the projected Compound Annual Growth Rate (CAGR) of the East Africa Oil and Gas Upstream Market?
The projected CAGR is approximately > 3.00%.
2. Which companies are prominent players in the East Africa Oil and Gas Upstream Market?
Key companies in the market include Equinor ASA, Exxon Mobil Corporation, TotalEnergies SE, China National Petroleum Corporation, National Oil Corporation of Kenya, PanAfrican Energy Tanzania Ltd.
3. What are the main segments of the East Africa Oil and Gas Upstream Market?
The market segments include Location, Geography.
4. Can you provide details about the market size?
The market size is estimated to be USD XX Million as of 2022.
5. What are some drivers contributing to market growth?
4.; Abundant Oil and Gas Reserves4.; Favorable Investment in Upstream Sector.
6. What are the notable trends driving market growth?
Onshore Sector to Dominate the Market.
7. Are there any restraints impacting market growth?
4.; Volatility of Crude Oil Prices.
8. Can you provide examples of recent developments in the market?
In January 2022, Mozambique witnessed the commissioning of its first offshore project. It is a USD 2.5-billion floating Coral South facility above the 450 billion cubic meters (Bcm) of resources in the Coral field in Area 4 of the Rovuma Basin plant. It has the capacity to liquefy 3.4 million ton of natural gas per year from subsea gas-producing wells.
9. What pricing options are available for accessing the report?
Pricing options include single-user, multi-user, and enterprise licenses priced at USD 4750, USD 5250, and USD 8750 respectively.
10. Is the market size provided in terms of value or volume?
The market size is provided in terms of value, measured in Million and volume, measured in K Tons.
11. Are there any specific market keywords associated with the report?
Yes, the market keyword associated with the report is "East Africa Oil and Gas Upstream Market," which aids in identifying and referencing the specific market segment covered.
12. How do I determine which pricing option suits my needs best?
The pricing options vary based on user requirements and access needs. Individual users may opt for single-user licenses, while businesses requiring broader access may choose multi-user or enterprise licenses for cost-effective access to the report.
13. Are there any additional resources or data provided in the East Africa Oil and Gas Upstream Market report?
While the report offers comprehensive insights, it's advisable to review the specific contents or supplementary materials provided to ascertain if additional resources or data are available.
14. How can I stay updated on further developments or reports in the East Africa Oil and Gas Upstream Market?
To stay informed about further developments, trends, and reports in the East Africa Oil and Gas Upstream Market, consider subscribing to industry newsletters, following relevant companies and organizations, or regularly checking reputable industry news sources and publications.
Methodology
Step 1 - Identification of Relevant Samples Size from Population Database


Step 2 - Approaches for Defining Global Market Size (Value, Volume* & Price*)

Note*: In applicable scenarios
Step 3 - Data Sources
Primary Research
- Web Analytics
- Survey Reports
- Research Institute
- Latest Research Reports
- Opinion Leaders
Secondary Research
- Annual Reports
- White Paper
- Latest Press Release
- Industry Association
- Paid Database
- Investor Presentations

Step 4 - Data Triangulation
Involves using different sources of information in order to increase the validity of a study
These sources are likely to be stakeholders in a program - participants, other researchers, program staff, other community members, and so on.
Then we put all data in single framework & apply various statistical tools to find out the dynamic on the market.
During the analysis stage, feedback from the stakeholder groups would be compared to determine areas of agreement as well as areas of divergence


