
Key Insights
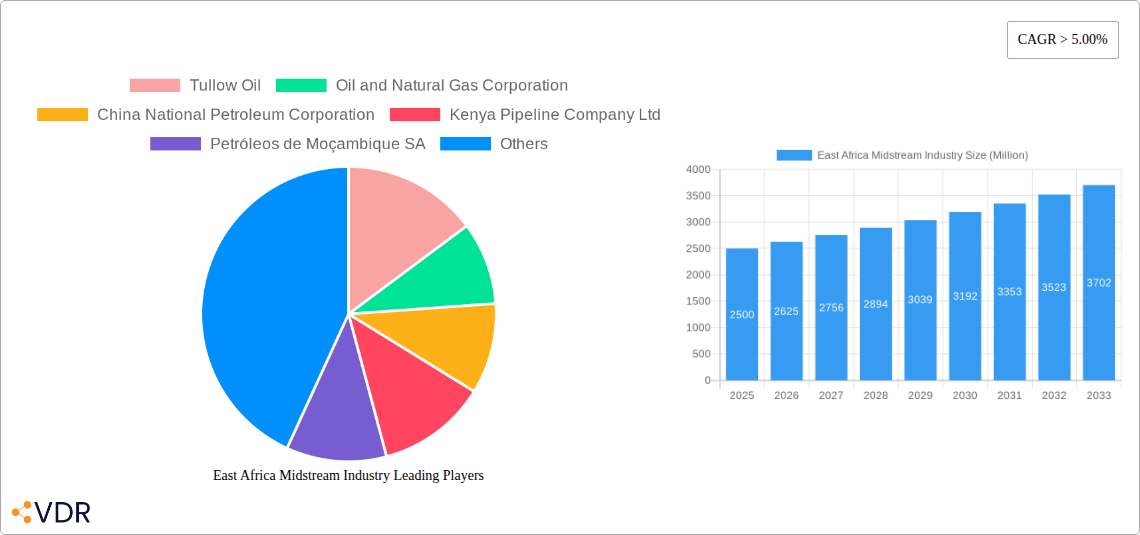
The East African midstream oil and gas industry is experiencing robust growth, driven by increasing energy demand fueled by industrialization and population growth across the region. A Compound Annual Growth Rate (CAGR) exceeding 5% from 2025 to 2033 suggests a significant expansion in market size. Key drivers include substantial investments in infrastructure development, particularly pipelines and storage facilities, to support the burgeoning upstream sector. The rising adoption of refined products in transportation and power generation sectors further fuels this expansion. While the industry faces challenges such as geopolitical instability and regulatory complexities in some regions, the overall outlook remains positive. Segments like oil and natural gas transportation, crucial for exporting these resources, are expected to show substantial growth. The refined products segment, vital for domestic consumption, will also contribute significantly. Major players, including international energy giants and national oil companies like Tullow Oil, Oil and Natural Gas Corporation, and TotalEnergies, are actively involved, shaping the market landscape through strategic partnerships and investments. The development of new oil and gas fields in countries like Uganda and Tanzania is further accelerating the demand for midstream services.
Growth projections for the East African midstream market are based on the anticipated increase in oil and gas production, coupled with ongoing infrastructure projects. The significant investments being made in pipeline networks, storage terminals, and refinery capacity are driving the expansion. While specific country-level breakdowns of the market size are not provided, a reasonable estimation based on available data and regional development suggests a steady and substantial upward trajectory. The focus on regional integration through cross-border pipeline projects is expected to facilitate trade and contribute to market growth. However, potential risks include fluctuating global oil prices, environmental concerns, and the need for robust regulatory frameworks to ensure sustainable and responsible development. Continued expansion depends on consistent investment, political stability, and effective management of environmental and social risks.
East Africa Midstream Industry Report: 2019-2033
This comprehensive report provides an in-depth analysis of the East Africa midstream industry, covering the period from 2019 to 2033. With a base year of 2025 and a forecast period spanning 2025-2033, this study offers invaluable insights for industry professionals, investors, and policymakers. The report leverages extensive primary and secondary research to deliver a detailed overview of market dynamics, growth trends, key players, and future opportunities within the oil, natural gas, and refined products segments. Key markets include Kenya, Tanzania, Uganda, and Mozambique.
East Africa Midstream Industry Market Dynamics & Structure
This section analyzes the competitive landscape, technological advancements, regulatory environment, and market trends within the East African midstream sector. The market exhibits moderate concentration, with a few large players like Tullow Oil, Oil and Natural Gas Corporation, and China National Petroleum Corporation alongside several national oil companies. The sector is witnessing significant technological innovation, particularly in pipeline technology and efficiency optimization. However, regulatory inconsistencies across different countries pose challenges. The market's growth is also influenced by the availability of substitute energy sources and evolving end-user demographics. M&A activity is expected to remain robust, with estimated deal volume reaching xx Million in 2025, driven by the need for expansion and resource consolidation.
- Market Concentration: Moderately concentrated, with a few dominant players and several smaller regional operators.
- Technological Innovation: Focus on pipeline optimization, automation, and improved efficiency; challenges remain in adopting cutting-edge technologies.
- Regulatory Framework: Inconsistent across East African nations, creating complexities for investors and operators; regulatory changes are anticipated to affect investment decisions.
- Competitive Product Substitutes: Increasing competition from renewable energy sources, though the short-term outlook for fossil fuels remains positive.
- End-User Demographics: Driven by growing industrialization and rising energy demand in the region.
- M&A Trends: Consolidation expected, particularly among smaller players, driven by economies of scale and access to infrastructure.
East Africa Midstream Industry Growth Trends & Insights
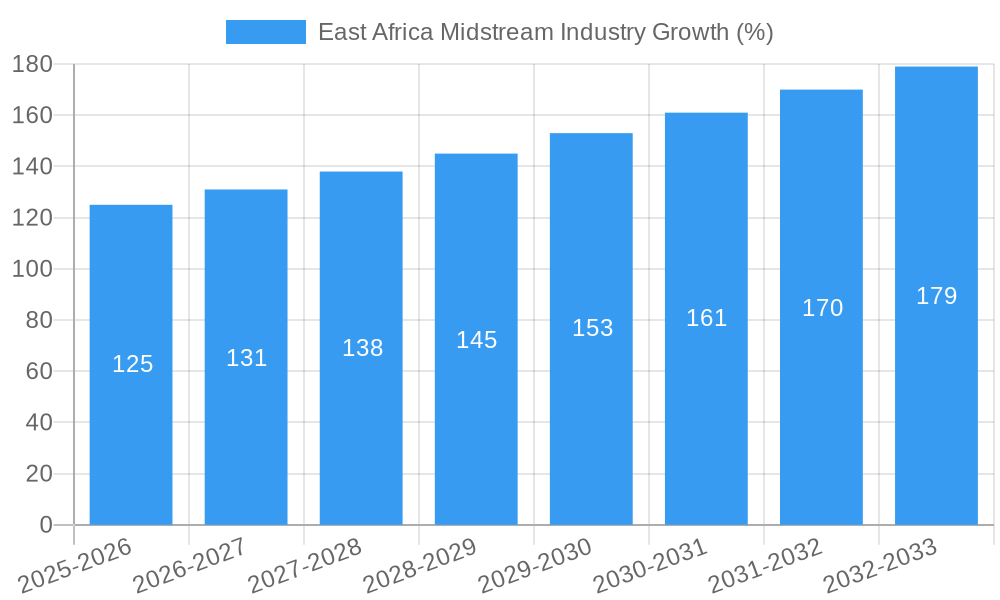
The East Africa midstream industry experienced significant growth during the historical period (2019-2024). Driven by increasing energy demand, infrastructure development, and burgeoning industrialization, the market size expanded from xx Million in 2019 to xx Million in 2024, recording a CAGR of xx%. The adoption of advanced technologies, particularly in pipeline management and optimization, further boosted market expansion. However, fluctuating global oil prices and occasional supply chain disruptions presented challenges. Looking ahead, the market is anticipated to witness robust growth, projected to reach xx Million by 2033, with a CAGR of xx% during the forecast period (2025-2033). This growth will be fueled by ongoing infrastructure investments, government support for energy sector development, and increased downstream activity. The market penetration rate for pipelines is projected to increase from xx% in 2025 to xx% by 2033.
Dominant Regions, Countries, or Segments in East Africa Midstream Industry
Kenya, Tanzania, and Uganda are currently the dominant countries, with Kenya holding the largest market share driven by its relatively developed infrastructure and established energy sector. The oil segment dominates overall market value, followed by refined products and then natural gas. The power generation sector is the largest end-user segment, followed by industrial and transportation applications. Key drivers include the favorable government policies, growing industrialization, and ongoing investment in infrastructure projects. Strong economic growth in these countries, coupled with ongoing infrastructure development projects and government initiatives promoting energy sector growth, continue to drive market expansion.
- Kenya: Largest market share due to advanced infrastructure and established energy sector.
- Tanzania: Significant growth potential driven by substantial natural gas reserves and ongoing pipeline projects.
- Uganda: Rapid growth expected due to increasing oil production and pipeline development.
- Oil Segment: Holds the largest market share due to high demand and established infrastructure.
- Power Generation: Largest end-user segment driven by increasing electricity demand.
East Africa Midstream Industry Product Landscape
The East African midstream industry primarily involves the transportation and storage of oil, natural gas, and refined products via pipelines and storage facilities. Significant technological advancements are focused on improving pipeline efficiency, safety, and environmental sustainability. Recent innovations include the implementation of advanced monitoring systems, pipeline integrity management programs, and the adoption of smart technologies for leak detection and prevention. These improvements aim to minimize environmental impact and reduce operational costs.
Key Drivers, Barriers & Challenges in East Africa Midstream Industry
Key Drivers: Increased energy demand driven by industrialization and population growth; significant government investments in infrastructure projects; exploration and production of new oil and gas reserves; favorable government policies promoting energy sector development.
Challenges: High initial investment costs for infrastructure projects; regulatory complexities and inconsistencies across different countries; potential environmental concerns regarding pipeline construction and operation; geopolitical risks and security concerns; supply chain disruptions and fluctuating commodity prices. The impact of these challenges is estimated to reduce the market growth rate by approximately xx% during the forecast period.
Emerging Opportunities in East Africa Midstream Industry
The East African midstream industry presents significant opportunities for growth, particularly in the development of new pipelines and storage facilities to support expanding oil and gas production. There's also potential in the exploration of new renewable energy sources to diversify the energy mix and support sustainable development. Strategic partnerships between international companies and local operators can facilitate knowledge transfer, investment, and technological advancement. Finally, focusing on improving energy efficiency and reducing environmental impact can create new opportunities for specialized services and technologies.
Growth Accelerators in the East Africa Midstream Industry
The continued development of major pipeline projects such as the East Africa Crude Oil Pipeline, alongside government initiatives promoting energy sector development and investments in infrastructure, are expected to drive significant growth. Furthermore, technological advancements in pipeline management and efficiency optimization, coupled with the strategic partnerships between international and local players, will significantly accelerate market expansion throughout the forecast period.
Key Players Shaping the East Africa Midstream Industry Market
- Tullow Oil
- Oil and Natural Gas Corporation
- China National Petroleum Corporation
- Kenya Pipeline Company Ltd
- Petróleos de Moçambique SA
- TotalEnergies
- Eni S p A
- Tanzania Petroleum Development Corporation (TPDC)
- Uganda National Oil Company (UNOC)
Notable Milestones in East Africa Midstream Industry Sector
- 2022: Commencement of the East Africa Crude Oil Pipeline construction.
- 2023: Significant progress on the Tanzania-Zambia Natural Gas Pipeline.
- 2024: Launch of the Uganda-Kenya Oil Pipeline.
In-Depth East Africa Midstream Industry Market Outlook
The East Africa midstream industry is poised for sustained growth, driven by significant infrastructure investments, rising energy demand, and government support. The successful completion of major pipeline projects and the increasing adoption of advanced technologies will significantly enhance operational efficiency and capacity. Strategic partnerships and collaborations among international and local players will continue to play a crucial role in fostering market expansion and unlocking the region's substantial energy potential, leading to a thriving midstream industry within the next decade.
East Africa Midstream Industry Segmentation
- 1. Transportation
- 2. Storage
- 3. LNG Terminals
-
4. Geography
- 4.1. Kenya
- 4.2. Mozambique
- 4.3. Tanzania
- 4.4. Rest of East Africa
East Africa Midstream Industry Segmentation By Geography
- 1. Kenya
- 2. Mozambique
- 3. Tanzania
- 4. Rest of East Africa

East Africa Midstream Industry REPORT HIGHLIGHTS
| Aspects | Details |
|---|---|
| Study Period | 2019-2033 |
| Base Year | 2024 |
| Estimated Year | 2025 |
| Forecast Period | 2025-2033 |
| Historical Period | 2019-2024 |
| Growth Rate | CAGR of > 5.00% from 2019-2033 |
| Segmentation |
|
Table of Contents
- 1. Introduction
- 1.1. Research Scope
- 1.2. Market Segmentation
- 1.3. Research Methodology
- 1.4. Definitions and Assumptions
- 2. Executive Summary
- 2.1. Introduction
- 3. Market Dynamics
- 3.1. Introduction
- 3.2. Market Drivers
- 3.2.1. 4.; Increasing Electricity Demand4.; Rsing Investments in the Coal Industry
- 3.3. Market Restrains
- 3.3.1. 4.; Increasing Installation of Renewable Energy Sources
- 3.4. Market Trends
- 3.4.1. Transportation Sector to Witness Growth
- 4. Market Factor Analysis
- 4.1. Porters Five Forces
- 4.2. Supply/Value Chain
- 4.3. PESTEL analysis
- 4.4. Market Entropy
- 4.5. Patent/Trademark Analysis
- 5. East Africa Midstream Industry Analysis, Insights and Forecast, 2019-2031
- 5.1. Market Analysis, Insights and Forecast - by Transportation
- 5.2. Market Analysis, Insights and Forecast - by Storage
- 5.3. Market Analysis, Insights and Forecast - by LNG Terminals
- 5.4. Market Analysis, Insights and Forecast - by Geography
- 5.4.1. Kenya
- 5.4.2. Mozambique
- 5.4.3. Tanzania
- 5.4.4. Rest of East Africa
- 5.5. Market Analysis, Insights and Forecast - by Region
- 5.5.1. Kenya
- 5.5.2. Mozambique
- 5.5.3. Tanzania
- 5.5.4. Rest of East Africa
- 5.1. Market Analysis, Insights and Forecast - by Transportation
- 6. Kenya East Africa Midstream Industry Analysis, Insights and Forecast, 2019-2031
- 6.1. Market Analysis, Insights and Forecast - by Transportation
- 6.2. Market Analysis, Insights and Forecast - by Storage
- 6.3. Market Analysis, Insights and Forecast - by LNG Terminals
- 6.4. Market Analysis, Insights and Forecast - by Geography
- 6.4.1. Kenya
- 6.4.2. Mozambique
- 6.4.3. Tanzania
- 6.4.4. Rest of East Africa
- 6.1. Market Analysis, Insights and Forecast - by Transportation
- 7. Mozambique East Africa Midstream Industry Analysis, Insights and Forecast, 2019-2031
- 7.1. Market Analysis, Insights and Forecast - by Transportation
- 7.2. Market Analysis, Insights and Forecast - by Storage
- 7.3. Market Analysis, Insights and Forecast - by LNG Terminals
- 7.4. Market Analysis, Insights and Forecast - by Geography
- 7.4.1. Kenya
- 7.4.2. Mozambique
- 7.4.3. Tanzania
- 7.4.4. Rest of East Africa
- 7.1. Market Analysis, Insights and Forecast - by Transportation
- 8. Tanzania East Africa Midstream Industry Analysis, Insights and Forecast, 2019-2031
- 8.1. Market Analysis, Insights and Forecast - by Transportation
- 8.2. Market Analysis, Insights and Forecast - by Storage
- 8.3. Market Analysis, Insights and Forecast - by LNG Terminals
- 8.4. Market Analysis, Insights and Forecast - by Geography
- 8.4.1. Kenya
- 8.4.2. Mozambique
- 8.4.3. Tanzania
- 8.4.4. Rest of East Africa
- 8.1. Market Analysis, Insights and Forecast - by Transportation
- 9. Rest of East Africa East Africa Midstream Industry Analysis, Insights and Forecast, 2019-2031
- 9.1. Market Analysis, Insights and Forecast - by Transportation
- 9.2. Market Analysis, Insights and Forecast - by Storage
- 9.3. Market Analysis, Insights and Forecast - by LNG Terminals
- 9.4. Market Analysis, Insights and Forecast - by Geography
- 9.4.1. Kenya
- 9.4.2. Mozambique
- 9.4.3. Tanzania
- 9.4.4. Rest of East Africa
- 9.1. Market Analysis, Insights and Forecast - by Transportation
- 10. South Africa East Africa Midstream Industry Analysis, Insights and Forecast, 2019-2031
- 11. Sudan East Africa Midstream Industry Analysis, Insights and Forecast, 2019-2031
- 12. Uganda East Africa Midstream Industry Analysis, Insights and Forecast, 2019-2031
- 13. Tanzania East Africa Midstream Industry Analysis, Insights and Forecast, 2019-2031
- 14. Kenya East Africa Midstream Industry Analysis, Insights and Forecast, 2019-2031
- 15. Rest of Africa East Africa Midstream Industry Analysis, Insights and Forecast, 2019-2031
- 16. Competitive Analysis
- 16.1. Market Share Analysis 2024
- 16.2. Company Profiles
- 16.2.1 Tullow Oil
- 16.2.1.1. Overview
- 16.2.1.2. Products
- 16.2.1.3. SWOT Analysis
- 16.2.1.4. Recent Developments
- 16.2.1.5. Financials (Based on Availability)
- 16.2.2 Oil and Natural Gas Corporation
- 16.2.2.1. Overview
- 16.2.2.2. Products
- 16.2.2.3. SWOT Analysis
- 16.2.2.4. Recent Developments
- 16.2.2.5. Financials (Based on Availability)
- 16.2.3 China National Petroleum Corporation
- 16.2.3.1. Overview
- 16.2.3.2. Products
- 16.2.3.3. SWOT Analysis
- 16.2.3.4. Recent Developments
- 16.2.3.5. Financials (Based on Availability)
- 16.2.4 Kenya Pipeline Company Ltd
- 16.2.4.1. Overview
- 16.2.4.2. Products
- 16.2.4.3. SWOT Analysis
- 16.2.4.4. Recent Developments
- 16.2.4.5. Financials (Based on Availability)
- 16.2.5 Petróleos de Moçambique SA
- 16.2.5.1. Overview
- 16.2.5.2. Products
- 16.2.5.3. SWOT Analysis
- 16.2.5.4. Recent Developments
- 16.2.5.5. Financials (Based on Availability)
- 16.2.6 Total S A
- 16.2.6.1. Overview
- 16.2.6.2. Products
- 16.2.6.3. SWOT Analysis
- 16.2.6.4. Recent Developments
- 16.2.6.5. Financials (Based on Availability)
- 16.2.7 Eni S p A *List Not Exhaustive
- 16.2.7.1. Overview
- 16.2.7.2. Products
- 16.2.7.3. SWOT Analysis
- 16.2.7.4. Recent Developments
- 16.2.7.5. Financials (Based on Availability)
- 16.2.8 TotalEnergies
- 16.2.8.1. Overview
- 16.2.8.2. Products
- 16.2.8.3. SWOT Analysis
- 16.2.8.4. Recent Developments
- 16.2.8.5. Financials (Based on Availability)
- 16.2.9 Tanzania Petroleum Development Corporation (TPDC)
- 16.2.9.1. Overview
- 16.2.9.2. Products
- 16.2.9.3. SWOT Analysis
- 16.2.9.4. Recent Developments
- 16.2.9.5. Financials (Based on Availability)
- 16.2.10 Uganda National Oil Company (UNOC)
- 16.2.10.1. Overview
- 16.2.10.2. Products
- 16.2.10.3. SWOT Analysis
- 16.2.10.4. Recent Developments
- 16.2.10.5. Financials (Based on Availability)
- 16.2.1 Tullow Oil
List of Figures
- Figure 1: East Africa Midstream Industry Revenue Breakdown (Million, %) by Product 2024 & 2032
- Figure 2: East Africa Midstream Industry Share (%) by Company 2024
List of Tables
- Table 1: East Africa Midstream Industry Revenue Million Forecast, by Region 2019 & 2032
- Table 2: East Africa Midstream Industry Volume K Tons Forecast, by Region 2019 & 2032
- Table 3: East Africa Midstream Industry Revenue Million Forecast, by Transportation 2019 & 2032
- Table 4: East Africa Midstream Industry Volume K Tons Forecast, by Transportation 2019 & 2032
- Table 5: East Africa Midstream Industry Revenue Million Forecast, by Storage 2019 & 2032
- Table 6: East Africa Midstream Industry Volume K Tons Forecast, by Storage 2019 & 2032
- Table 7: East Africa Midstream Industry Revenue Million Forecast, by LNG Terminals 2019 & 2032
- Table 8: East Africa Midstream Industry Volume K Tons Forecast, by LNG Terminals 2019 & 2032
- Table 9: East Africa Midstream Industry Revenue Million Forecast, by Geography 2019 & 2032
- Table 10: East Africa Midstream Industry Volume K Tons Forecast, by Geography 2019 & 2032
- Table 11: East Africa Midstream Industry Revenue Million Forecast, by Region 2019 & 2032
- Table 12: East Africa Midstream Industry Volume K Tons Forecast, by Region 2019 & 2032
- Table 13: East Africa Midstream Industry Revenue Million Forecast, by Country 2019 & 2032
- Table 14: East Africa Midstream Industry Volume K Tons Forecast, by Country 2019 & 2032
- Table 15: South Africa East Africa Midstream Industry Revenue (Million) Forecast, by Application 2019 & 2032
- Table 16: South Africa East Africa Midstream Industry Volume (K Tons) Forecast, by Application 2019 & 2032
- Table 17: Sudan East Africa Midstream Industry Revenue (Million) Forecast, by Application 2019 & 2032
- Table 18: Sudan East Africa Midstream Industry Volume (K Tons) Forecast, by Application 2019 & 2032
- Table 19: Uganda East Africa Midstream Industry Revenue (Million) Forecast, by Application 2019 & 2032
- Table 20: Uganda East Africa Midstream Industry Volume (K Tons) Forecast, by Application 2019 & 2032
- Table 21: Tanzania East Africa Midstream Industry Revenue (Million) Forecast, by Application 2019 & 2032
- Table 22: Tanzania East Africa Midstream Industry Volume (K Tons) Forecast, by Application 2019 & 2032
- Table 23: Kenya East Africa Midstream Industry Revenue (Million) Forecast, by Application 2019 & 2032
- Table 24: Kenya East Africa Midstream Industry Volume (K Tons) Forecast, by Application 2019 & 2032
- Table 25: Rest of Africa East Africa Midstream Industry Revenue (Million) Forecast, by Application 2019 & 2032
- Table 26: Rest of Africa East Africa Midstream Industry Volume (K Tons) Forecast, by Application 2019 & 2032
- Table 27: East Africa Midstream Industry Revenue Million Forecast, by Transportation 2019 & 2032
- Table 28: East Africa Midstream Industry Volume K Tons Forecast, by Transportation 2019 & 2032
- Table 29: East Africa Midstream Industry Revenue Million Forecast, by Storage 2019 & 2032
- Table 30: East Africa Midstream Industry Volume K Tons Forecast, by Storage 2019 & 2032
- Table 31: East Africa Midstream Industry Revenue Million Forecast, by LNG Terminals 2019 & 2032
- Table 32: East Africa Midstream Industry Volume K Tons Forecast, by LNG Terminals 2019 & 2032
- Table 33: East Africa Midstream Industry Revenue Million Forecast, by Geography 2019 & 2032
- Table 34: East Africa Midstream Industry Volume K Tons Forecast, by Geography 2019 & 2032
- Table 35: East Africa Midstream Industry Revenue Million Forecast, by Country 2019 & 2032
- Table 36: East Africa Midstream Industry Volume K Tons Forecast, by Country 2019 & 2032
- Table 37: East Africa Midstream Industry Revenue Million Forecast, by Transportation 2019 & 2032
- Table 38: East Africa Midstream Industry Volume K Tons Forecast, by Transportation 2019 & 2032
- Table 39: East Africa Midstream Industry Revenue Million Forecast, by Storage 2019 & 2032
- Table 40: East Africa Midstream Industry Volume K Tons Forecast, by Storage 2019 & 2032
- Table 41: East Africa Midstream Industry Revenue Million Forecast, by LNG Terminals 2019 & 2032
- Table 42: East Africa Midstream Industry Volume K Tons Forecast, by LNG Terminals 2019 & 2032
- Table 43: East Africa Midstream Industry Revenue Million Forecast, by Geography 2019 & 2032
- Table 44: East Africa Midstream Industry Volume K Tons Forecast, by Geography 2019 & 2032
- Table 45: East Africa Midstream Industry Revenue Million Forecast, by Country 2019 & 2032
- Table 46: East Africa Midstream Industry Volume K Tons Forecast, by Country 2019 & 2032
- Table 47: East Africa Midstream Industry Revenue Million Forecast, by Transportation 2019 & 2032
- Table 48: East Africa Midstream Industry Volume K Tons Forecast, by Transportation 2019 & 2032
- Table 49: East Africa Midstream Industry Revenue Million Forecast, by Storage 2019 & 2032
- Table 50: East Africa Midstream Industry Volume K Tons Forecast, by Storage 2019 & 2032
- Table 51: East Africa Midstream Industry Revenue Million Forecast, by LNG Terminals 2019 & 2032
- Table 52: East Africa Midstream Industry Volume K Tons Forecast, by LNG Terminals 2019 & 2032
- Table 53: East Africa Midstream Industry Revenue Million Forecast, by Geography 2019 & 2032
- Table 54: East Africa Midstream Industry Volume K Tons Forecast, by Geography 2019 & 2032
- Table 55: East Africa Midstream Industry Revenue Million Forecast, by Country 2019 & 2032
- Table 56: East Africa Midstream Industry Volume K Tons Forecast, by Country 2019 & 2032
- Table 57: East Africa Midstream Industry Revenue Million Forecast, by Transportation 2019 & 2032
- Table 58: East Africa Midstream Industry Volume K Tons Forecast, by Transportation 2019 & 2032
- Table 59: East Africa Midstream Industry Revenue Million Forecast, by Storage 2019 & 2032
- Table 60: East Africa Midstream Industry Volume K Tons Forecast, by Storage 2019 & 2032
- Table 61: East Africa Midstream Industry Revenue Million Forecast, by LNG Terminals 2019 & 2032
- Table 62: East Africa Midstream Industry Volume K Tons Forecast, by LNG Terminals 2019 & 2032
- Table 63: East Africa Midstream Industry Revenue Million Forecast, by Geography 2019 & 2032
- Table 64: East Africa Midstream Industry Volume K Tons Forecast, by Geography 2019 & 2032
- Table 65: East Africa Midstream Industry Revenue Million Forecast, by Country 2019 & 2032
- Table 66: East Africa Midstream Industry Volume K Tons Forecast, by Country 2019 & 2032
Frequently Asked Questions
1. What is the projected Compound Annual Growth Rate (CAGR) of the East Africa Midstream Industry?
The projected CAGR is approximately > 5.00%.
2. Which companies are prominent players in the East Africa Midstream Industry?
Key companies in the market include Tullow Oil, Oil and Natural Gas Corporation, China National Petroleum Corporation, Kenya Pipeline Company Ltd, Petróleos de Moçambique SA, Total S A, Eni S p A *List Not Exhaustive, TotalEnergies , Tanzania Petroleum Development Corporation (TPDC) , Uganda National Oil Company (UNOC).
3. What are the main segments of the East Africa Midstream Industry?
The market segments include Transportation, Storage, LNG Terminals, Geography.
4. Can you provide details about the market size?
The market size is estimated to be USD XX Million as of 2022.
5. What are some drivers contributing to market growth?
4.; Increasing Electricity Demand4.; Rsing Investments in the Coal Industry.
6. What are the notable trends driving market growth?
Transportation Sector to Witness Growth.
7. Are there any restraints impacting market growth?
4.; Increasing Installation of Renewable Energy Sources.
8. Can you provide examples of recent developments in the market?
The development of the East Africa Crude Oil Pipeline
9. What pricing options are available for accessing the report?
Pricing options include single-user, multi-user, and enterprise licenses priced at USD 4750, USD 5250, and USD 8750 respectively.
10. Is the market size provided in terms of value or volume?
The market size is provided in terms of value, measured in Million and volume, measured in K Tons.
11. Are there any specific market keywords associated with the report?
Yes, the market keyword associated with the report is "East Africa Midstream Industry," which aids in identifying and referencing the specific market segment covered.
12. How do I determine which pricing option suits my needs best?
The pricing options vary based on user requirements and access needs. Individual users may opt for single-user licenses, while businesses requiring broader access may choose multi-user or enterprise licenses for cost-effective access to the report.
13. Are there any additional resources or data provided in the East Africa Midstream Industry report?
While the report offers comprehensive insights, it's advisable to review the specific contents or supplementary materials provided to ascertain if additional resources or data are available.
14. How can I stay updated on further developments or reports in the East Africa Midstream Industry?
To stay informed about further developments, trends, and reports in the East Africa Midstream Industry, consider subscribing to industry newsletters, following relevant companies and organizations, or regularly checking reputable industry news sources and publications.
Methodology
Step 1 - Identification of Relevant Samples Size from Population Database


Step 2 - Approaches for Defining Global Market Size (Value, Volume* & Price*)

Note*: In applicable scenarios
Step 3 - Data Sources
Primary Research
- Web Analytics
- Survey Reports
- Research Institute
- Latest Research Reports
- Opinion Leaders
Secondary Research
- Annual Reports
- White Paper
- Latest Press Release
- Industry Association
- Paid Database
- Investor Presentations

Step 4 - Data Triangulation
Involves using different sources of information in order to increase the validity of a study
These sources are likely to be stakeholders in a program - participants, other researchers, program staff, other community members, and so on.
Then we put all data in single framework & apply various statistical tools to find out the dynamic on the market.
During the analysis stage, feedback from the stakeholder groups would be compared to determine areas of agreement as well as areas of divergence


