
Key Insights
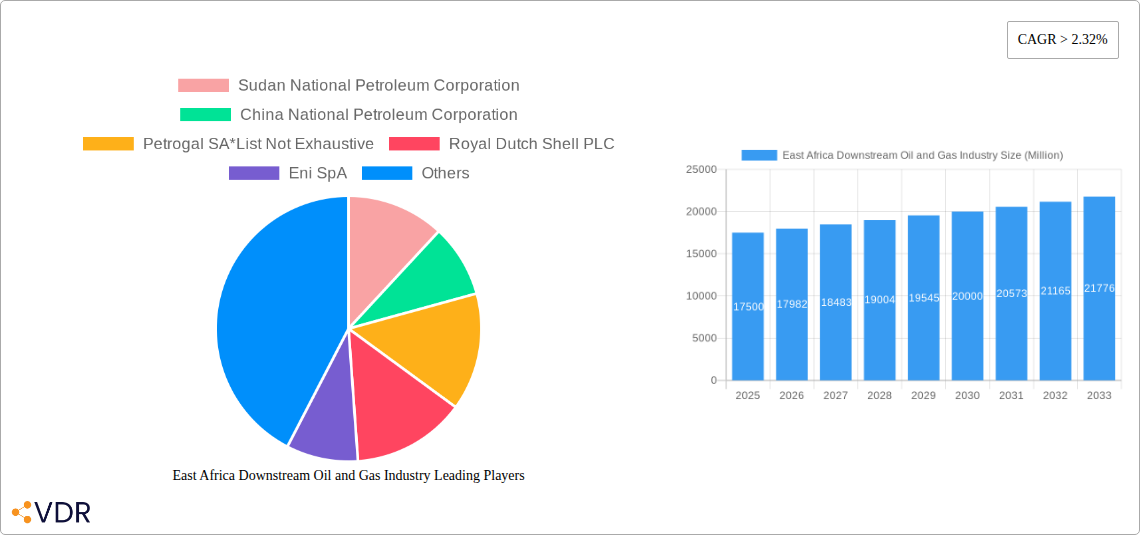
The East African downstream oil and gas industry, valued at $17,500 million in 2025, is projected to experience robust growth, driven by increasing energy demand fueled by rapid population growth and economic expansion across the region. Key growth drivers include rising urbanization, industrialization, and the expanding transportation sector, particularly in Kenya, Tanzania, and Uganda. The refined petroleum products segment currently dominates the market, followed by lubricants and liquefied petroleum gas (LPG). However, the petrochemicals sector presents significant untapped potential, with future growth projected to be spurred by government initiatives supporting industrial diversification and infrastructure development. While the industry faces constraints such as price volatility in the global oil market and infrastructural limitations in certain areas, the long-term outlook remains positive. Major players like the Sudan National Petroleum Corporation, China National Petroleum Corporation, and international giants such as Royal Dutch Shell and TotalEnergies are actively competing, shaping the market landscape through strategic investments and partnerships. The increasing focus on cleaner energy sources and environmental regulations might also influence market dynamics in the coming years, potentially shifting demand towards LPG and cleaner fuels.
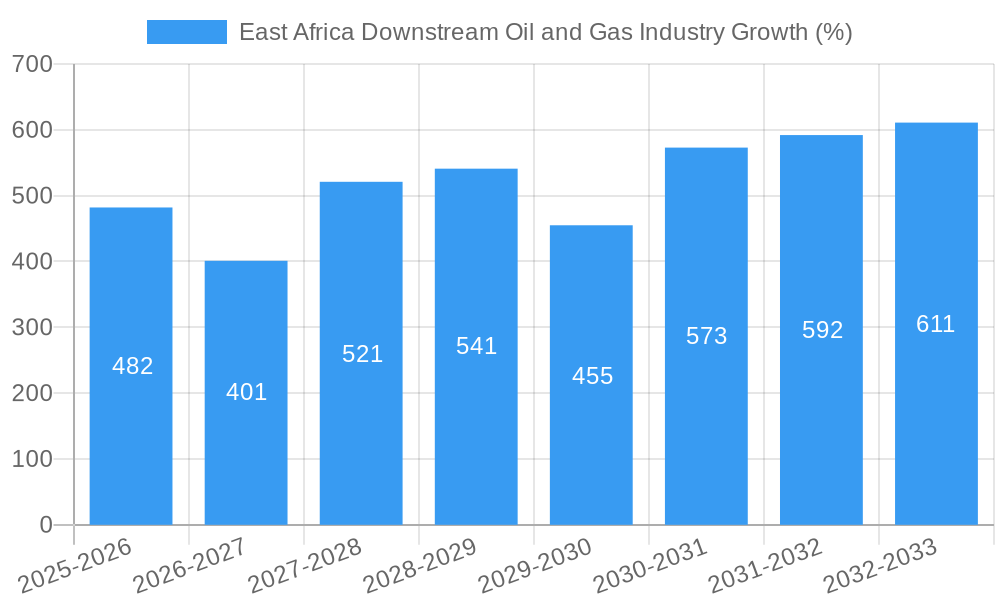
Growth within the industry is projected to be relatively consistent through the forecast period (2025-2033), maintaining a Compound Annual Growth Rate (CAGR) exceeding 2.32%. This consistent growth can be attributed to several factors including the sustained economic growth in various East African nations, the development of new infrastructure projects that support increased energy consumption, and consistent investment in the sector by both local and international companies. The industrial and transportation segments are expected to be the primary drivers of future market growth, exhibiting greater demand compared to the commercial and household sectors. This is because of the increasing industrial activity in the region, alongside a growing need for transportation fuels to facilitate the movement of goods and people. Continued investment in refining capacity and the expansion of distribution networks will be crucial in meeting this growing demand.
East Africa Downstream Oil & Gas Industry: A Comprehensive Market Report (2019-2033)
This in-depth report provides a comprehensive analysis of the East Africa downstream oil and gas industry, covering market dynamics, growth trends, dominant players, and future opportunities. The study period spans from 2019 to 2033, with a base year of 2025 and a forecast period from 2025 to 2033. The report is crucial for industry professionals, investors, and policymakers seeking to understand and capitalize on the evolving landscape of this vital sector. This report uses Million units as the unit for all values.
Keywords: East Africa, Downstream Oil & Gas, Petroleum Products, LPG, Lubricants, Petrochemicals, Market Size, Growth, Trends, Kenya, Tanzania, Uganda, Sudan, South Sudan, Industry Analysis, Market Share, Competitive Landscape, Investment Opportunities, NOCK, KPRL, Shell Kenya, Total Energies Marketing Kenya, China National Petroleum Corporation, Sudan National Petroleum Corporation, Petrogal SA, Eni SpA, Royal Dutch Shell PLC, Oil Libya (Tamoil), M&A, Savannah Energy, Petronas.
East Africa Downstream Oil and Gas Industry Market Dynamics & Structure
This section analyzes the market concentration, technological innovation, regulatory frameworks, competitive substitutes, end-user demographics, and mergers & acquisitions (M&A) activities within the East African downstream oil and gas industry.
- Market Concentration: The market is characterized by a mix of international and national players, with varying degrees of market share. xx% of the market is controlled by multinational corporations, while local players hold the remaining xx%.
- Technological Innovation: Adoption of digital technologies in supply chain management and refining processes is accelerating. However, barriers to innovation include limited access to advanced technologies and funding.
- Regulatory Frameworks: Varying regulatory environments across East African nations impact market operations, investment decisions, and pricing strategies. Harmonization of regulations could unlock significant growth potential.
- Competitive Product Substitutes: Biofuels and renewable energy sources pose a growing competitive challenge to traditional petroleum products.
- End-User Demographics: The industrial sector is the largest consumer of refined petroleum products, followed by the transportation and commercial sectors. Household consumption is also significant and growing.
- M&A Trends: The industry has witnessed several significant M&A deals recently, driven by consolidation and expansion strategies. The total value of M&A deals between 2019 and 2024 is estimated at xx Million.
East Africa Downstream Oil and Gas Industry Growth Trends & Insights
This section provides a detailed analysis of the market size evolution, adoption rates, technological disruptions, and consumer behavior shifts within the East African downstream oil and gas industry using XXX (insert specific data analysis/model here). The market is projected to experience a Compound Annual Growth Rate (CAGR) of xx% during the forecast period (2025-2033), driven by increasing energy demand and infrastructure development. Market penetration of refined petroleum products remains high, with xx% of households having access. Technological advancements are streamlining operations and improving efficiency, but challenges remain regarding affordability and accessibility in remote areas.
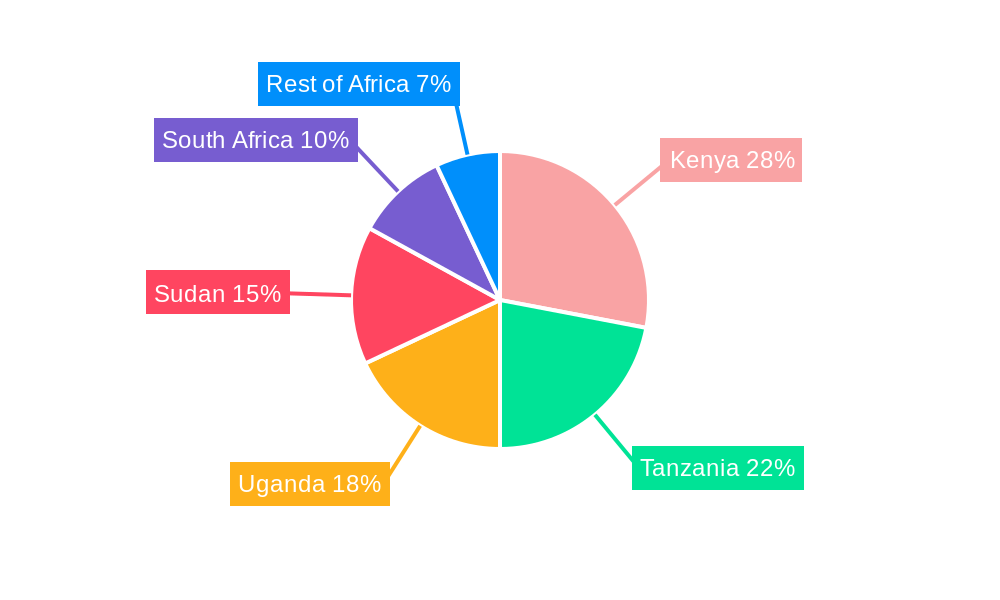
Dominant Regions, Countries, or Segments in East Africa Downstream Oil and Gas Industry
Kenya and Tanzania represent the largest markets, accounting for xx% and xx% of the total market share, respectively. The refined petroleum products segment dominates the product landscape, contributing xx% to the total revenue, followed by LPG at xx%.
- Key Drivers:
- Rapid Economic Growth: Expanding economies drive increased energy demand across all end-user segments.
- Infrastructure Development: Investments in transportation and industrial infrastructure further fuel demand for petroleum products.
- Government Policies: Favorable government policies supporting energy infrastructure development and access.
East Africa Downstream Oil and Gas Industry Product Landscape
The product landscape comprises refined petroleum products (gasoline, diesel, jet fuel), lubricants, petrochemicals, and LPG. Recent innovations focus on improving fuel efficiency, reducing emissions, and enhancing product performance. Advancements in blending technologies and the introduction of higher-quality lubricants are key trends shaping the market.
Key Drivers, Barriers & Challenges in East Africa Downstream Oil and Gas Industry
Key Drivers: Rising energy demand from growing populations and industrialization, investments in infrastructure projects, and government initiatives to improve energy access are propelling market growth.
Key Challenges: Supply chain vulnerabilities, inconsistent regulatory frameworks across countries, and price volatility associated with global crude oil prices represent key constraints. Furthermore, competition from renewable energy sources and the need to invest in refining capacity pose further challenges.
Emerging Opportunities in East Africa Downstream Oil and Gas Industry
Untapped markets in rural areas and the increasing demand for LPG for cooking present significant opportunities. The growing adoption of cleaner fuels and the potential for biofuel integration offer further avenues for expansion and innovation.
Growth Accelerators in the East Africa Downstream Oil and Gas Industry Industry
Technological breakthroughs in refining processes, strategic partnerships between international and local companies, and expansion into new markets are key growth catalysts.
Key Players Shaping the East Africa Downstream Oil and Gas Industry Market
- China National Petroleum Corporation
- Royal Dutch Shell PLC
- Eni SpA
- Kenya Petroleum Refineries Ltd (KPRL)
- Total Energies Marketing Kenya
- Shell Kenya
- National Oil Corporation of Kenya (NOCK)
- Oil Libya (Tamoil)
- Sudan National Petroleum Corporation
- Petrogal SA
Notable Milestones in East Africa Downstream Oil and Gas Industry Sector
- December 2022: Savannah Energy acquires producing oil fields in South Sudan from Petronas for USD 1.25 Billion, partnering with China National Petroleum Corporation, Oil and Natural Gas Corporation (India), and Nilepet (South Sudan). This significantly alters the South Sudanese oil landscape and influences regional market dynamics.
In-Depth East Africa Downstream Oil and Gas Industry Market Outlook
The East African downstream oil and gas industry is poised for continued growth, driven by sustained economic expansion, infrastructure development, and increasing energy demand. Strategic investments in refining capacity, diversification into cleaner fuels, and leveraging technological advancements will be crucial for companies to capture the significant market opportunities projected for the coming decade.
East Africa Downstream Oil and Gas Industry Segmentation
- 1. Refineries
- 2. Petrochemicals Plants
-
3. Geography
- 3.1. Mozambique
- 3.2. South Sudan
- 3.3. Kenya
- 3.4. Rest of East Africa
East Africa Downstream Oil and Gas Industry Segmentation By Geography
- 1. Mozambique
- 2. South Sudan
- 3. Kenya
- 4. Rest of East Africa
East Africa Downstream Oil and Gas Industry REPORT HIGHLIGHTS
| Aspects | Details |
|---|---|
| Study Period | 2019-2033 |
| Base Year | 2024 |
| Estimated Year | 2025 |
| Forecast Period | 2025-2033 |
| Historical Period | 2019-2024 |
| Growth Rate | CAGR of > 2.32% from 2019-2033 |
| Segmentation |
|
Table of Contents
- 1. Introduction
- 1.1. Research Scope
- 1.2. Market Segmentation
- 1.3. Research Methodology
- 1.4. Definitions and Assumptions
- 2. Executive Summary
- 2.1. Introduction
- 3. Market Dynamics
- 3.1. Introduction
- 3.2. Market Drivers
- 3.2.1. 4.; Increasing Electricity Demand4.; Rsing Investments in the Coal Industry
- 3.3. Market Restrains
- 3.3.1. 4.; Increasing Installation of Renewable Energy Sources
- 3.4. Market Trends
- 3.4.1. Refinery Capacity to Witness growth
- 4. Market Factor Analysis
- 4.1. Porters Five Forces
- 4.2. Supply/Value Chain
- 4.3. PESTEL analysis
- 4.4. Market Entropy
- 4.5. Patent/Trademark Analysis
- 5. East Africa Downstream Oil and Gas Industry Analysis, Insights and Forecast, 2019-2031
- 5.1. Market Analysis, Insights and Forecast - by Refineries
- 5.2. Market Analysis, Insights and Forecast - by Petrochemicals Plants
- 5.3. Market Analysis, Insights and Forecast - by Geography
- 5.3.1. Mozambique
- 5.3.2. South Sudan
- 5.3.3. Kenya
- 5.3.4. Rest of East Africa
- 5.4. Market Analysis, Insights and Forecast - by Region
- 5.4.1. Mozambique
- 5.4.2. South Sudan
- 5.4.3. Kenya
- 5.4.4. Rest of East Africa
- 5.1. Market Analysis, Insights and Forecast - by Refineries
- 6. Mozambique East Africa Downstream Oil and Gas Industry Analysis, Insights and Forecast, 2019-2031
- 6.1. Market Analysis, Insights and Forecast - by Refineries
- 6.2. Market Analysis, Insights and Forecast - by Petrochemicals Plants
- 6.3. Market Analysis, Insights and Forecast - by Geography
- 6.3.1. Mozambique
- 6.3.2. South Sudan
- 6.3.3. Kenya
- 6.3.4. Rest of East Africa
- 6.1. Market Analysis, Insights and Forecast - by Refineries
- 7. South Sudan East Africa Downstream Oil and Gas Industry Analysis, Insights and Forecast, 2019-2031
- 7.1. Market Analysis, Insights and Forecast - by Refineries
- 7.2. Market Analysis, Insights and Forecast - by Petrochemicals Plants
- 7.3. Market Analysis, Insights and Forecast - by Geography
- 7.3.1. Mozambique
- 7.3.2. South Sudan
- 7.3.3. Kenya
- 7.3.4. Rest of East Africa
- 7.1. Market Analysis, Insights and Forecast - by Refineries
- 8. Kenya East Africa Downstream Oil and Gas Industry Analysis, Insights and Forecast, 2019-2031
- 8.1. Market Analysis, Insights and Forecast - by Refineries
- 8.2. Market Analysis, Insights and Forecast - by Petrochemicals Plants
- 8.3. Market Analysis, Insights and Forecast - by Geography
- 8.3.1. Mozambique
- 8.3.2. South Sudan
- 8.3.3. Kenya
- 8.3.4. Rest of East Africa
- 8.1. Market Analysis, Insights and Forecast - by Refineries
- 9. Rest of East Africa East Africa Downstream Oil and Gas Industry Analysis, Insights and Forecast, 2019-2031
- 9.1. Market Analysis, Insights and Forecast - by Refineries
- 9.2. Market Analysis, Insights and Forecast - by Petrochemicals Plants
- 9.3. Market Analysis, Insights and Forecast - by Geography
- 9.3.1. Mozambique
- 9.3.2. South Sudan
- 9.3.3. Kenya
- 9.3.4. Rest of East Africa
- 9.1. Market Analysis, Insights and Forecast - by Refineries
- 10. South Africa East Africa Downstream Oil and Gas Industry Analysis, Insights and Forecast, 2019-2031
- 11. Sudan East Africa Downstream Oil and Gas Industry Analysis, Insights and Forecast, 2019-2031
- 12. Uganda East Africa Downstream Oil and Gas Industry Analysis, Insights and Forecast, 2019-2031
- 13. Tanzania East Africa Downstream Oil and Gas Industry Analysis, Insights and Forecast, 2019-2031
- 14. Kenya East Africa Downstream Oil and Gas Industry Analysis, Insights and Forecast, 2019-2031
- 15. Rest of Africa East Africa Downstream Oil and Gas Industry Analysis, Insights and Forecast, 2019-2031
- 16. Competitive Analysis
- 16.1. Market Share Analysis 2024
- 16.2. Company Profiles
- 16.2.1 Sudan National Petroleum Corporation
- 16.2.1.1. Overview
- 16.2.1.2. Products
- 16.2.1.3. SWOT Analysis
- 16.2.1.4. Recent Developments
- 16.2.1.5. Financials (Based on Availability)
- 16.2.2 China National Petroleum Corporation
- 16.2.2.1. Overview
- 16.2.2.2. Products
- 16.2.2.3. SWOT Analysis
- 16.2.2.4. Recent Developments
- 16.2.2.5. Financials (Based on Availability)
- 16.2.3 Petrogal SA*List Not Exhaustive
- 16.2.3.1. Overview
- 16.2.3.2. Products
- 16.2.3.3. SWOT Analysis
- 16.2.3.4. Recent Developments
- 16.2.3.5. Financials (Based on Availability)
- 16.2.4 Royal Dutch Shell PLC
- 16.2.4.1. Overview
- 16.2.4.2. Products
- 16.2.4.3. SWOT Analysis
- 16.2.4.4. Recent Developments
- 16.2.4.5. Financials (Based on Availability)
- 16.2.5 Eni SpA
- 16.2.5.1. Overview
- 16.2.5.2. Products
- 16.2.5.3. SWOT Analysis
- 16.2.5.4. Recent Developments
- 16.2.5.5. Financials (Based on Availability)
- 16.2.6 Kenya Petroleum Refineries Ltd (KPRL)
- 16.2.6.1. Overview
- 16.2.6.2. Products
- 16.2.6.3. SWOT Analysis
- 16.2.6.4. Recent Developments
- 16.2.6.5. Financials (Based on Availability)
- 16.2.7 Total Energies Marketing Kenya
- 16.2.7.1. Overview
- 16.2.7.2. Products
- 16.2.7.3. SWOT Analysis
- 16.2.7.4. Recent Developments
- 16.2.7.5. Financials (Based on Availability)
- 16.2.8 Shell Kenya
- 16.2.8.1. Overview
- 16.2.8.2. Products
- 16.2.8.3. SWOT Analysis
- 16.2.8.4. Recent Developments
- 16.2.8.5. Financials (Based on Availability)
- 16.2.9 National Oil Corporation of Kenya (NOCK)
- 16.2.9.1. Overview
- 16.2.9.2. Products
- 16.2.9.3. SWOT Analysis
- 16.2.9.4. Recent Developments
- 16.2.9.5. Financials (Based on Availability)
- 16.2.10 Oil Libya (Tamoil)
- 16.2.10.1. Overview
- 16.2.10.2. Products
- 16.2.10.3. SWOT Analysis
- 16.2.10.4. Recent Developments
- 16.2.10.5. Financials (Based on Availability)
- 16.2.1 Sudan National Petroleum Corporation
List of Figures
- Figure 1: East Africa Downstream Oil and Gas Industry Revenue Breakdown (Million, %) by Product 2024 & 2032
- Figure 2: East Africa Downstream Oil and Gas Industry Share (%) by Company 2024
List of Tables
- Table 1: East Africa Downstream Oil and Gas Industry Revenue Million Forecast, by Region 2019 & 2032
- Table 2: East Africa Downstream Oil and Gas Industry Volume liter Forecast, by Region 2019 & 2032
- Table 3: East Africa Downstream Oil and Gas Industry Revenue Million Forecast, by Refineries 2019 & 2032
- Table 4: East Africa Downstream Oil and Gas Industry Volume liter Forecast, by Refineries 2019 & 2032
- Table 5: East Africa Downstream Oil and Gas Industry Revenue Million Forecast, by Petrochemicals Plants 2019 & 2032
- Table 6: East Africa Downstream Oil and Gas Industry Volume liter Forecast, by Petrochemicals Plants 2019 & 2032
- Table 7: East Africa Downstream Oil and Gas Industry Revenue Million Forecast, by Geography 2019 & 2032
- Table 8: East Africa Downstream Oil and Gas Industry Volume liter Forecast, by Geography 2019 & 2032
- Table 9: East Africa Downstream Oil and Gas Industry Revenue Million Forecast, by Region 2019 & 2032
- Table 10: East Africa Downstream Oil and Gas Industry Volume liter Forecast, by Region 2019 & 2032
- Table 11: East Africa Downstream Oil and Gas Industry Revenue Million Forecast, by Country 2019 & 2032
- Table 12: East Africa Downstream Oil and Gas Industry Volume liter Forecast, by Country 2019 & 2032
- Table 13: South Africa East Africa Downstream Oil and Gas Industry Revenue (Million) Forecast, by Application 2019 & 2032
- Table 14: South Africa East Africa Downstream Oil and Gas Industry Volume (liter ) Forecast, by Application 2019 & 2032
- Table 15: Sudan East Africa Downstream Oil and Gas Industry Revenue (Million) Forecast, by Application 2019 & 2032
- Table 16: Sudan East Africa Downstream Oil and Gas Industry Volume (liter ) Forecast, by Application 2019 & 2032
- Table 17: Uganda East Africa Downstream Oil and Gas Industry Revenue (Million) Forecast, by Application 2019 & 2032
- Table 18: Uganda East Africa Downstream Oil and Gas Industry Volume (liter ) Forecast, by Application 2019 & 2032
- Table 19: Tanzania East Africa Downstream Oil and Gas Industry Revenue (Million) Forecast, by Application 2019 & 2032
- Table 20: Tanzania East Africa Downstream Oil and Gas Industry Volume (liter ) Forecast, by Application 2019 & 2032
- Table 21: Kenya East Africa Downstream Oil and Gas Industry Revenue (Million) Forecast, by Application 2019 & 2032
- Table 22: Kenya East Africa Downstream Oil and Gas Industry Volume (liter ) Forecast, by Application 2019 & 2032
- Table 23: Rest of Africa East Africa Downstream Oil and Gas Industry Revenue (Million) Forecast, by Application 2019 & 2032
- Table 24: Rest of Africa East Africa Downstream Oil and Gas Industry Volume (liter ) Forecast, by Application 2019 & 2032
- Table 25: East Africa Downstream Oil and Gas Industry Revenue Million Forecast, by Refineries 2019 & 2032
- Table 26: East Africa Downstream Oil and Gas Industry Volume liter Forecast, by Refineries 2019 & 2032
- Table 27: East Africa Downstream Oil and Gas Industry Revenue Million Forecast, by Petrochemicals Plants 2019 & 2032
- Table 28: East Africa Downstream Oil and Gas Industry Volume liter Forecast, by Petrochemicals Plants 2019 & 2032
- Table 29: East Africa Downstream Oil and Gas Industry Revenue Million Forecast, by Geography 2019 & 2032
- Table 30: East Africa Downstream Oil and Gas Industry Volume liter Forecast, by Geography 2019 & 2032
- Table 31: East Africa Downstream Oil and Gas Industry Revenue Million Forecast, by Country 2019 & 2032
- Table 32: East Africa Downstream Oil and Gas Industry Volume liter Forecast, by Country 2019 & 2032
- Table 33: East Africa Downstream Oil and Gas Industry Revenue Million Forecast, by Refineries 2019 & 2032
- Table 34: East Africa Downstream Oil and Gas Industry Volume liter Forecast, by Refineries 2019 & 2032
- Table 35: East Africa Downstream Oil and Gas Industry Revenue Million Forecast, by Petrochemicals Plants 2019 & 2032
- Table 36: East Africa Downstream Oil and Gas Industry Volume liter Forecast, by Petrochemicals Plants 2019 & 2032
- Table 37: East Africa Downstream Oil and Gas Industry Revenue Million Forecast, by Geography 2019 & 2032
- Table 38: East Africa Downstream Oil and Gas Industry Volume liter Forecast, by Geography 2019 & 2032
- Table 39: East Africa Downstream Oil and Gas Industry Revenue Million Forecast, by Country 2019 & 2032
- Table 40: East Africa Downstream Oil and Gas Industry Volume liter Forecast, by Country 2019 & 2032
- Table 41: East Africa Downstream Oil and Gas Industry Revenue Million Forecast, by Refineries 2019 & 2032
- Table 42: East Africa Downstream Oil and Gas Industry Volume liter Forecast, by Refineries 2019 & 2032
- Table 43: East Africa Downstream Oil and Gas Industry Revenue Million Forecast, by Petrochemicals Plants 2019 & 2032
- Table 44: East Africa Downstream Oil and Gas Industry Volume liter Forecast, by Petrochemicals Plants 2019 & 2032
- Table 45: East Africa Downstream Oil and Gas Industry Revenue Million Forecast, by Geography 2019 & 2032
- Table 46: East Africa Downstream Oil and Gas Industry Volume liter Forecast, by Geography 2019 & 2032
- Table 47: East Africa Downstream Oil and Gas Industry Revenue Million Forecast, by Country 2019 & 2032
- Table 48: East Africa Downstream Oil and Gas Industry Volume liter Forecast, by Country 2019 & 2032
- Table 49: East Africa Downstream Oil and Gas Industry Revenue Million Forecast, by Refineries 2019 & 2032
- Table 50: East Africa Downstream Oil and Gas Industry Volume liter Forecast, by Refineries 2019 & 2032
- Table 51: East Africa Downstream Oil and Gas Industry Revenue Million Forecast, by Petrochemicals Plants 2019 & 2032
- Table 52: East Africa Downstream Oil and Gas Industry Volume liter Forecast, by Petrochemicals Plants 2019 & 2032
- Table 53: East Africa Downstream Oil and Gas Industry Revenue Million Forecast, by Geography 2019 & 2032
- Table 54: East Africa Downstream Oil and Gas Industry Volume liter Forecast, by Geography 2019 & 2032
- Table 55: East Africa Downstream Oil and Gas Industry Revenue Million Forecast, by Country 2019 & 2032
- Table 56: East Africa Downstream Oil and Gas Industry Volume liter Forecast, by Country 2019 & 2032
Frequently Asked Questions
1. What is the projected Compound Annual Growth Rate (CAGR) of the East Africa Downstream Oil and Gas Industry?
The projected CAGR is approximately > 2.32%.
2. Which companies are prominent players in the East Africa Downstream Oil and Gas Industry?
Key companies in the market include Sudan National Petroleum Corporation, China National Petroleum Corporation, Petrogal SA*List Not Exhaustive, Royal Dutch Shell PLC, Eni SpA, Kenya Petroleum Refineries Ltd (KPRL) , Total Energies Marketing Kenya , Shell Kenya , National Oil Corporation of Kenya (NOCK) , Oil Libya (Tamoil).
3. What are the main segments of the East Africa Downstream Oil and Gas Industry?
The market segments include Refineries, Petrochemicals Plants, Geography.
4. Can you provide details about the market size?
The market size is estimated to be USD 17500 Million as of 2022.
5. What are some drivers contributing to market growth?
4.; Increasing Electricity Demand4.; Rsing Investments in the Coal Industry.
6. What are the notable trends driving market growth?
Refinery Capacity to Witness growth.
7. Are there any restraints impacting market growth?
4.; Increasing Installation of Renewable Energy Sources.
8. Can you provide examples of recent developments in the market?
In December 2022, Savannah Energy declared the acquisition of producing oil fields in South Sudan from Malaysian state oil and gas company Petronas. The investment is valued at USD 1.25 billion. The other partners include the international energy company, the China National Petroleum Corporation, India's flagship energy major, the Oil and Natural Gas Corporation, and South Sudan's national oil and gas company, Nilepet.
9. What pricing options are available for accessing the report?
Pricing options include single-user, multi-user, and enterprise licenses priced at USD 4750, USD 5250, and USD 8750 respectively.
10. Is the market size provided in terms of value or volume?
The market size is provided in terms of value, measured in Million and volume, measured in liter .
11. Are there any specific market keywords associated with the report?
Yes, the market keyword associated with the report is "East Africa Downstream Oil and Gas Industry," which aids in identifying and referencing the specific market segment covered.
12. How do I determine which pricing option suits my needs best?
The pricing options vary based on user requirements and access needs. Individual users may opt for single-user licenses, while businesses requiring broader access may choose multi-user or enterprise licenses for cost-effective access to the report.
13. Are there any additional resources or data provided in the East Africa Downstream Oil and Gas Industry report?
While the report offers comprehensive insights, it's advisable to review the specific contents or supplementary materials provided to ascertain if additional resources or data are available.
14. How can I stay updated on further developments or reports in the East Africa Downstream Oil and Gas Industry?
To stay informed about further developments, trends, and reports in the East Africa Downstream Oil and Gas Industry, consider subscribing to industry newsletters, following relevant companies and organizations, or regularly checking reputable industry news sources and publications.
Methodology
Step 1 - Identification of Relevant Samples Size from Population Database


Step 2 - Approaches for Defining Global Market Size (Value, Volume* & Price*)

Note*: In applicable scenarios
Step 3 - Data Sources
Primary Research
- Web Analytics
- Survey Reports
- Research Institute
- Latest Research Reports
- Opinion Leaders
Secondary Research
- Annual Reports
- White Paper
- Latest Press Release
- Industry Association
- Paid Database
- Investor Presentations

Step 4 - Data Triangulation
Involves using different sources of information in order to increase the validity of a study
These sources are likely to be stakeholders in a program - participants, other researchers, program staff, other community members, and so on.
Then we put all data in single framework & apply various statistical tools to find out the dynamic on the market.
During the analysis stage, feedback from the stakeholder groups would be compared to determine areas of agreement as well as areas of divergence


