
Key Insights
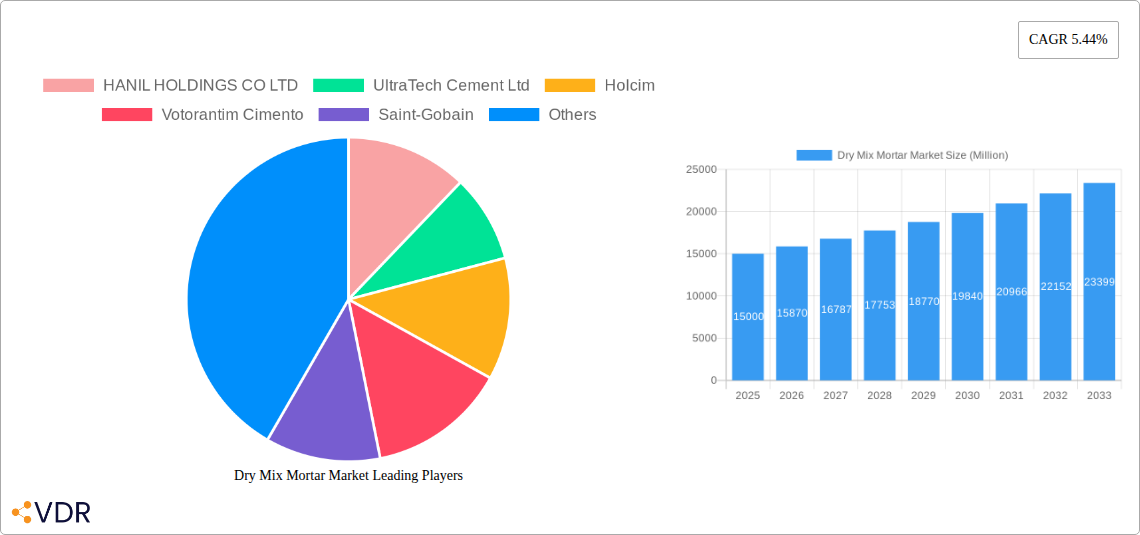
The global dry mix mortar market is experiencing robust growth, driven by the burgeoning construction sector, particularly in infrastructure and residential development across rapidly developing economies. The market's Compound Annual Growth Rate (CAGR) of 5.44% from 2019 to 2024 suggests a substantial expansion, and this trajectory is projected to continue throughout the forecast period (2025-2033). Key drivers include increasing urbanization, rising disposable incomes leading to greater construction activity, and a preference for pre-mixed mortars due to their convenience and improved consistency compared to traditional on-site mixing. Furthermore, government initiatives promoting infrastructure development in various regions are significantly contributing to market growth. The market is segmented by application (concrete protection, grouts, insulation systems, plaster, render, tile adhesives, waterproofing slurries, and others) and end-use sector (commercial, industrial, residential, and infrastructure), with the residential sector currently dominating due to high housing demand globally. Leading players like Holcim, Saint-Gobain, and Sika are leveraging technological advancements to improve product quality and expand their market share through innovation in sustainable and high-performance dry mix mortars.
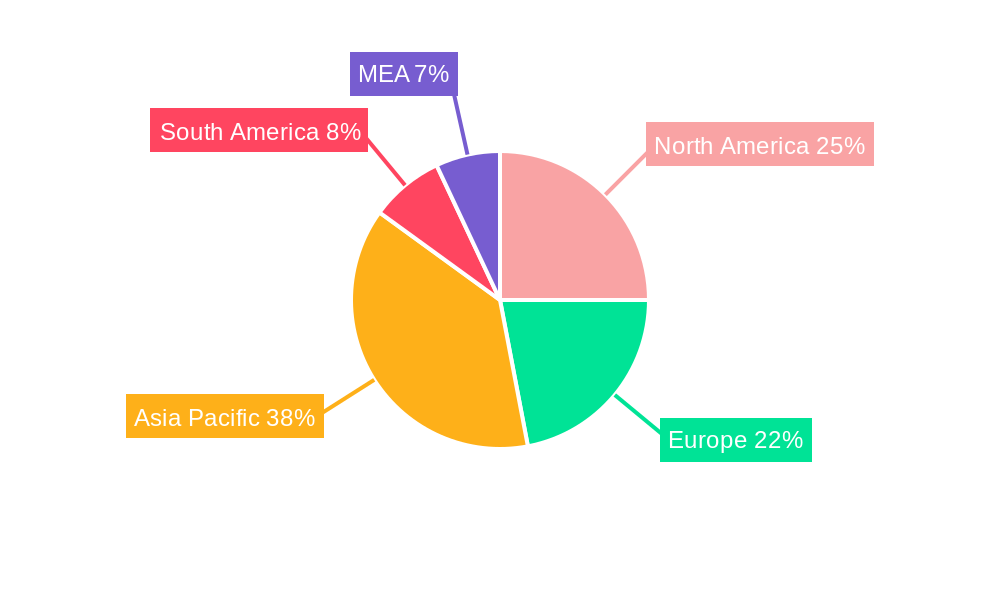
While the market presents significant opportunities, challenges remain. Fluctuations in raw material prices, particularly cement and aggregates, can impact profitability. Stringent environmental regulations related to emissions and waste disposal require manufacturers to invest in sustainable production processes. Competition amongst established players and the emergence of new entrants necessitates continuous innovation and strategic partnerships to maintain a competitive edge. However, the overall outlook for the dry mix mortar market remains positive, indicating considerable potential for growth in the coming years driven by the ongoing global construction boom and the increasing adoption of pre-mixed solutions. Specific regional performance will vary, with Asia-Pacific and North America expected to remain significant contributors to market expansion.
Dry Mix Mortar Market: A Comprehensive Market Report (2019-2033)
This comprehensive report provides an in-depth analysis of the Dry Mix Mortar market, encompassing market dynamics, growth trends, regional segmentation, product landscape, key players, and future outlook. The study period spans from 2019 to 2033, with 2025 serving as the base and estimated year. The report meticulously examines the parent market (Building Materials) and its child market (Dry Mix Mortar), offering invaluable insights for industry professionals, investors, and stakeholders. The market size is presented in million units.
Dry Mix Mortar Market Dynamics & Structure
This section delves into the competitive landscape of the dry mix mortar market, analyzing market concentration, technological advancements, regulatory influences, and market dynamics. We examine the impact of mergers and acquisitions (M&A) activities and the presence of substitute products. The analysis incorporates both quantitative (market share, M&A deal volume) and qualitative (innovation barriers) data.
- Market Concentration: The global dry mix mortar market exhibits a moderately concentrated structure, with the top 15 players holding an estimated xx% market share in 2024. This concentration is driven by the presence of multinational corporations and regional market leaders.
- Technological Innovation: Ongoing R&D efforts focus on enhancing product performance (e.g., improved strength, durability, and setting time), sustainability (e.g., reduced carbon footprint), and ease of application. Innovation barriers include high R&D costs and stringent regulatory approvals.
- Regulatory Framework: Building codes and environmental regulations significantly impact the dry mix mortar market. Compliance costs and evolving standards influence product formulations and manufacturing processes.
- Competitive Product Substitutes: Alternative construction materials, such as pre-cast concrete elements and specialized adhesives, pose competitive pressure, particularly in niche applications.
- End-User Demographics: The residential sector is a major end-use segment, while the infrastructure and commercial sectors are experiencing significant growth, driven by infrastructure development projects and increasing construction activity.
- M&A Trends: The dry mix mortar market has witnessed a moderate level of M&A activity in recent years (xx deals in 2019-2024), driven by strategic acquisitions aiming to expand product portfolios and geographical reach. This has led to increased market consolidation.
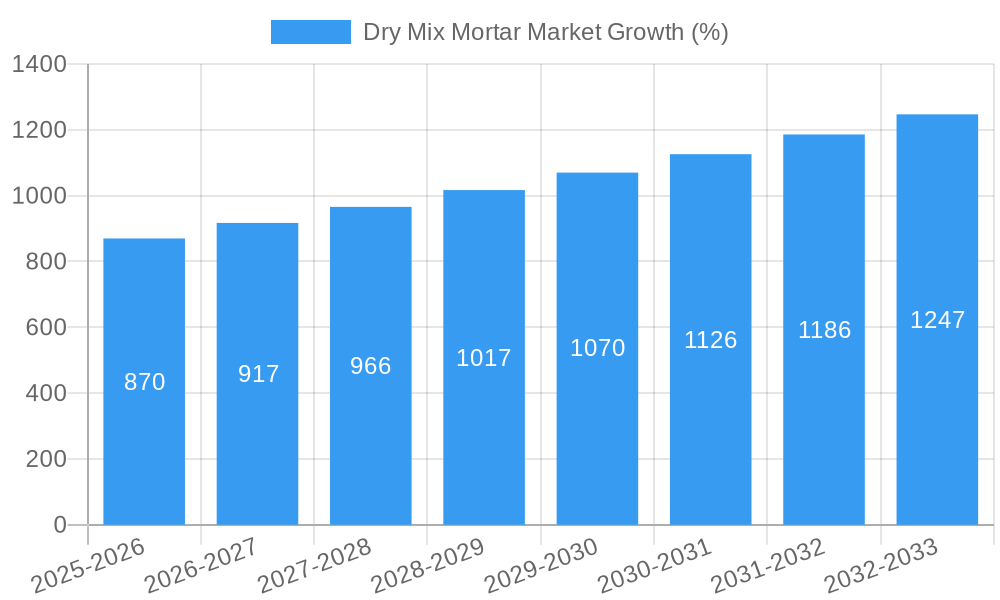
Dry Mix Mortar Market Growth Trends & Insights
This section analyzes the historical and projected growth trajectory of the dry mix mortar market using advanced analytical methodologies (XXX - specific methodology to be detailed within the full report). It examines factors influencing market size, adoption rates, technological disruptions, and evolving consumer preferences. We provide comprehensive insights into market evolution, including Compound Annual Growth Rate (CAGR) and market penetration rates.
[600 words of analysis on market size evolution, adoption rates, technological disruptions, and consumer behavior shifts, including specific metrics such as CAGR and market penetration for deeper insights will be provided in the full report].
Dominant Regions, Countries, or Segments in Dry Mix Mortar Market
This section identifies the leading geographical regions and market segments within the dry mix mortar market, focusing on factors driving their growth. The analysis considers Application (Concrete Protection and Renovation, Grouts, Insulation and Finishing Systems, Plaster, Render, Tile Adhesive, Water Proofing Slurries, Other Applications) and End-Use Sector (Commercial, Industrial and Institutional, Infrastructure, Residential) segments.
[600 words of detailed analysis on dominant regions/countries/segments including bullet points highlighting key drivers (economic policies, infrastructure) and paragraphs analyzing dominance factors (market share, growth potential) will be provided in the full report].
Dry Mix Mortar Market Product Landscape
This section describes the range of dry mix mortar products available, including their applications, performance characteristics, and unique selling propositions. We highlight recent technological advancements that enhance product performance and user experience.
[100-150 words detailing product innovations, applications, and performance metrics, highlighting unique selling propositions and technological advancements will be provided in the full report].
Key Drivers, Barriers & Challenges in Dry Mix Mortar Market
This section identifies the key factors driving market growth and the challenges hindering its expansion.
Key Drivers:
- Increasing construction activity globally.
- Growing demand for sustainable and energy-efficient building materials.
- Technological advancements leading to improved product performance.
- Government initiatives promoting infrastructure development.
Challenges and Restraints:
- Fluctuations in raw material prices (e.g., cement, aggregates).
- Stringent environmental regulations.
- Intense competition among market players.
- Supply chain disruptions impacting availability and costs.
Emerging Opportunities in Dry Mix Mortar Market
This section highlights potential avenues for market expansion and growth.
- Growing demand for specialized dry mix mortars for specific applications (e.g., self-leveling compounds, repair mortars).
- Expansion into emerging markets with robust infrastructure development.
- Development of innovative, sustainable products with reduced environmental impact.
Growth Accelerators in the Dry Mix Mortar Market Industry
This section analyzes the key factors poised to accelerate market growth in the long term.
[150 words emphasizing technological breakthroughs, strategic partnerships, or market expansion strategies will be provided in the full report].
Key Players Shaping the Dry Mix Mortar Market Market
- HANIL HOLDINGS CO LTD
- UltraTech Cement Ltd
- Holcim
- Votorantim Cimento
- Saint-Gobain
- MBCC Group
- LATICRETE International Inc
- CEMEX S A B de C V
- Ardex Group
- MAPEI S p A
- Sika AG
- SCG
- SAMPYO GROUP
- SIG
- Grupo Puma
Notable Milestones in Dry Mix Mortar Market Sector
- August 2023: LATICRETE International, Inc. launched 254 Platinum Plus, a high-performance, lightweight, thin-set mortar for tile adhesive applications. This expands their product portfolio and caters to the growing demand for innovative tile adhesives.
- May 2023: PCI (MBCC Group) introduced PCI Novoment Flow, a ready-mixed flowable screed mortar. Its quick setting and curing properties enhance construction efficiency.
- May 2023: MBCC Group divested its construction systems business to Sika AG. This significant M&A transaction reshaped the market landscape, leading to increased competition and potential synergies.
In-Depth Dry Mix Mortar Market Market Outlook
The dry mix mortar market is projected to experience robust growth over the forecast period (2025-2033), driven by factors such as sustained infrastructure development, urbanization, and increasing adoption of sustainable building practices. Strategic partnerships, technological innovations, and expansion into untapped markets present significant opportunities for market participants. This growth presents significant opportunities for both established players and new entrants seeking to capitalize on emerging trends and technological advancements within the building materials sector. The increasing focus on sustainable construction and the adoption of innovative product formulations will further drive market expansion.
Dry Mix Mortar Market Segmentation
-
1. End Use Sector
- 1.1. Commercial
- 1.2. Industrial and Institutional
- 1.3. Infrastructure
- 1.4. Residential
-
2. Application
- 2.1. Concrete Protection and Renovation
- 2.2. Grouts
- 2.3. Insulation and Finishing Systems
- 2.4. Plaster
- 2.5. Render
- 2.6. Tile Adhesive
- 2.7. Water Proofing Slurries
- 2.8. Other Applications
Dry Mix Mortar Market Segmentation By Geography
-
1. North America
- 1.1. United States
- 1.2. Canada
- 1.3. Mexico
-
2. South America
- 2.1. Brazil
- 2.2. Argentina
- 2.3. Rest of South America
-
3. Europe
- 3.1. United Kingdom
- 3.2. Germany
- 3.3. France
- 3.4. Italy
- 3.5. Spain
- 3.6. Russia
- 3.7. Benelux
- 3.8. Nordics
- 3.9. Rest of Europe
-
4. Middle East & Africa
- 4.1. Turkey
- 4.2. Israel
- 4.3. GCC
- 4.4. North Africa
- 4.5. South Africa
- 4.6. Rest of Middle East & Africa
-
5. Asia Pacific
- 5.1. China
- 5.2. India
- 5.3. Japan
- 5.4. South Korea
- 5.5. ASEAN
- 5.6. Oceania
- 5.7. Rest of Asia Pacific
Dry Mix Mortar Market REPORT HIGHLIGHTS
| Aspects | Details |
|---|---|
| Study Period | 2019-2033 |
| Base Year | 2024 |
| Estimated Year | 2025 |
| Forecast Period | 2025-2033 |
| Historical Period | 2019-2024 |
| Growth Rate | CAGR of 5.44% from 2019-2033 |
| Segmentation |
|
Table of Contents
- 1. Introduction
- 1.1. Research Scope
- 1.2. Market Segmentation
- 1.3. Research Methodology
- 1.4. Definitions and Assumptions
- 2. Executive Summary
- 2.1. Introduction
- 3. Market Dynamics
- 3.1. Introduction
- 3.2. Market Drivers
- 3.2.1. ; Banning/ Limiting Use of Plastics used in packaging applications
- 3.3. Market Restrains
- 3.3.1. ; Harmful Amines in Dyes; Paperless Green Initiatives
- 3.4. Market Trends
- 3.4.1. OTHER KEY INDUSTRY TRENDS COVERED IN THE REPORT
- 4. Market Factor Analysis
- 4.1. Porters Five Forces
- 4.2. Supply/Value Chain
- 4.3. PESTEL analysis
- 4.4. Market Entropy
- 4.5. Patent/Trademark Analysis
- 5. Global Dry Mix Mortar Market Analysis, Insights and Forecast, 2019-2031
- 5.1. Market Analysis, Insights and Forecast - by End Use Sector
- 5.1.1. Commercial
- 5.1.2. Industrial and Institutional
- 5.1.3. Infrastructure
- 5.1.4. Residential
- 5.2. Market Analysis, Insights and Forecast - by Application
- 5.2.1. Concrete Protection and Renovation
- 5.2.2. Grouts
- 5.2.3. Insulation and Finishing Systems
- 5.2.4. Plaster
- 5.2.5. Render
- 5.2.6. Tile Adhesive
- 5.2.7. Water Proofing Slurries
- 5.2.8. Other Applications
- 5.3. Market Analysis, Insights and Forecast - by Region
- 5.3.1. North America
- 5.3.2. South America
- 5.3.3. Europe
- 5.3.4. Middle East & Africa
- 5.3.5. Asia Pacific
- 5.1. Market Analysis, Insights and Forecast - by End Use Sector
- 6. North America Dry Mix Mortar Market Analysis, Insights and Forecast, 2019-2031
- 6.1. Market Analysis, Insights and Forecast - by End Use Sector
- 6.1.1. Commercial
- 6.1.2. Industrial and Institutional
- 6.1.3. Infrastructure
- 6.1.4. Residential
- 6.2. Market Analysis, Insights and Forecast - by Application
- 6.2.1. Concrete Protection and Renovation
- 6.2.2. Grouts
- 6.2.3. Insulation and Finishing Systems
- 6.2.4. Plaster
- 6.2.5. Render
- 6.2.6. Tile Adhesive
- 6.2.7. Water Proofing Slurries
- 6.2.8. Other Applications
- 6.1. Market Analysis, Insights and Forecast - by End Use Sector
- 7. South America Dry Mix Mortar Market Analysis, Insights and Forecast, 2019-2031
- 7.1. Market Analysis, Insights and Forecast - by End Use Sector
- 7.1.1. Commercial
- 7.1.2. Industrial and Institutional
- 7.1.3. Infrastructure
- 7.1.4. Residential
- 7.2. Market Analysis, Insights and Forecast - by Application
- 7.2.1. Concrete Protection and Renovation
- 7.2.2. Grouts
- 7.2.3. Insulation and Finishing Systems
- 7.2.4. Plaster
- 7.2.5. Render
- 7.2.6. Tile Adhesive
- 7.2.7. Water Proofing Slurries
- 7.2.8. Other Applications
- 7.1. Market Analysis, Insights and Forecast - by End Use Sector
- 8. Europe Dry Mix Mortar Market Analysis, Insights and Forecast, 2019-2031
- 8.1. Market Analysis, Insights and Forecast - by End Use Sector
- 8.1.1. Commercial
- 8.1.2. Industrial and Institutional
- 8.1.3. Infrastructure
- 8.1.4. Residential
- 8.2. Market Analysis, Insights and Forecast - by Application
- 8.2.1. Concrete Protection and Renovation
- 8.2.2. Grouts
- 8.2.3. Insulation and Finishing Systems
- 8.2.4. Plaster
- 8.2.5. Render
- 8.2.6. Tile Adhesive
- 8.2.7. Water Proofing Slurries
- 8.2.8. Other Applications
- 8.1. Market Analysis, Insights and Forecast - by End Use Sector
- 9. Middle East & Africa Dry Mix Mortar Market Analysis, Insights and Forecast, 2019-2031
- 9.1. Market Analysis, Insights and Forecast - by End Use Sector
- 9.1.1. Commercial
- 9.1.2. Industrial and Institutional
- 9.1.3. Infrastructure
- 9.1.4. Residential
- 9.2. Market Analysis, Insights and Forecast - by Application
- 9.2.1. Concrete Protection and Renovation
- 9.2.2. Grouts
- 9.2.3. Insulation and Finishing Systems
- 9.2.4. Plaster
- 9.2.5. Render
- 9.2.6. Tile Adhesive
- 9.2.7. Water Proofing Slurries
- 9.2.8. Other Applications
- 9.1. Market Analysis, Insights and Forecast - by End Use Sector
- 10. Asia Pacific Dry Mix Mortar Market Analysis, Insights and Forecast, 2019-2031
- 10.1. Market Analysis, Insights and Forecast - by End Use Sector
- 10.1.1. Commercial
- 10.1.2. Industrial and Institutional
- 10.1.3. Infrastructure
- 10.1.4. Residential
- 10.2. Market Analysis, Insights and Forecast - by Application
- 10.2.1. Concrete Protection and Renovation
- 10.2.2. Grouts
- 10.2.3. Insulation and Finishing Systems
- 10.2.4. Plaster
- 10.2.5. Render
- 10.2.6. Tile Adhesive
- 10.2.7. Water Proofing Slurries
- 10.2.8. Other Applications
- 10.1. Market Analysis, Insights and Forecast - by End Use Sector
- 11. North America Dry Mix Mortar Market Analysis, Insights and Forecast, 2019-2031
- 11.1. Market Analysis, Insights and Forecast - By Country/Sub-region
- 11.1.1 United States
- 11.1.2 Canada
- 11.1.3 Mexico
- 12. Europe Dry Mix Mortar Market Analysis, Insights and Forecast, 2019-2031
- 12.1. Market Analysis, Insights and Forecast - By Country/Sub-region
- 12.1.1 Germany
- 12.1.2 France
- 12.1.3 Italy
- 12.1.4 United Kingdom
- 12.1.5 Netherlands
- 12.1.6 Rest of Europe
- 13. Asia Pacific Dry Mix Mortar Market Analysis, Insights and Forecast, 2019-2031
- 13.1. Market Analysis, Insights and Forecast - By Country/Sub-region
- 13.1.1 China
- 13.1.2 Japan
- 13.1.3 India
- 13.1.4 South Korea
- 13.1.5 Taiwan
- 13.1.6 Australia
- 13.1.7 Rest of Asia-Pacific
- 14. South America Dry Mix Mortar Market Analysis, Insights and Forecast, 2019-2031
- 14.1. Market Analysis, Insights and Forecast - By Country/Sub-region
- 14.1.1 Brazil
- 14.1.2 Argentina
- 14.1.3 Rest of South America
- 15. MEA Dry Mix Mortar Market Analysis, Insights and Forecast, 2019-2031
- 15.1. Market Analysis, Insights and Forecast - By Country/Sub-region
- 15.1.1 Middle East
- 15.1.2 Africa
- 16. Competitive Analysis
- 16.1. Global Market Share Analysis 2024
- 16.2. Company Profiles
- 16.2.1 HANIL HOLDINGS CO LTD
- 16.2.1.1. Overview
- 16.2.1.2. Products
- 16.2.1.3. SWOT Analysis
- 16.2.1.4. Recent Developments
- 16.2.1.5. Financials (Based on Availability)
- 16.2.2 UltraTech Cement Ltd
- 16.2.2.1. Overview
- 16.2.2.2. Products
- 16.2.2.3. SWOT Analysis
- 16.2.2.4. Recent Developments
- 16.2.2.5. Financials (Based on Availability)
- 16.2.3 Holcim
- 16.2.3.1. Overview
- 16.2.3.2. Products
- 16.2.3.3. SWOT Analysis
- 16.2.3.4. Recent Developments
- 16.2.3.5. Financials (Based on Availability)
- 16.2.4 Votorantim Cimento
- 16.2.4.1. Overview
- 16.2.4.2. Products
- 16.2.4.3. SWOT Analysis
- 16.2.4.4. Recent Developments
- 16.2.4.5. Financials (Based on Availability)
- 16.2.5 Saint-Gobain
- 16.2.5.1. Overview
- 16.2.5.2. Products
- 16.2.5.3. SWOT Analysis
- 16.2.5.4. Recent Developments
- 16.2.5.5. Financials (Based on Availability)
- 16.2.6 MBCC Group
- 16.2.6.1. Overview
- 16.2.6.2. Products
- 16.2.6.3. SWOT Analysis
- 16.2.6.4. Recent Developments
- 16.2.6.5. Financials (Based on Availability)
- 16.2.7 LATICRETE International Inc
- 16.2.7.1. Overview
- 16.2.7.2. Products
- 16.2.7.3. SWOT Analysis
- 16.2.7.4. Recent Developments
- 16.2.7.5. Financials (Based on Availability)
- 16.2.8 CEMEX S A B de C V
- 16.2.8.1. Overview
- 16.2.8.2. Products
- 16.2.8.3. SWOT Analysis
- 16.2.8.4. Recent Developments
- 16.2.8.5. Financials (Based on Availability)
- 16.2.9 Ardex Group
- 16.2.9.1. Overview
- 16.2.9.2. Products
- 16.2.9.3. SWOT Analysis
- 16.2.9.4. Recent Developments
- 16.2.9.5. Financials (Based on Availability)
- 16.2.10 MAPEI S p A
- 16.2.10.1. Overview
- 16.2.10.2. Products
- 16.2.10.3. SWOT Analysis
- 16.2.10.4. Recent Developments
- 16.2.10.5. Financials (Based on Availability)
- 16.2.11 Sika AG
- 16.2.11.1. Overview
- 16.2.11.2. Products
- 16.2.11.3. SWOT Analysis
- 16.2.11.4. Recent Developments
- 16.2.11.5. Financials (Based on Availability)
- 16.2.12 SCG
- 16.2.12.1. Overview
- 16.2.12.2. Products
- 16.2.12.3. SWOT Analysis
- 16.2.12.4. Recent Developments
- 16.2.12.5. Financials (Based on Availability)
- 16.2.13 SAMPYO GROUP
- 16.2.13.1. Overview
- 16.2.13.2. Products
- 16.2.13.3. SWOT Analysis
- 16.2.13.4. Recent Developments
- 16.2.13.5. Financials (Based on Availability)
- 16.2.14 SIG
- 16.2.14.1. Overview
- 16.2.14.2. Products
- 16.2.14.3. SWOT Analysis
- 16.2.14.4. Recent Developments
- 16.2.14.5. Financials (Based on Availability)
- 16.2.15 Grupo Puma
- 16.2.15.1. Overview
- 16.2.15.2. Products
- 16.2.15.3. SWOT Analysis
- 16.2.15.4. Recent Developments
- 16.2.15.5. Financials (Based on Availability)
- 16.2.1 HANIL HOLDINGS CO LTD
List of Figures
- Figure 1: Global Dry Mix Mortar Market Revenue Breakdown (Million, %) by Region 2024 & 2032
- Figure 2: Global Dry Mix Mortar Market Volume Breakdown (K Tons, %) by Region 2024 & 2032
- Figure 3: North America Dry Mix Mortar Market Revenue (Million), by Country 2024 & 2032
- Figure 4: North America Dry Mix Mortar Market Volume (K Tons), by Country 2024 & 2032
- Figure 5: North America Dry Mix Mortar Market Revenue Share (%), by Country 2024 & 2032
- Figure 6: North America Dry Mix Mortar Market Volume Share (%), by Country 2024 & 2032
- Figure 7: Europe Dry Mix Mortar Market Revenue (Million), by Country 2024 & 2032
- Figure 8: Europe Dry Mix Mortar Market Volume (K Tons), by Country 2024 & 2032
- Figure 9: Europe Dry Mix Mortar Market Revenue Share (%), by Country 2024 & 2032
- Figure 10: Europe Dry Mix Mortar Market Volume Share (%), by Country 2024 & 2032
- Figure 11: Asia Pacific Dry Mix Mortar Market Revenue (Million), by Country 2024 & 2032
- Figure 12: Asia Pacific Dry Mix Mortar Market Volume (K Tons), by Country 2024 & 2032
- Figure 13: Asia Pacific Dry Mix Mortar Market Revenue Share (%), by Country 2024 & 2032
- Figure 14: Asia Pacific Dry Mix Mortar Market Volume Share (%), by Country 2024 & 2032
- Figure 15: South America Dry Mix Mortar Market Revenue (Million), by Country 2024 & 2032
- Figure 16: South America Dry Mix Mortar Market Volume (K Tons), by Country 2024 & 2032
- Figure 17: South America Dry Mix Mortar Market Revenue Share (%), by Country 2024 & 2032
- Figure 18: South America Dry Mix Mortar Market Volume Share (%), by Country 2024 & 2032
- Figure 19: MEA Dry Mix Mortar Market Revenue (Million), by Country 2024 & 2032
- Figure 20: MEA Dry Mix Mortar Market Volume (K Tons), by Country 2024 & 2032
- Figure 21: MEA Dry Mix Mortar Market Revenue Share (%), by Country 2024 & 2032
- Figure 22: MEA Dry Mix Mortar Market Volume Share (%), by Country 2024 & 2032
- Figure 23: North America Dry Mix Mortar Market Revenue (Million), by End Use Sector 2024 & 2032
- Figure 24: North America Dry Mix Mortar Market Volume (K Tons), by End Use Sector 2024 & 2032
- Figure 25: North America Dry Mix Mortar Market Revenue Share (%), by End Use Sector 2024 & 2032
- Figure 26: North America Dry Mix Mortar Market Volume Share (%), by End Use Sector 2024 & 2032
- Figure 27: North America Dry Mix Mortar Market Revenue (Million), by Application 2024 & 2032
- Figure 28: North America Dry Mix Mortar Market Volume (K Tons), by Application 2024 & 2032
- Figure 29: North America Dry Mix Mortar Market Revenue Share (%), by Application 2024 & 2032
- Figure 30: North America Dry Mix Mortar Market Volume Share (%), by Application 2024 & 2032
- Figure 31: North America Dry Mix Mortar Market Revenue (Million), by Country 2024 & 2032
- Figure 32: North America Dry Mix Mortar Market Volume (K Tons), by Country 2024 & 2032
- Figure 33: North America Dry Mix Mortar Market Revenue Share (%), by Country 2024 & 2032
- Figure 34: North America Dry Mix Mortar Market Volume Share (%), by Country 2024 & 2032
- Figure 35: South America Dry Mix Mortar Market Revenue (Million), by End Use Sector 2024 & 2032
- Figure 36: South America Dry Mix Mortar Market Volume (K Tons), by End Use Sector 2024 & 2032
- Figure 37: South America Dry Mix Mortar Market Revenue Share (%), by End Use Sector 2024 & 2032
- Figure 38: South America Dry Mix Mortar Market Volume Share (%), by End Use Sector 2024 & 2032
- Figure 39: South America Dry Mix Mortar Market Revenue (Million), by Application 2024 & 2032
- Figure 40: South America Dry Mix Mortar Market Volume (K Tons), by Application 2024 & 2032
- Figure 41: South America Dry Mix Mortar Market Revenue Share (%), by Application 2024 & 2032
- Figure 42: South America Dry Mix Mortar Market Volume Share (%), by Application 2024 & 2032
- Figure 43: South America Dry Mix Mortar Market Revenue (Million), by Country 2024 & 2032
- Figure 44: South America Dry Mix Mortar Market Volume (K Tons), by Country 2024 & 2032
- Figure 45: South America Dry Mix Mortar Market Revenue Share (%), by Country 2024 & 2032
- Figure 46: South America Dry Mix Mortar Market Volume Share (%), by Country 2024 & 2032
- Figure 47: Europe Dry Mix Mortar Market Revenue (Million), by End Use Sector 2024 & 2032
- Figure 48: Europe Dry Mix Mortar Market Volume (K Tons), by End Use Sector 2024 & 2032
- Figure 49: Europe Dry Mix Mortar Market Revenue Share (%), by End Use Sector 2024 & 2032
- Figure 50: Europe Dry Mix Mortar Market Volume Share (%), by End Use Sector 2024 & 2032
- Figure 51: Europe Dry Mix Mortar Market Revenue (Million), by Application 2024 & 2032
- Figure 52: Europe Dry Mix Mortar Market Volume (K Tons), by Application 2024 & 2032
- Figure 53: Europe Dry Mix Mortar Market Revenue Share (%), by Application 2024 & 2032
- Figure 54: Europe Dry Mix Mortar Market Volume Share (%), by Application 2024 & 2032
- Figure 55: Europe Dry Mix Mortar Market Revenue (Million), by Country 2024 & 2032
- Figure 56: Europe Dry Mix Mortar Market Volume (K Tons), by Country 2024 & 2032
- Figure 57: Europe Dry Mix Mortar Market Revenue Share (%), by Country 2024 & 2032
- Figure 58: Europe Dry Mix Mortar Market Volume Share (%), by Country 2024 & 2032
- Figure 59: Middle East & Africa Dry Mix Mortar Market Revenue (Million), by End Use Sector 2024 & 2032
- Figure 60: Middle East & Africa Dry Mix Mortar Market Volume (K Tons), by End Use Sector 2024 & 2032
- Figure 61: Middle East & Africa Dry Mix Mortar Market Revenue Share (%), by End Use Sector 2024 & 2032
- Figure 62: Middle East & Africa Dry Mix Mortar Market Volume Share (%), by End Use Sector 2024 & 2032
- Figure 63: Middle East & Africa Dry Mix Mortar Market Revenue (Million), by Application 2024 & 2032
- Figure 64: Middle East & Africa Dry Mix Mortar Market Volume (K Tons), by Application 2024 & 2032
- Figure 65: Middle East & Africa Dry Mix Mortar Market Revenue Share (%), by Application 2024 & 2032
- Figure 66: Middle East & Africa Dry Mix Mortar Market Volume Share (%), by Application 2024 & 2032
- Figure 67: Middle East & Africa Dry Mix Mortar Market Revenue (Million), by Country 2024 & 2032
- Figure 68: Middle East & Africa Dry Mix Mortar Market Volume (K Tons), by Country 2024 & 2032
- Figure 69: Middle East & Africa Dry Mix Mortar Market Revenue Share (%), by Country 2024 & 2032
- Figure 70: Middle East & Africa Dry Mix Mortar Market Volume Share (%), by Country 2024 & 2032
- Figure 71: Asia Pacific Dry Mix Mortar Market Revenue (Million), by End Use Sector 2024 & 2032
- Figure 72: Asia Pacific Dry Mix Mortar Market Volume (K Tons), by End Use Sector 2024 & 2032
- Figure 73: Asia Pacific Dry Mix Mortar Market Revenue Share (%), by End Use Sector 2024 & 2032
- Figure 74: Asia Pacific Dry Mix Mortar Market Volume Share (%), by End Use Sector 2024 & 2032
- Figure 75: Asia Pacific Dry Mix Mortar Market Revenue (Million), by Application 2024 & 2032
- Figure 76: Asia Pacific Dry Mix Mortar Market Volume (K Tons), by Application 2024 & 2032
- Figure 77: Asia Pacific Dry Mix Mortar Market Revenue Share (%), by Application 2024 & 2032
- Figure 78: Asia Pacific Dry Mix Mortar Market Volume Share (%), by Application 2024 & 2032
- Figure 79: Asia Pacific Dry Mix Mortar Market Revenue (Million), by Country 2024 & 2032
- Figure 80: Asia Pacific Dry Mix Mortar Market Volume (K Tons), by Country 2024 & 2032
- Figure 81: Asia Pacific Dry Mix Mortar Market Revenue Share (%), by Country 2024 & 2032
- Figure 82: Asia Pacific Dry Mix Mortar Market Volume Share (%), by Country 2024 & 2032
List of Tables
- Table 1: Global Dry Mix Mortar Market Revenue Million Forecast, by Region 2019 & 2032
- Table 2: Global Dry Mix Mortar Market Volume K Tons Forecast, by Region 2019 & 2032
- Table 3: Global Dry Mix Mortar Market Revenue Million Forecast, by End Use Sector 2019 & 2032
- Table 4: Global Dry Mix Mortar Market Volume K Tons Forecast, by End Use Sector 2019 & 2032
- Table 5: Global Dry Mix Mortar Market Revenue Million Forecast, by Application 2019 & 2032
- Table 6: Global Dry Mix Mortar Market Volume K Tons Forecast, by Application 2019 & 2032
- Table 7: Global Dry Mix Mortar Market Revenue Million Forecast, by Region 2019 & 2032
- Table 8: Global Dry Mix Mortar Market Volume K Tons Forecast, by Region 2019 & 2032
- Table 9: Global Dry Mix Mortar Market Revenue Million Forecast, by Country 2019 & 2032
- Table 10: Global Dry Mix Mortar Market Volume K Tons Forecast, by Country 2019 & 2032
- Table 11: United States Dry Mix Mortar Market Revenue (Million) Forecast, by Application 2019 & 2032
- Table 12: United States Dry Mix Mortar Market Volume (K Tons) Forecast, by Application 2019 & 2032
- Table 13: Canada Dry Mix Mortar Market Revenue (Million) Forecast, by Application 2019 & 2032
- Table 14: Canada Dry Mix Mortar Market Volume (K Tons) Forecast, by Application 2019 & 2032
- Table 15: Mexico Dry Mix Mortar Market Revenue (Million) Forecast, by Application 2019 & 2032
- Table 16: Mexico Dry Mix Mortar Market Volume (K Tons) Forecast, by Application 2019 & 2032
- Table 17: Global Dry Mix Mortar Market Revenue Million Forecast, by Country 2019 & 2032
- Table 18: Global Dry Mix Mortar Market Volume K Tons Forecast, by Country 2019 & 2032
- Table 19: Germany Dry Mix Mortar Market Revenue (Million) Forecast, by Application 2019 & 2032
- Table 20: Germany Dry Mix Mortar Market Volume (K Tons) Forecast, by Application 2019 & 2032
- Table 21: France Dry Mix Mortar Market Revenue (Million) Forecast, by Application 2019 & 2032
- Table 22: France Dry Mix Mortar Market Volume (K Tons) Forecast, by Application 2019 & 2032
- Table 23: Italy Dry Mix Mortar Market Revenue (Million) Forecast, by Application 2019 & 2032
- Table 24: Italy Dry Mix Mortar Market Volume (K Tons) Forecast, by Application 2019 & 2032
- Table 25: United Kingdom Dry Mix Mortar Market Revenue (Million) Forecast, by Application 2019 & 2032
- Table 26: United Kingdom Dry Mix Mortar Market Volume (K Tons) Forecast, by Application 2019 & 2032
- Table 27: Netherlands Dry Mix Mortar Market Revenue (Million) Forecast, by Application 2019 & 2032
- Table 28: Netherlands Dry Mix Mortar Market Volume (K Tons) Forecast, by Application 2019 & 2032
- Table 29: Rest of Europe Dry Mix Mortar Market Revenue (Million) Forecast, by Application 2019 & 2032
- Table 30: Rest of Europe Dry Mix Mortar Market Volume (K Tons) Forecast, by Application 2019 & 2032
- Table 31: Global Dry Mix Mortar Market Revenue Million Forecast, by Country 2019 & 2032
- Table 32: Global Dry Mix Mortar Market Volume K Tons Forecast, by Country 2019 & 2032
- Table 33: China Dry Mix Mortar Market Revenue (Million) Forecast, by Application 2019 & 2032
- Table 34: China Dry Mix Mortar Market Volume (K Tons) Forecast, by Application 2019 & 2032
- Table 35: Japan Dry Mix Mortar Market Revenue (Million) Forecast, by Application 2019 & 2032
- Table 36: Japan Dry Mix Mortar Market Volume (K Tons) Forecast, by Application 2019 & 2032
- Table 37: India Dry Mix Mortar Market Revenue (Million) Forecast, by Application 2019 & 2032
- Table 38: India Dry Mix Mortar Market Volume (K Tons) Forecast, by Application 2019 & 2032
- Table 39: South Korea Dry Mix Mortar Market Revenue (Million) Forecast, by Application 2019 & 2032
- Table 40: South Korea Dry Mix Mortar Market Volume (K Tons) Forecast, by Application 2019 & 2032
- Table 41: Taiwan Dry Mix Mortar Market Revenue (Million) Forecast, by Application 2019 & 2032
- Table 42: Taiwan Dry Mix Mortar Market Volume (K Tons) Forecast, by Application 2019 & 2032
- Table 43: Australia Dry Mix Mortar Market Revenue (Million) Forecast, by Application 2019 & 2032
- Table 44: Australia Dry Mix Mortar Market Volume (K Tons) Forecast, by Application 2019 & 2032
- Table 45: Rest of Asia-Pacific Dry Mix Mortar Market Revenue (Million) Forecast, by Application 2019 & 2032
- Table 46: Rest of Asia-Pacific Dry Mix Mortar Market Volume (K Tons) Forecast, by Application 2019 & 2032
- Table 47: Global Dry Mix Mortar Market Revenue Million Forecast, by Country 2019 & 2032
- Table 48: Global Dry Mix Mortar Market Volume K Tons Forecast, by Country 2019 & 2032
- Table 49: Brazil Dry Mix Mortar Market Revenue (Million) Forecast, by Application 2019 & 2032
- Table 50: Brazil Dry Mix Mortar Market Volume (K Tons) Forecast, by Application 2019 & 2032
- Table 51: Argentina Dry Mix Mortar Market Revenue (Million) Forecast, by Application 2019 & 2032
- Table 52: Argentina Dry Mix Mortar Market Volume (K Tons) Forecast, by Application 2019 & 2032
- Table 53: Rest of South America Dry Mix Mortar Market Revenue (Million) Forecast, by Application 2019 & 2032
- Table 54: Rest of South America Dry Mix Mortar Market Volume (K Tons) Forecast, by Application 2019 & 2032
- Table 55: Global Dry Mix Mortar Market Revenue Million Forecast, by Country 2019 & 2032
- Table 56: Global Dry Mix Mortar Market Volume K Tons Forecast, by Country 2019 & 2032
- Table 57: Middle East Dry Mix Mortar Market Revenue (Million) Forecast, by Application 2019 & 2032
- Table 58: Middle East Dry Mix Mortar Market Volume (K Tons) Forecast, by Application 2019 & 2032
- Table 59: Africa Dry Mix Mortar Market Revenue (Million) Forecast, by Application 2019 & 2032
- Table 60: Africa Dry Mix Mortar Market Volume (K Tons) Forecast, by Application 2019 & 2032
- Table 61: Global Dry Mix Mortar Market Revenue Million Forecast, by End Use Sector 2019 & 2032
- Table 62: Global Dry Mix Mortar Market Volume K Tons Forecast, by End Use Sector 2019 & 2032
- Table 63: Global Dry Mix Mortar Market Revenue Million Forecast, by Application 2019 & 2032
- Table 64: Global Dry Mix Mortar Market Volume K Tons Forecast, by Application 2019 & 2032
- Table 65: Global Dry Mix Mortar Market Revenue Million Forecast, by Country 2019 & 2032
- Table 66: Global Dry Mix Mortar Market Volume K Tons Forecast, by Country 2019 & 2032
- Table 67: United States Dry Mix Mortar Market Revenue (Million) Forecast, by Application 2019 & 2032
- Table 68: United States Dry Mix Mortar Market Volume (K Tons) Forecast, by Application 2019 & 2032
- Table 69: Canada Dry Mix Mortar Market Revenue (Million) Forecast, by Application 2019 & 2032
- Table 70: Canada Dry Mix Mortar Market Volume (K Tons) Forecast, by Application 2019 & 2032
- Table 71: Mexico Dry Mix Mortar Market Revenue (Million) Forecast, by Application 2019 & 2032
- Table 72: Mexico Dry Mix Mortar Market Volume (K Tons) Forecast, by Application 2019 & 2032
- Table 73: Global Dry Mix Mortar Market Revenue Million Forecast, by End Use Sector 2019 & 2032
- Table 74: Global Dry Mix Mortar Market Volume K Tons Forecast, by End Use Sector 2019 & 2032
- Table 75: Global Dry Mix Mortar Market Revenue Million Forecast, by Application 2019 & 2032
- Table 76: Global Dry Mix Mortar Market Volume K Tons Forecast, by Application 2019 & 2032
- Table 77: Global Dry Mix Mortar Market Revenue Million Forecast, by Country 2019 & 2032
- Table 78: Global Dry Mix Mortar Market Volume K Tons Forecast, by Country 2019 & 2032
- Table 79: Brazil Dry Mix Mortar Market Revenue (Million) Forecast, by Application 2019 & 2032
- Table 80: Brazil Dry Mix Mortar Market Volume (K Tons) Forecast, by Application 2019 & 2032
- Table 81: Argentina Dry Mix Mortar Market Revenue (Million) Forecast, by Application 2019 & 2032
- Table 82: Argentina Dry Mix Mortar Market Volume (K Tons) Forecast, by Application 2019 & 2032
- Table 83: Rest of South America Dry Mix Mortar Market Revenue (Million) Forecast, by Application 2019 & 2032
- Table 84: Rest of South America Dry Mix Mortar Market Volume (K Tons) Forecast, by Application 2019 & 2032
- Table 85: Global Dry Mix Mortar Market Revenue Million Forecast, by End Use Sector 2019 & 2032
- Table 86: Global Dry Mix Mortar Market Volume K Tons Forecast, by End Use Sector 2019 & 2032
- Table 87: Global Dry Mix Mortar Market Revenue Million Forecast, by Application 2019 & 2032
- Table 88: Global Dry Mix Mortar Market Volume K Tons Forecast, by Application 2019 & 2032
- Table 89: Global Dry Mix Mortar Market Revenue Million Forecast, by Country 2019 & 2032
- Table 90: Global Dry Mix Mortar Market Volume K Tons Forecast, by Country 2019 & 2032
- Table 91: United Kingdom Dry Mix Mortar Market Revenue (Million) Forecast, by Application 2019 & 2032
- Table 92: United Kingdom Dry Mix Mortar Market Volume (K Tons) Forecast, by Application 2019 & 2032
- Table 93: Germany Dry Mix Mortar Market Revenue (Million) Forecast, by Application 2019 & 2032
- Table 94: Germany Dry Mix Mortar Market Volume (K Tons) Forecast, by Application 2019 & 2032
- Table 95: France Dry Mix Mortar Market Revenue (Million) Forecast, by Application 2019 & 2032
- Table 96: France Dry Mix Mortar Market Volume (K Tons) Forecast, by Application 2019 & 2032
- Table 97: Italy Dry Mix Mortar Market Revenue (Million) Forecast, by Application 2019 & 2032
- Table 98: Italy Dry Mix Mortar Market Volume (K Tons) Forecast, by Application 2019 & 2032
- Table 99: Spain Dry Mix Mortar Market Revenue (Million) Forecast, by Application 2019 & 2032
- Table 100: Spain Dry Mix Mortar Market Volume (K Tons) Forecast, by Application 2019 & 2032
- Table 101: Russia Dry Mix Mortar Market Revenue (Million) Forecast, by Application 2019 & 2032
- Table 102: Russia Dry Mix Mortar Market Volume (K Tons) Forecast, by Application 2019 & 2032
- Table 103: Benelux Dry Mix Mortar Market Revenue (Million) Forecast, by Application 2019 & 2032
- Table 104: Benelux Dry Mix Mortar Market Volume (K Tons) Forecast, by Application 2019 & 2032
- Table 105: Nordics Dry Mix Mortar Market Revenue (Million) Forecast, by Application 2019 & 2032
- Table 106: Nordics Dry Mix Mortar Market Volume (K Tons) Forecast, by Application 2019 & 2032
- Table 107: Rest of Europe Dry Mix Mortar Market Revenue (Million) Forecast, by Application 2019 & 2032
- Table 108: Rest of Europe Dry Mix Mortar Market Volume (K Tons) Forecast, by Application 2019 & 2032
- Table 109: Global Dry Mix Mortar Market Revenue Million Forecast, by End Use Sector 2019 & 2032
- Table 110: Global Dry Mix Mortar Market Volume K Tons Forecast, by End Use Sector 2019 & 2032
- Table 111: Global Dry Mix Mortar Market Revenue Million Forecast, by Application 2019 & 2032
- Table 112: Global Dry Mix Mortar Market Volume K Tons Forecast, by Application 2019 & 2032
- Table 113: Global Dry Mix Mortar Market Revenue Million Forecast, by Country 2019 & 2032
- Table 114: Global Dry Mix Mortar Market Volume K Tons Forecast, by Country 2019 & 2032
- Table 115: Turkey Dry Mix Mortar Market Revenue (Million) Forecast, by Application 2019 & 2032
- Table 116: Turkey Dry Mix Mortar Market Volume (K Tons) Forecast, by Application 2019 & 2032
- Table 117: Israel Dry Mix Mortar Market Revenue (Million) Forecast, by Application 2019 & 2032
- Table 118: Israel Dry Mix Mortar Market Volume (K Tons) Forecast, by Application 2019 & 2032
- Table 119: GCC Dry Mix Mortar Market Revenue (Million) Forecast, by Application 2019 & 2032
- Table 120: GCC Dry Mix Mortar Market Volume (K Tons) Forecast, by Application 2019 & 2032
- Table 121: North Africa Dry Mix Mortar Market Revenue (Million) Forecast, by Application 2019 & 2032
- Table 122: North Africa Dry Mix Mortar Market Volume (K Tons) Forecast, by Application 2019 & 2032
- Table 123: South Africa Dry Mix Mortar Market Revenue (Million) Forecast, by Application 2019 & 2032
- Table 124: South Africa Dry Mix Mortar Market Volume (K Tons) Forecast, by Application 2019 & 2032
- Table 125: Rest of Middle East & Africa Dry Mix Mortar Market Revenue (Million) Forecast, by Application 2019 & 2032
- Table 126: Rest of Middle East & Africa Dry Mix Mortar Market Volume (K Tons) Forecast, by Application 2019 & 2032
- Table 127: Global Dry Mix Mortar Market Revenue Million Forecast, by End Use Sector 2019 & 2032
- Table 128: Global Dry Mix Mortar Market Volume K Tons Forecast, by End Use Sector 2019 & 2032
- Table 129: Global Dry Mix Mortar Market Revenue Million Forecast, by Application 2019 & 2032
- Table 130: Global Dry Mix Mortar Market Volume K Tons Forecast, by Application 2019 & 2032
- Table 131: Global Dry Mix Mortar Market Revenue Million Forecast, by Country 2019 & 2032
- Table 132: Global Dry Mix Mortar Market Volume K Tons Forecast, by Country 2019 & 2032
- Table 133: China Dry Mix Mortar Market Revenue (Million) Forecast, by Application 2019 & 2032
- Table 134: China Dry Mix Mortar Market Volume (K Tons) Forecast, by Application 2019 & 2032
- Table 135: India Dry Mix Mortar Market Revenue (Million) Forecast, by Application 2019 & 2032
- Table 136: India Dry Mix Mortar Market Volume (K Tons) Forecast, by Application 2019 & 2032
- Table 137: Japan Dry Mix Mortar Market Revenue (Million) Forecast, by Application 2019 & 2032
- Table 138: Japan Dry Mix Mortar Market Volume (K Tons) Forecast, by Application 2019 & 2032
- Table 139: South Korea Dry Mix Mortar Market Revenue (Million) Forecast, by Application 2019 & 2032
- Table 140: South Korea Dry Mix Mortar Market Volume (K Tons) Forecast, by Application 2019 & 2032
- Table 141: ASEAN Dry Mix Mortar Market Revenue (Million) Forecast, by Application 2019 & 2032
- Table 142: ASEAN Dry Mix Mortar Market Volume (K Tons) Forecast, by Application 2019 & 2032
- Table 143: Oceania Dry Mix Mortar Market Revenue (Million) Forecast, by Application 2019 & 2032
- Table 144: Oceania Dry Mix Mortar Market Volume (K Tons) Forecast, by Application 2019 & 2032
- Table 145: Rest of Asia Pacific Dry Mix Mortar Market Revenue (Million) Forecast, by Application 2019 & 2032
- Table 146: Rest of Asia Pacific Dry Mix Mortar Market Volume (K Tons) Forecast, by Application 2019 & 2032
Frequently Asked Questions
1. What is the projected Compound Annual Growth Rate (CAGR) of the Dry Mix Mortar Market?
The projected CAGR is approximately 5.44%.
2. Which companies are prominent players in the Dry Mix Mortar Market?
Key companies in the market include HANIL HOLDINGS CO LTD, UltraTech Cement Ltd, Holcim, Votorantim Cimento, Saint-Gobain, MBCC Group, LATICRETE International Inc, CEMEX S A B de C V, Ardex Group, MAPEI S p A, Sika AG, SCG, SAMPYO GROUP, SIG, Grupo Puma.
3. What are the main segments of the Dry Mix Mortar Market?
The market segments include End Use Sector, Application.
4. Can you provide details about the market size?
The market size is estimated to be USD XX Million as of 2022.
5. What are some drivers contributing to market growth?
; Banning/ Limiting Use of Plastics used in packaging applications.
6. What are the notable trends driving market growth?
OTHER KEY INDUSTRY TRENDS COVERED IN THE REPORT.
7. Are there any restraints impacting market growth?
; Harmful Amines in Dyes; Paperless Green Initiatives.
8. Can you provide examples of recent developments in the market?
August 2023: LATICRETE International, Inc. formulated a high-performance, lightweight, thin-set mortar, 254 Platinum Plus, for tile adhesive applications.May 2023: PCI, an affiliate of MBCC Group, formulated a ready-mixed flowable screed mortar, PCI Novoment Flow, offering multiple benefits like quick setting and curing.May 2023: MBCC group divested its construction systems business, including its subsidiaries, product portfolio, and advanced technologies, to Sika AG.
9. What pricing options are available for accessing the report?
Pricing options include single-user, multi-user, and enterprise licenses priced at USD 3800, USD 4500, and USD 5800 respectively.
10. Is the market size provided in terms of value or volume?
The market size is provided in terms of value, measured in Million and volume, measured in K Tons.
11. Are there any specific market keywords associated with the report?
Yes, the market keyword associated with the report is "Dry Mix Mortar Market," which aids in identifying and referencing the specific market segment covered.
12. How do I determine which pricing option suits my needs best?
The pricing options vary based on user requirements and access needs. Individual users may opt for single-user licenses, while businesses requiring broader access may choose multi-user or enterprise licenses for cost-effective access to the report.
13. Are there any additional resources or data provided in the Dry Mix Mortar Market report?
While the report offers comprehensive insights, it's advisable to review the specific contents or supplementary materials provided to ascertain if additional resources or data are available.
14. How can I stay updated on further developments or reports in the Dry Mix Mortar Market?
To stay informed about further developments, trends, and reports in the Dry Mix Mortar Market, consider subscribing to industry newsletters, following relevant companies and organizations, or regularly checking reputable industry news sources and publications.
Methodology
Step 1 - Identification of Relevant Samples Size from Population Database


Step 2 - Approaches for Defining Global Market Size (Value, Volume* & Price*)

Note*: In applicable scenarios
Step 3 - Data Sources
Primary Research
- Web Analytics
- Survey Reports
- Research Institute
- Latest Research Reports
- Opinion Leaders
Secondary Research
- Annual Reports
- White Paper
- Latest Press Release
- Industry Association
- Paid Database
- Investor Presentations

Step 4 - Data Triangulation
Involves using different sources of information in order to increase the validity of a study
These sources are likely to be stakeholders in a program - participants, other researchers, program staff, other community members, and so on.
Then we put all data in single framework & apply various statistical tools to find out the dynamic on the market.
During the analysis stage, feedback from the stakeholder groups would be compared to determine areas of agreement as well as areas of divergence


