
Key Insights
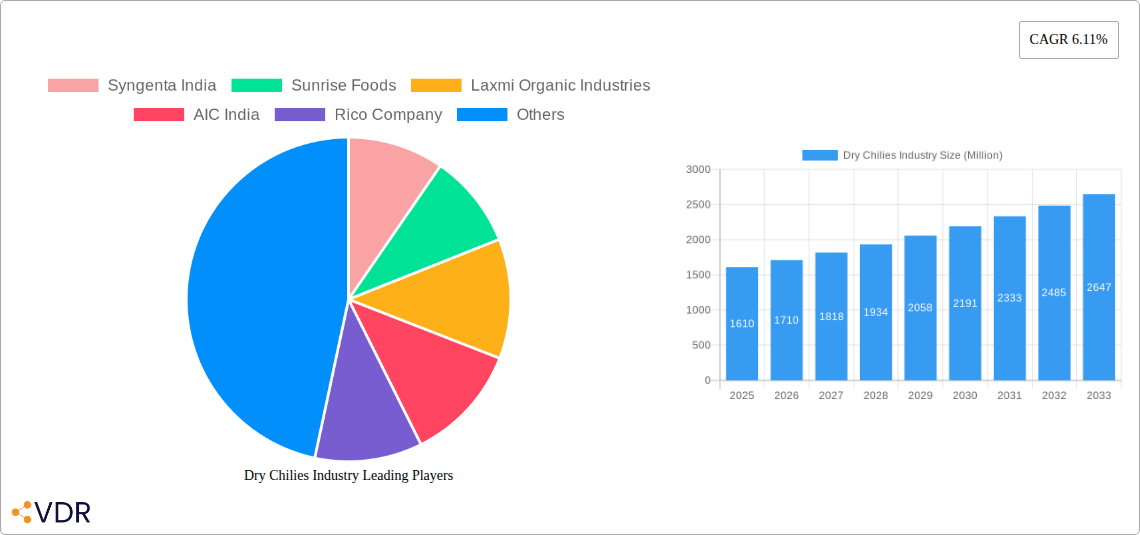
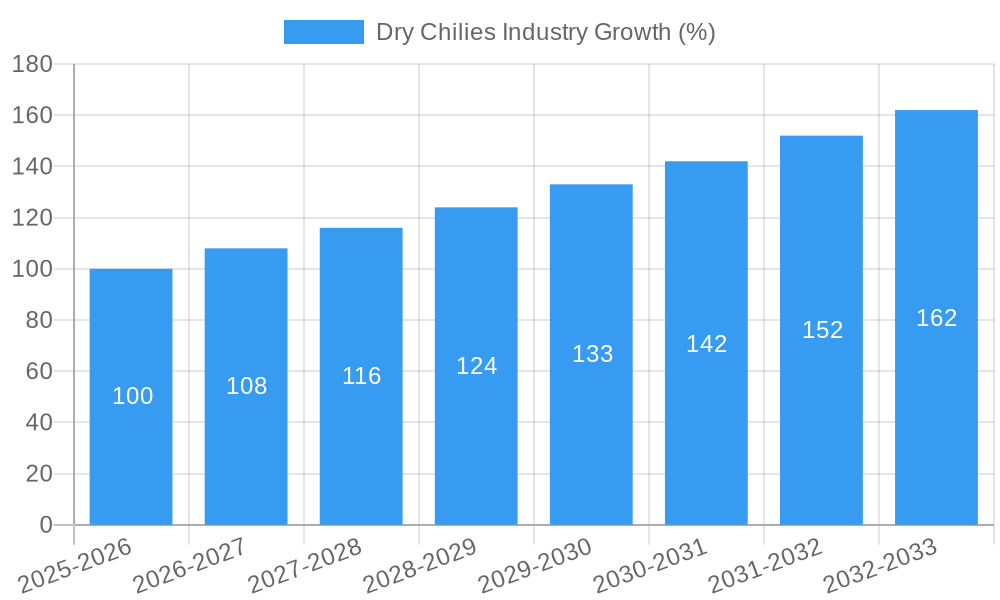
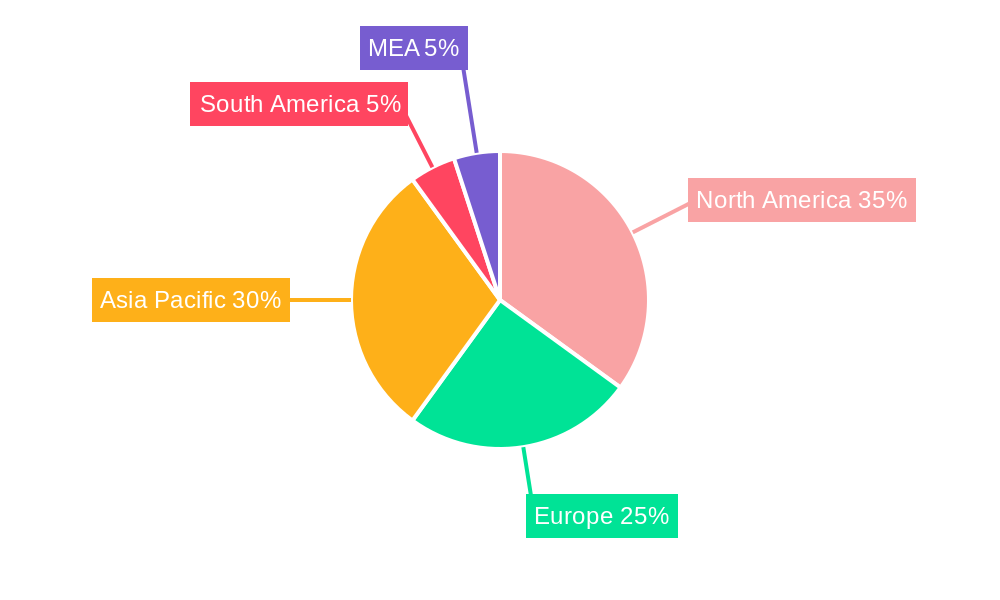
The global dry chilies market, valued at $1.61 billion in 2025, is projected to experience robust growth, driven by a Compound Annual Growth Rate (CAGR) of 6.11% from 2025 to 2033. This expansion is fueled by several key factors. The increasing demand for chili peppers as a key ingredient in diverse culinary applications across various cuisines worldwide significantly contributes to market growth. Furthermore, the rising popularity of spicy food, particularly in North America and Europe, further fuels this demand. The incorporation of dry chilies in processed foods, sauces, and condiments is also a major driver. Beyond the food and beverage sector, the market benefits from applications in pharmaceuticals (e.g., capsaicin-based pain relief), cosmetics (e.g., skincare products), and even pesticides, creating diverse revenue streams. However, factors such as fluctuating chili pepper yields due to weather conditions and the potential for price volatility can pose challenges to consistent market growth. Regional variations exist, with North America and Asia-Pacific currently dominating the market, although emerging markets in South America and the Middle East and Africa present significant growth opportunities. The market is segmented by product type (Guajillo, Ancho, Chipotle, Pasilla, California Chili) allowing for specialized market analysis. Leading players like Syngenta India, Sunrise Foods, and Laxmi Organic Industries are strategically positioning themselves to capitalize on this expanding market through product diversification and geographical expansion.
The forecast period of 2025-2033 anticipates a consistent upward trend in the dry chilies market, though the pace of growth might fluctuate slightly year-on-year based on global economic conditions and agricultural yields. The continued diversification into non-culinary applications, along with innovative product development and sustainable farming practices, will be crucial for sustained market success. Competitive landscape analysis reveals opportunities for both established players and new entrants to establish market share by focusing on specific niche markets or by leveraging technological advancements in chili cultivation and processing. Effective supply chain management and sustainable sourcing practices will also play a critical role in ensuring the long-term profitability and sustainability of this dynamic industry.
Dry Chilies Industry Market Report: 2019-2033
This comprehensive report provides an in-depth analysis of the global dry chilies market, encompassing market dynamics, growth trends, regional analysis, product landscape, key players, and future outlook. With a study period spanning 2019-2033, a base year of 2025, and a forecast period of 2025-2033, this report is an essential resource for industry professionals, investors, and researchers seeking to understand and capitalize on opportunities within this dynamic market. The report analyzes the parent market of spices and the child market of dry chilies, providing a granular view of market segmentation across product types (Guajillo, Ancho, Chipotle, Pasilla, California Chili) and applications (food and beverage, pharmaceuticals, cosmetics, pesticides).
Dry Chilies Industry Market Dynamics & Structure
This section delves into the intricate structure of the dry chilies market, analyzing market concentration, technological innovations, regulatory landscapes, competitive substitutes, end-user demographics, and mergers & acquisitions (M&A) activities. We explore the market's competitive intensity, identifying key players and their respective market shares (estimated at xx%). Technological advancements impacting cultivation, processing, and preservation are examined, alongside the regulatory frameworks governing production, trade, and labeling. The report also considers the impact of substitute products and evolving consumer preferences, incorporating quantitative and qualitative data to provide a holistic view of market dynamics.
- Market Concentration: The global dry chili market is moderately concentrated, with xx% market share held by the top 5 players.
- Technological Innovation: Focus on improved seed varieties, precision agriculture, and efficient processing techniques is driving innovation. Barriers include the adoption rate of new technologies by small-scale farmers.
- Regulatory Framework: Varying regulations across different regions impact trade and pricing. Standardization efforts are crucial for market growth.
- Competitive Substitutes: Other spices and flavoring agents present some competitive pressure, but the unique flavor profile of dry chilies maintains its demand.
- M&A Activity: The number of M&A deals in the dry chili sector from 2019-2024 totalled xx, primarily focused on consolidation and expansion into new markets.
Dry Chilies Industry Growth Trends & Insights
Utilizing extensive market research and data analysis, this section presents a comprehensive overview of the dry chilies market's growth trajectory. We analyze historical market size (2019-2024), current market size (2025), and projected market size (2025-2033), highlighting the Compound Annual Growth Rate (CAGR) and market penetration rates across various segments and regions. Technological disruptions and evolving consumer preferences significantly impact market growth.
- Market Size (2019): xx Million Units
- Market Size (2024): xx Million Units
- Market Size (2025): xx Million Units (Estimated)
- Projected Market Size (2033): xx Million Units
- CAGR (2025-2033): xx%
Dominant Regions, Countries, or Segments in Dry Chilies Industry
This section identifies the leading regions, countries, and segments within the dry chilies market, analyzing their respective market shares and growth drivers. Factors driving dominance include favorable climatic conditions, established agricultural practices, robust infrastructure, and supportive government policies. The analysis focuses on specific product types (e.g., high demand for Chipotle in specific regions) and applications (e.g., the significant role of dry chilies in the food and beverage industry).
- Leading Region: [Insert Region - e.g., Asia] due to high consumption and production.
- Key Countries: [List countries with high market share, e.g., India, Mexico, China]
- Dominant Product Type: [e.g., Ancho chilies, based on consumption data and market share]
- Leading Application: The food and beverage industry remains the dominant application sector, driven by increasing demand for spicy food and diverse culinary applications.
Dry Chilies Industry Product Landscape
This section provides a detailed overview of the dry chilies product landscape, including innovative product developments, applications, and key performance indicators. We analyze the unique selling propositions (USPs) of different chili varieties, emphasizing their flavor profiles, heat levels, and suitability for various applications. Technological advancements in processing and packaging to enhance shelf life and quality are also discussed.
Key Drivers, Barriers & Challenges in Dry Chilies Industry
This section identifies the primary factors driving market growth, including technological advancements, favorable economic conditions, and supportive government policies. Conversely, it also highlights key challenges and restraints such as supply chain disruptions, fluctuating prices due to weather patterns, and increased competition. Quantifiable impacts of these factors on market growth are assessed.
- Key Drivers: Increasing demand for spicy food, growing food processing industry, and technological advancements in farming practices.
- Key Challenges: Weather dependency, price volatility, and inconsistent quality.
Emerging Opportunities in Dry Chilies Industry
This section focuses on emerging trends and opportunities within the dry chilies market. We explore untapped market segments, the potential for innovative applications (e.g., specialized extracts for pharmaceuticals), and shifts in consumer preferences towards organic and sustainably sourced products.
Growth Accelerators in the Dry Chilies Industry
Long-term growth is projected to be fueled by technological breakthroughs in farming techniques, strategic partnerships across the value chain, and expansion into new markets. Government initiatives promoting sustainable farming and agricultural insurance schemes, like that between Syngenta India and AIC, play a crucial role.
Key Players Shaping the Dry Chilies Industry Market
- Syngenta India
- Sunrise Foods
- Laxmi Organic Industries
- AIC India
- Rico Company
Notable Milestones in Dry Chilies Industry Sector
- November 2022: The Indonesian government implemented strategic policies to boost domestic chili production, reducing reliance on imports. This initiative impacted market dynamics by increasing domestic supply and potentially influencing global pricing.
- June 2022: Syngenta India partnered with AIC to offer farmers agricultural insurance, mitigating risks associated with price fluctuations. This move enhances farmer confidence and promotes sustainable chili farming.
In-Depth Dry Chilies Industry Market Outlook
The dry chilies market is poised for significant growth driven by increasing consumer demand for spicy foods globally, innovative product development, and strategic investments in sustainable farming practices. Opportunities exist in expanding into new markets, developing value-added products, and leveraging technological advancements to improve efficiency and quality throughout the supply chain. Strategic partnerships and government support will continue to be crucial factors in shaping the market's future.
Dry Chilies Industry Segmentation
- 1. Production Analysis
- 2. Consumption Analysis
- 3. Import Market Analysis (Value & Volume)
- 4. Export Market Analysis (Value & Volume)
- 5. Price Trend Analysis
Dry Chilies Industry Segmentation By Geography
-
1. North America
- 1.1. United States
- 1.2. Canada
- 1.3. Mexico
-
2. Europe
- 2.1. United Kingdom
- 2.2. Germany
- 2.3. France
- 2.4. Spain
-
3. Asia Pacific
- 3.1. China
- 3.2. Australia
- 3.3. India
-
4. South America
- 4.1. Brazil
- 4.2. Argentina
-
5. Africa
- 5.1. South Africa
- 5.2. Egypt
Dry Chilies Industry REPORT HIGHLIGHTS
| Aspects | Details |
|---|---|
| Study Period | 2019-2033 |
| Base Year | 2024 |
| Estimated Year | 2025 |
| Forecast Period | 2025-2033 |
| Historical Period | 2019-2024 |
| Growth Rate | CAGR of 6.11% from 2019-2033 |
| Segmentation |
|
Table of Contents
- 1. Introduction
- 1.1. Research Scope
- 1.2. Market Segmentation
- 1.3. Research Methodology
- 1.4. Definitions and Assumptions
- 2. Executive Summary
- 2.1. Introduction
- 3. Market Dynamics
- 3.1. Introduction
- 3.2. Market Drivers
- 3.2.1. Increasing Berry Consumption for Health Benefits; Increasing Adoption of High-Technology Farm Practices; Growing Usage of Berries in the Food and Beverage Industries
- 3.3. Market Restrains
- 3.3.1. High Production Cost Involved in Berry Production; Increasing Disease and Pest Infestations
- 3.4. Market Trends
- 3.4.1. High Demand for the Exotic and Spicy Oriental Dishes
- 4. Market Factor Analysis
- 4.1. Porters Five Forces
- 4.2. Supply/Value Chain
- 4.3. PESTEL analysis
- 4.4. Market Entropy
- 4.5. Patent/Trademark Analysis
- 5. Global Dry Chilies Industry Analysis, Insights and Forecast, 2019-2031
- 5.1. Market Analysis, Insights and Forecast - by Production Analysis
- 5.2. Market Analysis, Insights and Forecast - by Consumption Analysis
- 5.3. Market Analysis, Insights and Forecast - by Import Market Analysis (Value & Volume)
- 5.4. Market Analysis, Insights and Forecast - by Export Market Analysis (Value & Volume)
- 5.5. Market Analysis, Insights and Forecast - by Price Trend Analysis
- 5.6. Market Analysis, Insights and Forecast - by Region
- 5.6.1. North America
- 5.6.2. Europe
- 5.6.3. Asia Pacific
- 5.6.4. South America
- 5.6.5. Africa
- 5.1. Market Analysis, Insights and Forecast - by Production Analysis
- 6. North America Dry Chilies Industry Analysis, Insights and Forecast, 2019-2031
- 6.1. Market Analysis, Insights and Forecast - by Production Analysis
- 6.2. Market Analysis, Insights and Forecast - by Consumption Analysis
- 6.3. Market Analysis, Insights and Forecast - by Import Market Analysis (Value & Volume)
- 6.4. Market Analysis, Insights and Forecast - by Export Market Analysis (Value & Volume)
- 6.5. Market Analysis, Insights and Forecast - by Price Trend Analysis
- 6.1. Market Analysis, Insights and Forecast - by Production Analysis
- 7. Europe Dry Chilies Industry Analysis, Insights and Forecast, 2019-2031
- 7.1. Market Analysis, Insights and Forecast - by Production Analysis
- 7.2. Market Analysis, Insights and Forecast - by Consumption Analysis
- 7.3. Market Analysis, Insights and Forecast - by Import Market Analysis (Value & Volume)
- 7.4. Market Analysis, Insights and Forecast - by Export Market Analysis (Value & Volume)
- 7.5. Market Analysis, Insights and Forecast - by Price Trend Analysis
- 7.1. Market Analysis, Insights and Forecast - by Production Analysis
- 8. Asia Pacific Dry Chilies Industry Analysis, Insights and Forecast, 2019-2031
- 8.1. Market Analysis, Insights and Forecast - by Production Analysis
- 8.2. Market Analysis, Insights and Forecast - by Consumption Analysis
- 8.3. Market Analysis, Insights and Forecast - by Import Market Analysis (Value & Volume)
- 8.4. Market Analysis, Insights and Forecast - by Export Market Analysis (Value & Volume)
- 8.5. Market Analysis, Insights and Forecast - by Price Trend Analysis
- 8.1. Market Analysis, Insights and Forecast - by Production Analysis
- 9. South America Dry Chilies Industry Analysis, Insights and Forecast, 2019-2031
- 9.1. Market Analysis, Insights and Forecast - by Production Analysis
- 9.2. Market Analysis, Insights and Forecast - by Consumption Analysis
- 9.3. Market Analysis, Insights and Forecast - by Import Market Analysis (Value & Volume)
- 9.4. Market Analysis, Insights and Forecast - by Export Market Analysis (Value & Volume)
- 9.5. Market Analysis, Insights and Forecast - by Price Trend Analysis
- 9.1. Market Analysis, Insights and Forecast - by Production Analysis
- 10. Africa Dry Chilies Industry Analysis, Insights and Forecast, 2019-2031
- 10.1. Market Analysis, Insights and Forecast - by Production Analysis
- 10.2. Market Analysis, Insights and Forecast - by Consumption Analysis
- 10.3. Market Analysis, Insights and Forecast - by Import Market Analysis (Value & Volume)
- 10.4. Market Analysis, Insights and Forecast - by Export Market Analysis (Value & Volume)
- 10.5. Market Analysis, Insights and Forecast - by Price Trend Analysis
- 10.1. Market Analysis, Insights and Forecast - by Production Analysis
- 11. North America Dry Chilies Industry Analysis, Insights and Forecast, 2019-2031
- 11.1. Market Analysis, Insights and Forecast - By Country/Sub-region
- 11.1.1 United States
- 11.1.2 Canada
- 11.1.3 Mexico
- 12. Europe Dry Chilies Industry Analysis, Insights and Forecast, 2019-2031
- 12.1. Market Analysis, Insights and Forecast - By Country/Sub-region
- 12.1.1 Germany
- 12.1.2 United Kingdom
- 12.1.3 France
- 12.1.4 Spain
- 12.1.5 Italy
- 12.1.6 Spain
- 12.1.7 Belgium
- 12.1.8 Netherland
- 12.1.9 Nordics
- 12.1.10 Rest of Europe
- 13. Asia Pacific Dry Chilies Industry Analysis, Insights and Forecast, 2019-2031
- 13.1. Market Analysis, Insights and Forecast - By Country/Sub-region
- 13.1.1 China
- 13.1.2 Japan
- 13.1.3 India
- 13.1.4 South Korea
- 13.1.5 Southeast Asia
- 13.1.6 Australia
- 13.1.7 Indonesia
- 13.1.8 Phillipes
- 13.1.9 Singapore
- 13.1.10 Thailandc
- 13.1.11 Rest of Asia Pacific
- 14. South America Dry Chilies Industry Analysis, Insights and Forecast, 2019-2031
- 14.1. Market Analysis, Insights and Forecast - By Country/Sub-region
- 14.1.1 Brazil
- 14.1.2 Argentina
- 14.1.3 Peru
- 14.1.4 Chile
- 14.1.5 Colombia
- 14.1.6 Ecuador
- 14.1.7 Venezuela
- 14.1.8 Rest of South America
- 15. MEA Dry Chilies Industry Analysis, Insights and Forecast, 2019-2031
- 15.1. Market Analysis, Insights and Forecast - By Country/Sub-region
- 15.1.1 United Arab Emirates
- 15.1.2 Saudi Arabia
- 15.1.3 South Africa
- 15.1.4 Rest of Middle East and Africa
- 16. Competitive Analysis
- 16.1. Global Market Share Analysis 2024
- 16.2. Company Profiles
- 16.2.1 Syngenta India
- 16.2.1.1. Overview
- 16.2.1.2. Products
- 16.2.1.3. SWOT Analysis
- 16.2.1.4. Recent Developments
- 16.2.1.5. Financials (Based on Availability)
- 16.2.2 Sunrise Foods
- 16.2.2.1. Overview
- 16.2.2.2. Products
- 16.2.2.3. SWOT Analysis
- 16.2.2.4. Recent Developments
- 16.2.2.5. Financials (Based on Availability)
- 16.2.3 Laxmi Organic Industries
- 16.2.3.1. Overview
- 16.2.3.2. Products
- 16.2.3.3. SWOT Analysis
- 16.2.3.4. Recent Developments
- 16.2.3.5. Financials (Based on Availability)
- 16.2.4 AIC India
- 16.2.4.1. Overview
- 16.2.4.2. Products
- 16.2.4.3. SWOT Analysis
- 16.2.4.4. Recent Developments
- 16.2.4.5. Financials (Based on Availability)
- 16.2.5 Rico Company
- 16.2.5.1. Overview
- 16.2.5.2. Products
- 16.2.5.3. SWOT Analysis
- 16.2.5.4. Recent Developments
- 16.2.5.5. Financials (Based on Availability)
- 16.2.1 Syngenta India
List of Figures
- Figure 1: Global Dry Chilies Industry Revenue Breakdown (Million, %) by Region 2024 & 2032
- Figure 2: North America Dry Chilies Industry Revenue (Million), by Country 2024 & 2032
- Figure 3: North America Dry Chilies Industry Revenue Share (%), by Country 2024 & 2032
- Figure 4: Europe Dry Chilies Industry Revenue (Million), by Country 2024 & 2032
- Figure 5: Europe Dry Chilies Industry Revenue Share (%), by Country 2024 & 2032
- Figure 6: Asia Pacific Dry Chilies Industry Revenue (Million), by Country 2024 & 2032
- Figure 7: Asia Pacific Dry Chilies Industry Revenue Share (%), by Country 2024 & 2032
- Figure 8: South America Dry Chilies Industry Revenue (Million), by Country 2024 & 2032
- Figure 9: South America Dry Chilies Industry Revenue Share (%), by Country 2024 & 2032
- Figure 10: MEA Dry Chilies Industry Revenue (Million), by Country 2024 & 2032
- Figure 11: MEA Dry Chilies Industry Revenue Share (%), by Country 2024 & 2032
- Figure 12: North America Dry Chilies Industry Revenue (Million), by Production Analysis 2024 & 2032
- Figure 13: North America Dry Chilies Industry Revenue Share (%), by Production Analysis 2024 & 2032
- Figure 14: North America Dry Chilies Industry Revenue (Million), by Consumption Analysis 2024 & 2032
- Figure 15: North America Dry Chilies Industry Revenue Share (%), by Consumption Analysis 2024 & 2032
- Figure 16: North America Dry Chilies Industry Revenue (Million), by Import Market Analysis (Value & Volume) 2024 & 2032
- Figure 17: North America Dry Chilies Industry Revenue Share (%), by Import Market Analysis (Value & Volume) 2024 & 2032
- Figure 18: North America Dry Chilies Industry Revenue (Million), by Export Market Analysis (Value & Volume) 2024 & 2032
- Figure 19: North America Dry Chilies Industry Revenue Share (%), by Export Market Analysis (Value & Volume) 2024 & 2032
- Figure 20: North America Dry Chilies Industry Revenue (Million), by Price Trend Analysis 2024 & 2032
- Figure 21: North America Dry Chilies Industry Revenue Share (%), by Price Trend Analysis 2024 & 2032
- Figure 22: North America Dry Chilies Industry Revenue (Million), by Country 2024 & 2032
- Figure 23: North America Dry Chilies Industry Revenue Share (%), by Country 2024 & 2032
- Figure 24: Europe Dry Chilies Industry Revenue (Million), by Production Analysis 2024 & 2032
- Figure 25: Europe Dry Chilies Industry Revenue Share (%), by Production Analysis 2024 & 2032
- Figure 26: Europe Dry Chilies Industry Revenue (Million), by Consumption Analysis 2024 & 2032
- Figure 27: Europe Dry Chilies Industry Revenue Share (%), by Consumption Analysis 2024 & 2032
- Figure 28: Europe Dry Chilies Industry Revenue (Million), by Import Market Analysis (Value & Volume) 2024 & 2032
- Figure 29: Europe Dry Chilies Industry Revenue Share (%), by Import Market Analysis (Value & Volume) 2024 & 2032
- Figure 30: Europe Dry Chilies Industry Revenue (Million), by Export Market Analysis (Value & Volume) 2024 & 2032
- Figure 31: Europe Dry Chilies Industry Revenue Share (%), by Export Market Analysis (Value & Volume) 2024 & 2032
- Figure 32: Europe Dry Chilies Industry Revenue (Million), by Price Trend Analysis 2024 & 2032
- Figure 33: Europe Dry Chilies Industry Revenue Share (%), by Price Trend Analysis 2024 & 2032
- Figure 34: Europe Dry Chilies Industry Revenue (Million), by Country 2024 & 2032
- Figure 35: Europe Dry Chilies Industry Revenue Share (%), by Country 2024 & 2032
- Figure 36: Asia Pacific Dry Chilies Industry Revenue (Million), by Production Analysis 2024 & 2032
- Figure 37: Asia Pacific Dry Chilies Industry Revenue Share (%), by Production Analysis 2024 & 2032
- Figure 38: Asia Pacific Dry Chilies Industry Revenue (Million), by Consumption Analysis 2024 & 2032
- Figure 39: Asia Pacific Dry Chilies Industry Revenue Share (%), by Consumption Analysis 2024 & 2032
- Figure 40: Asia Pacific Dry Chilies Industry Revenue (Million), by Import Market Analysis (Value & Volume) 2024 & 2032
- Figure 41: Asia Pacific Dry Chilies Industry Revenue Share (%), by Import Market Analysis (Value & Volume) 2024 & 2032
- Figure 42: Asia Pacific Dry Chilies Industry Revenue (Million), by Export Market Analysis (Value & Volume) 2024 & 2032
- Figure 43: Asia Pacific Dry Chilies Industry Revenue Share (%), by Export Market Analysis (Value & Volume) 2024 & 2032
- Figure 44: Asia Pacific Dry Chilies Industry Revenue (Million), by Price Trend Analysis 2024 & 2032
- Figure 45: Asia Pacific Dry Chilies Industry Revenue Share (%), by Price Trend Analysis 2024 & 2032
- Figure 46: Asia Pacific Dry Chilies Industry Revenue (Million), by Country 2024 & 2032
- Figure 47: Asia Pacific Dry Chilies Industry Revenue Share (%), by Country 2024 & 2032
- Figure 48: South America Dry Chilies Industry Revenue (Million), by Production Analysis 2024 & 2032
- Figure 49: South America Dry Chilies Industry Revenue Share (%), by Production Analysis 2024 & 2032
- Figure 50: South America Dry Chilies Industry Revenue (Million), by Consumption Analysis 2024 & 2032
- Figure 51: South America Dry Chilies Industry Revenue Share (%), by Consumption Analysis 2024 & 2032
- Figure 52: South America Dry Chilies Industry Revenue (Million), by Import Market Analysis (Value & Volume) 2024 & 2032
- Figure 53: South America Dry Chilies Industry Revenue Share (%), by Import Market Analysis (Value & Volume) 2024 & 2032
- Figure 54: South America Dry Chilies Industry Revenue (Million), by Export Market Analysis (Value & Volume) 2024 & 2032
- Figure 55: South America Dry Chilies Industry Revenue Share (%), by Export Market Analysis (Value & Volume) 2024 & 2032
- Figure 56: South America Dry Chilies Industry Revenue (Million), by Price Trend Analysis 2024 & 2032
- Figure 57: South America Dry Chilies Industry Revenue Share (%), by Price Trend Analysis 2024 & 2032
- Figure 58: South America Dry Chilies Industry Revenue (Million), by Country 2024 & 2032
- Figure 59: South America Dry Chilies Industry Revenue Share (%), by Country 2024 & 2032
- Figure 60: Africa Dry Chilies Industry Revenue (Million), by Production Analysis 2024 & 2032
- Figure 61: Africa Dry Chilies Industry Revenue Share (%), by Production Analysis 2024 & 2032
- Figure 62: Africa Dry Chilies Industry Revenue (Million), by Consumption Analysis 2024 & 2032
- Figure 63: Africa Dry Chilies Industry Revenue Share (%), by Consumption Analysis 2024 & 2032
- Figure 64: Africa Dry Chilies Industry Revenue (Million), by Import Market Analysis (Value & Volume) 2024 & 2032
- Figure 65: Africa Dry Chilies Industry Revenue Share (%), by Import Market Analysis (Value & Volume) 2024 & 2032
- Figure 66: Africa Dry Chilies Industry Revenue (Million), by Export Market Analysis (Value & Volume) 2024 & 2032
- Figure 67: Africa Dry Chilies Industry Revenue Share (%), by Export Market Analysis (Value & Volume) 2024 & 2032
- Figure 68: Africa Dry Chilies Industry Revenue (Million), by Price Trend Analysis 2024 & 2032
- Figure 69: Africa Dry Chilies Industry Revenue Share (%), by Price Trend Analysis 2024 & 2032
- Figure 70: Africa Dry Chilies Industry Revenue (Million), by Country 2024 & 2032
- Figure 71: Africa Dry Chilies Industry Revenue Share (%), by Country 2024 & 2032
List of Tables
- Table 1: Global Dry Chilies Industry Revenue Million Forecast, by Region 2019 & 2032
- Table 2: Global Dry Chilies Industry Revenue Million Forecast, by Production Analysis 2019 & 2032
- Table 3: Global Dry Chilies Industry Revenue Million Forecast, by Consumption Analysis 2019 & 2032
- Table 4: Global Dry Chilies Industry Revenue Million Forecast, by Import Market Analysis (Value & Volume) 2019 & 2032
- Table 5: Global Dry Chilies Industry Revenue Million Forecast, by Export Market Analysis (Value & Volume) 2019 & 2032
- Table 6: Global Dry Chilies Industry Revenue Million Forecast, by Price Trend Analysis 2019 & 2032
- Table 7: Global Dry Chilies Industry Revenue Million Forecast, by Region 2019 & 2032
- Table 8: Global Dry Chilies Industry Revenue Million Forecast, by Country 2019 & 2032
- Table 9: United States Dry Chilies Industry Revenue (Million) Forecast, by Application 2019 & 2032
- Table 10: Canada Dry Chilies Industry Revenue (Million) Forecast, by Application 2019 & 2032
- Table 11: Mexico Dry Chilies Industry Revenue (Million) Forecast, by Application 2019 & 2032
- Table 12: Global Dry Chilies Industry Revenue Million Forecast, by Country 2019 & 2032
- Table 13: Germany Dry Chilies Industry Revenue (Million) Forecast, by Application 2019 & 2032
- Table 14: United Kingdom Dry Chilies Industry Revenue (Million) Forecast, by Application 2019 & 2032
- Table 15: France Dry Chilies Industry Revenue (Million) Forecast, by Application 2019 & 2032
- Table 16: Spain Dry Chilies Industry Revenue (Million) Forecast, by Application 2019 & 2032
- Table 17: Italy Dry Chilies Industry Revenue (Million) Forecast, by Application 2019 & 2032
- Table 18: Spain Dry Chilies Industry Revenue (Million) Forecast, by Application 2019 & 2032
- Table 19: Belgium Dry Chilies Industry Revenue (Million) Forecast, by Application 2019 & 2032
- Table 20: Netherland Dry Chilies Industry Revenue (Million) Forecast, by Application 2019 & 2032
- Table 21: Nordics Dry Chilies Industry Revenue (Million) Forecast, by Application 2019 & 2032
- Table 22: Rest of Europe Dry Chilies Industry Revenue (Million) Forecast, by Application 2019 & 2032
- Table 23: Global Dry Chilies Industry Revenue Million Forecast, by Country 2019 & 2032
- Table 24: China Dry Chilies Industry Revenue (Million) Forecast, by Application 2019 & 2032
- Table 25: Japan Dry Chilies Industry Revenue (Million) Forecast, by Application 2019 & 2032
- Table 26: India Dry Chilies Industry Revenue (Million) Forecast, by Application 2019 & 2032
- Table 27: South Korea Dry Chilies Industry Revenue (Million) Forecast, by Application 2019 & 2032
- Table 28: Southeast Asia Dry Chilies Industry Revenue (Million) Forecast, by Application 2019 & 2032
- Table 29: Australia Dry Chilies Industry Revenue (Million) Forecast, by Application 2019 & 2032
- Table 30: Indonesia Dry Chilies Industry Revenue (Million) Forecast, by Application 2019 & 2032
- Table 31: Phillipes Dry Chilies Industry Revenue (Million) Forecast, by Application 2019 & 2032
- Table 32: Singapore Dry Chilies Industry Revenue (Million) Forecast, by Application 2019 & 2032
- Table 33: Thailandc Dry Chilies Industry Revenue (Million) Forecast, by Application 2019 & 2032
- Table 34: Rest of Asia Pacific Dry Chilies Industry Revenue (Million) Forecast, by Application 2019 & 2032
- Table 35: Global Dry Chilies Industry Revenue Million Forecast, by Country 2019 & 2032
- Table 36: Brazil Dry Chilies Industry Revenue (Million) Forecast, by Application 2019 & 2032
- Table 37: Argentina Dry Chilies Industry Revenue (Million) Forecast, by Application 2019 & 2032
- Table 38: Peru Dry Chilies Industry Revenue (Million) Forecast, by Application 2019 & 2032
- Table 39: Chile Dry Chilies Industry Revenue (Million) Forecast, by Application 2019 & 2032
- Table 40: Colombia Dry Chilies Industry Revenue (Million) Forecast, by Application 2019 & 2032
- Table 41: Ecuador Dry Chilies Industry Revenue (Million) Forecast, by Application 2019 & 2032
- Table 42: Venezuela Dry Chilies Industry Revenue (Million) Forecast, by Application 2019 & 2032
- Table 43: Rest of South America Dry Chilies Industry Revenue (Million) Forecast, by Application 2019 & 2032
- Table 44: Global Dry Chilies Industry Revenue Million Forecast, by Country 2019 & 2032
- Table 45: United Arab Emirates Dry Chilies Industry Revenue (Million) Forecast, by Application 2019 & 2032
- Table 46: Saudi Arabia Dry Chilies Industry Revenue (Million) Forecast, by Application 2019 & 2032
- Table 47: South Africa Dry Chilies Industry Revenue (Million) Forecast, by Application 2019 & 2032
- Table 48: Rest of Middle East and Africa Dry Chilies Industry Revenue (Million) Forecast, by Application 2019 & 2032
- Table 49: Global Dry Chilies Industry Revenue Million Forecast, by Production Analysis 2019 & 2032
- Table 50: Global Dry Chilies Industry Revenue Million Forecast, by Consumption Analysis 2019 & 2032
- Table 51: Global Dry Chilies Industry Revenue Million Forecast, by Import Market Analysis (Value & Volume) 2019 & 2032
- Table 52: Global Dry Chilies Industry Revenue Million Forecast, by Export Market Analysis (Value & Volume) 2019 & 2032
- Table 53: Global Dry Chilies Industry Revenue Million Forecast, by Price Trend Analysis 2019 & 2032
- Table 54: Global Dry Chilies Industry Revenue Million Forecast, by Country 2019 & 2032
- Table 55: United States Dry Chilies Industry Revenue (Million) Forecast, by Application 2019 & 2032
- Table 56: Canada Dry Chilies Industry Revenue (Million) Forecast, by Application 2019 & 2032
- Table 57: Mexico Dry Chilies Industry Revenue (Million) Forecast, by Application 2019 & 2032
- Table 58: Global Dry Chilies Industry Revenue Million Forecast, by Production Analysis 2019 & 2032
- Table 59: Global Dry Chilies Industry Revenue Million Forecast, by Consumption Analysis 2019 & 2032
- Table 60: Global Dry Chilies Industry Revenue Million Forecast, by Import Market Analysis (Value & Volume) 2019 & 2032
- Table 61: Global Dry Chilies Industry Revenue Million Forecast, by Export Market Analysis (Value & Volume) 2019 & 2032
- Table 62: Global Dry Chilies Industry Revenue Million Forecast, by Price Trend Analysis 2019 & 2032
- Table 63: Global Dry Chilies Industry Revenue Million Forecast, by Country 2019 & 2032
- Table 64: United Kingdom Dry Chilies Industry Revenue (Million) Forecast, by Application 2019 & 2032
- Table 65: Germany Dry Chilies Industry Revenue (Million) Forecast, by Application 2019 & 2032
- Table 66: France Dry Chilies Industry Revenue (Million) Forecast, by Application 2019 & 2032
- Table 67: Spain Dry Chilies Industry Revenue (Million) Forecast, by Application 2019 & 2032
- Table 68: Global Dry Chilies Industry Revenue Million Forecast, by Production Analysis 2019 & 2032
- Table 69: Global Dry Chilies Industry Revenue Million Forecast, by Consumption Analysis 2019 & 2032
- Table 70: Global Dry Chilies Industry Revenue Million Forecast, by Import Market Analysis (Value & Volume) 2019 & 2032
- Table 71: Global Dry Chilies Industry Revenue Million Forecast, by Export Market Analysis (Value & Volume) 2019 & 2032
- Table 72: Global Dry Chilies Industry Revenue Million Forecast, by Price Trend Analysis 2019 & 2032
- Table 73: Global Dry Chilies Industry Revenue Million Forecast, by Country 2019 & 2032
- Table 74: China Dry Chilies Industry Revenue (Million) Forecast, by Application 2019 & 2032
- Table 75: Australia Dry Chilies Industry Revenue (Million) Forecast, by Application 2019 & 2032
- Table 76: India Dry Chilies Industry Revenue (Million) Forecast, by Application 2019 & 2032
- Table 77: Global Dry Chilies Industry Revenue Million Forecast, by Production Analysis 2019 & 2032
- Table 78: Global Dry Chilies Industry Revenue Million Forecast, by Consumption Analysis 2019 & 2032
- Table 79: Global Dry Chilies Industry Revenue Million Forecast, by Import Market Analysis (Value & Volume) 2019 & 2032
- Table 80: Global Dry Chilies Industry Revenue Million Forecast, by Export Market Analysis (Value & Volume) 2019 & 2032
- Table 81: Global Dry Chilies Industry Revenue Million Forecast, by Price Trend Analysis 2019 & 2032
- Table 82: Global Dry Chilies Industry Revenue Million Forecast, by Country 2019 & 2032
- Table 83: Brazil Dry Chilies Industry Revenue (Million) Forecast, by Application 2019 & 2032
- Table 84: Argentina Dry Chilies Industry Revenue (Million) Forecast, by Application 2019 & 2032
- Table 85: Global Dry Chilies Industry Revenue Million Forecast, by Production Analysis 2019 & 2032
- Table 86: Global Dry Chilies Industry Revenue Million Forecast, by Consumption Analysis 2019 & 2032
- Table 87: Global Dry Chilies Industry Revenue Million Forecast, by Import Market Analysis (Value & Volume) 2019 & 2032
- Table 88: Global Dry Chilies Industry Revenue Million Forecast, by Export Market Analysis (Value & Volume) 2019 & 2032
- Table 89: Global Dry Chilies Industry Revenue Million Forecast, by Price Trend Analysis 2019 & 2032
- Table 90: Global Dry Chilies Industry Revenue Million Forecast, by Country 2019 & 2032
- Table 91: South Africa Dry Chilies Industry Revenue (Million) Forecast, by Application 2019 & 2032
- Table 92: Egypt Dry Chilies Industry Revenue (Million) Forecast, by Application 2019 & 2032
Frequently Asked Questions
1. What is the projected Compound Annual Growth Rate (CAGR) of the Dry Chilies Industry?
The projected CAGR is approximately 6.11%.
2. Which companies are prominent players in the Dry Chilies Industry?
Key companies in the market include Syngenta India, Sunrise Foods, Laxmi Organic Industries, AIC India, Rico Company.
3. What are the main segments of the Dry Chilies Industry?
The market segments include Production Analysis, Consumption Analysis, Import Market Analysis (Value & Volume), Export Market Analysis (Value & Volume), Price Trend Analysis.
4. Can you provide details about the market size?
The market size is estimated to be USD 1.61 Million as of 2022.
5. What are some drivers contributing to market growth?
Increasing Berry Consumption for Health Benefits; Increasing Adoption of High-Technology Farm Practices; Growing Usage of Berries in the Food and Beverage Industries.
6. What are the notable trends driving market growth?
High Demand for the Exotic and Spicy Oriental Dishes.
7. Are there any restraints impacting market growth?
High Production Cost Involved in Berry Production; Increasing Disease and Pest Infestations.
8. Can you provide examples of recent developments in the market?
November 2022: The Indonesian government increased domestic production of chilies rather than importing them from abroad, and to do this, it implemented strategic policies for chili development using hybrid seeds, complete and balanced fertilization, better irrigation infrastructure and farming roads, increasing the capacity of farmers' resources, and expanding the goals and market segments.
9. What pricing options are available for accessing the report?
Pricing options include single-user, multi-user, and enterprise licenses priced at USD 4750, USD 5250, and USD 8750 respectively.
10. Is the market size provided in terms of value or volume?
The market size is provided in terms of value, measured in Million.
11. Are there any specific market keywords associated with the report?
Yes, the market keyword associated with the report is "Dry Chilies Industry," which aids in identifying and referencing the specific market segment covered.
12. How do I determine which pricing option suits my needs best?
The pricing options vary based on user requirements and access needs. Individual users may opt for single-user licenses, while businesses requiring broader access may choose multi-user or enterprise licenses for cost-effective access to the report.
13. Are there any additional resources or data provided in the Dry Chilies Industry report?
While the report offers comprehensive insights, it's advisable to review the specific contents or supplementary materials provided to ascertain if additional resources or data are available.
14. How can I stay updated on further developments or reports in the Dry Chilies Industry?
To stay informed about further developments, trends, and reports in the Dry Chilies Industry, consider subscribing to industry newsletters, following relevant companies and organizations, or regularly checking reputable industry news sources and publications.
Methodology
Step 1 - Identification of Relevant Samples Size from Population Database


Step 2 - Approaches for Defining Global Market Size (Value, Volume* & Price*)

Note*: In applicable scenarios
Step 3 - Data Sources
Primary Research
- Web Analytics
- Survey Reports
- Research Institute
- Latest Research Reports
- Opinion Leaders
Secondary Research
- Annual Reports
- White Paper
- Latest Press Release
- Industry Association
- Paid Database
- Investor Presentations

Step 4 - Data Triangulation
Involves using different sources of information in order to increase the validity of a study
These sources are likely to be stakeholders in a program - participants, other researchers, program staff, other community members, and so on.
Then we put all data in single framework & apply various statistical tools to find out the dynamic on the market.
During the analysis stage, feedback from the stakeholder groups would be compared to determine areas of agreement as well as areas of divergence


