

Key Insights
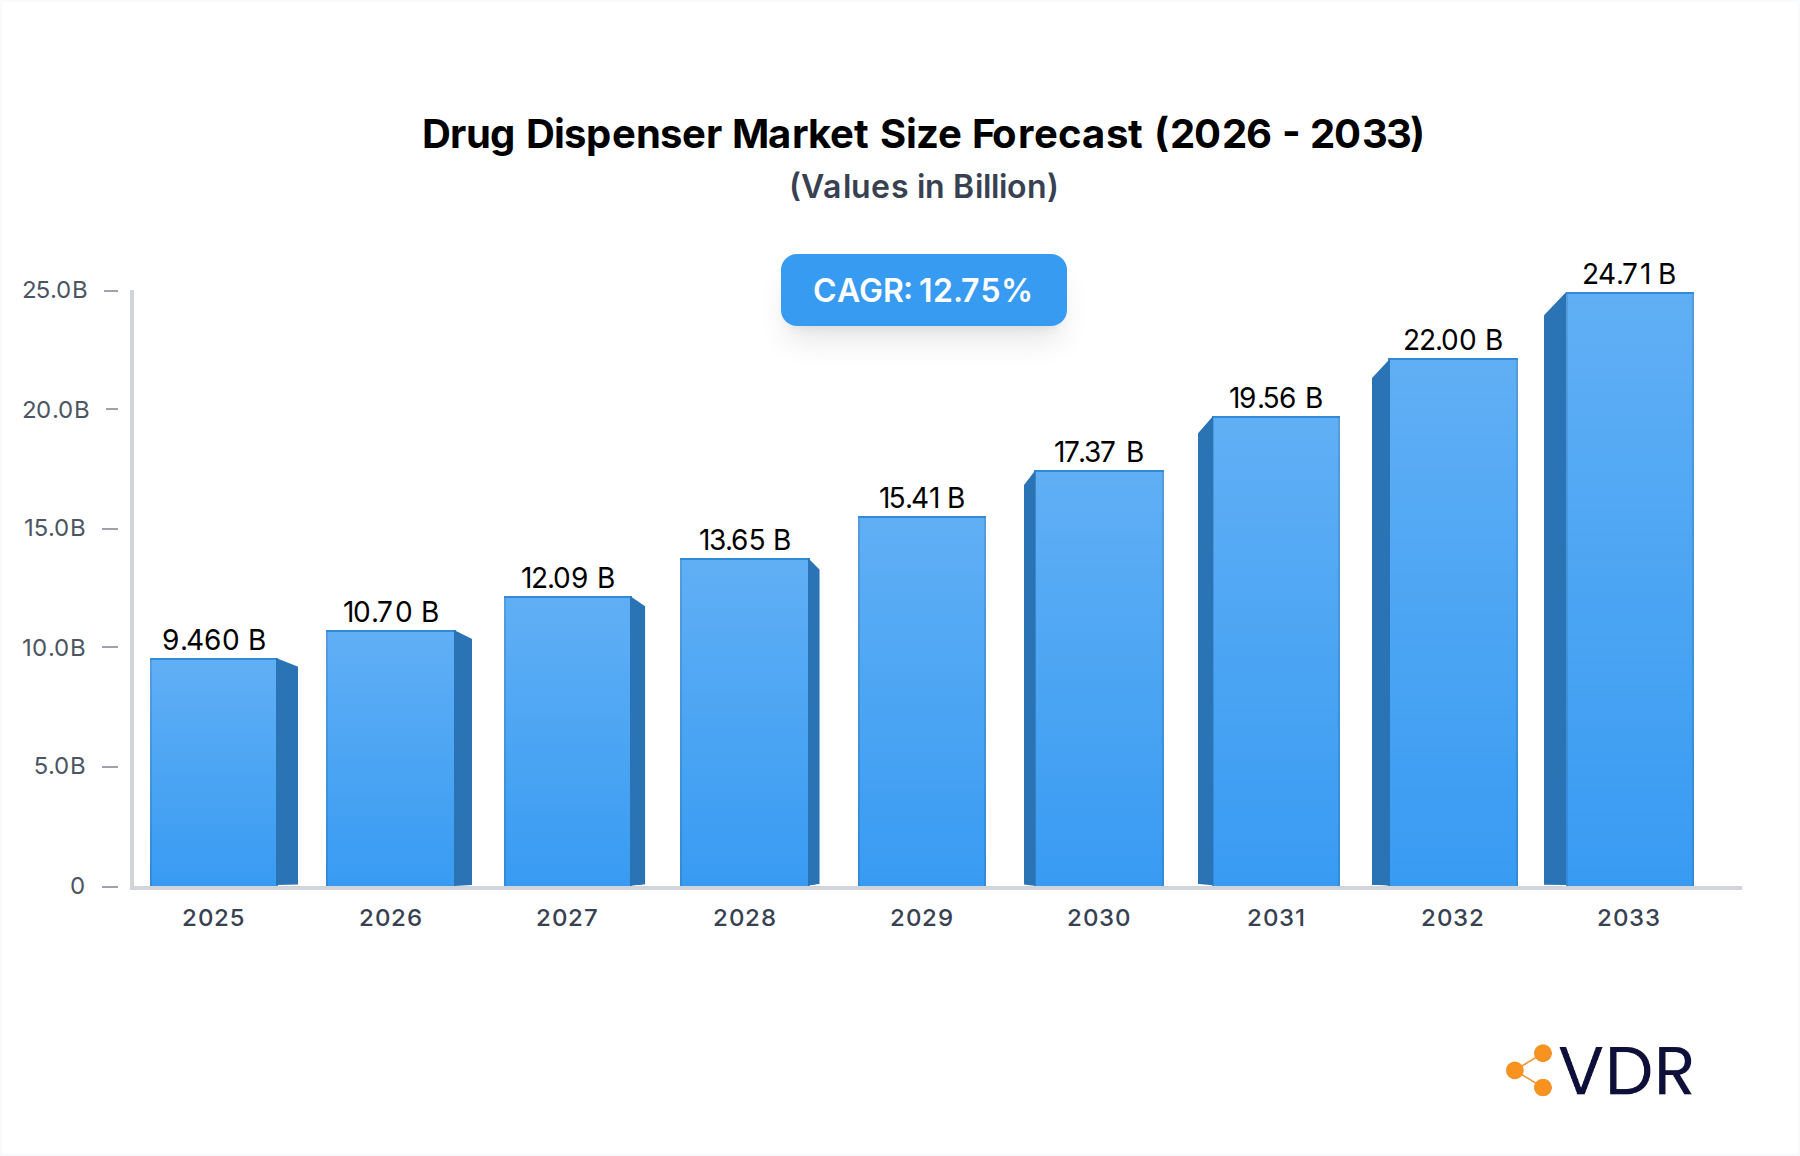
The global drug dispenser market is poised for substantial growth, projected to reach USD 9.46 billion in 2025 and expand at a robust CAGR of 13.15% through 2033. This upward trajectory is primarily driven by an increasing prevalence of chronic diseases, a growing aging population with a higher demand for medication adherence solutions, and advancements in smart drug dispensing technology. The integration of electronic components and the development of user-friendly interfaces are transforming plastic and electronic drug dispensers into essential tools for improved healthcare management, particularly in hospital and clinic settings where efficiency and patient safety are paramount. The rising awareness among patients and healthcare providers regarding the benefits of automated dispensing, such as reducing medication errors and optimizing treatment outcomes, further fuels market expansion.

Drug Dispenser Market Size (In Billion)
Key market drivers include the persistent need for enhanced medication adherence, especially among elderly individuals and those managing multiple prescriptions. Technological innovations, including the incorporation of IoT capabilities for remote monitoring and personalized dosage reminders, are creating new avenues for growth. While the market benefits from these positive trends, potential restraints such as high initial investment costs for advanced systems and challenges in widespread adoption in less developed regions may present some hurdles. However, the overwhelming advantages in terms of patient care, reduced healthcare burdens, and improved health outcomes are expected to outweigh these challenges, leading to sustained and significant market expansion across various applications and geographical regions.
Drug Dispenser Company Market Share
Comprehensive Report: Drug Dispenser Market Insights & Future Outlook (2019-2033)
This in-depth report provides a strategic analysis of the global Drug Dispenser market, encompassing its current dynamics, historical performance, and future trajectory. Leveraging advanced analytical tools and extensive industry data, this report offers critical insights for stakeholders seeking to understand market penetration, technological advancements, regulatory landscapes, and competitive strategies. With a forecast period extending to 2033, this research is indispensable for decision-making in the evolving healthcare and pharmaceutical sectors.
Drug Dispenser Market Dynamics & Structure
The global Drug Dispenser market is characterized by a moderate level of concentration, with a mix of established players and emerging innovators. Technological innovation is a primary driver, fueled by the increasing demand for automated medication management solutions to enhance patient adherence and reduce errors. Regulatory frameworks, particularly concerning patient safety and data privacy for connected devices, are shaping product development and market entry strategies. Competitive product substitutes include manual pill organizers and less sophisticated automated systems. End-user demographics are diverse, spanning elderly individuals, patients with chronic conditions, and institutional healthcare settings. Mergers and Acquisitions (M&A) trends are observed as companies seek to expand their product portfolios, technological capabilities, and geographical reach. The market is witnessing strategic acquisitions aimed at integrating smart technologies and expanding into emerging economies.
- Market Concentration: Moderate, with key players holding significant shares, but ample room for specialized and innovative entrants.
- Technological Innovation Drivers: Increased focus on user-friendly interfaces, connectivity (IoT), AI-driven adherence monitoring, and integration with telehealth platforms.
- Regulatory Frameworks: Emphasis on medical device certifications (e.g., FDA, CE marking), data security standards (e.g., HIPAA), and guidelines for assistive technologies for the elderly.
- Competitive Product Substitutes: Traditional pill boxes, reminder apps, and in-home caregiver services.
- End-User Demographics: Aging populations, individuals with polypharmacy, caregivers, hospitals, and long-term care facilities.
- M&A Trends: Driven by the desire for comprehensive solution offerings and market expansion, with a notable increase in deals involving companies with strong software and AI capabilities. The M&A deal volume is projected to increase by 15% in the next two years.
Drug Dispenser Growth Trends & Insights
The global Drug Dispenser market is poised for substantial growth, driven by an escalating global demand for enhanced medication management solutions. The market size, estimated at approximately \$5.8 billion in 2025, is projected to witness a Compound Annual Growth Rate (CAGR) of 7.2% during the forecast period of 2025–2033. This expansion is fueled by the increasing prevalence of chronic diseases, a growing aging population, and a heightened awareness of the importance of medication adherence in achieving better patient outcomes. Technological disruptions, such as the integration of Internet of Things (IoT) capabilities and artificial intelligence, are revolutionizing the functionality of drug dispensers, enabling remote monitoring and personalized adherence support. Consumer behavior is shifting towards proactive health management, with individuals and their families increasingly seeking convenient and reliable tools to manage complex medication regimens.
The adoption rates of both plastic and electronic drug dispensers are on an upward trajectory. While plastic dispensers continue to cater to basic organizational needs, the market penetration of electronic and smart drug dispensers is rapidly accelerating. This surge is attributed to their advanced features, including automated dispensing, dose reminders, refill alerts, and connectivity to caregiver or healthcare provider portals. The market penetration of electronic drug dispensers, which stood at around 35% in 2024, is forecasted to reach over 55% by 2033.
Key growth insights include the substantial impact of home healthcare trends, where drug dispensers play a crucial role in enabling patients to manage their medications independently, thereby reducing hospital readmissions. Furthermore, the growing focus on personalized medicine and precision dosing further elevates the demand for accurate and automated dispensing systems. The market penetration in developed economies is significantly higher, but emerging economies present a substantial untapped opportunity due to improving healthcare infrastructure and increasing disposable incomes. The overall market volume is expected to grow from approximately 75 million units in 2025 to over 130 million units by 2033, reflecting a robust expansion driven by innovation and market acceptance.
Dominant Regions, Countries, or Segments in Drug Dispenser
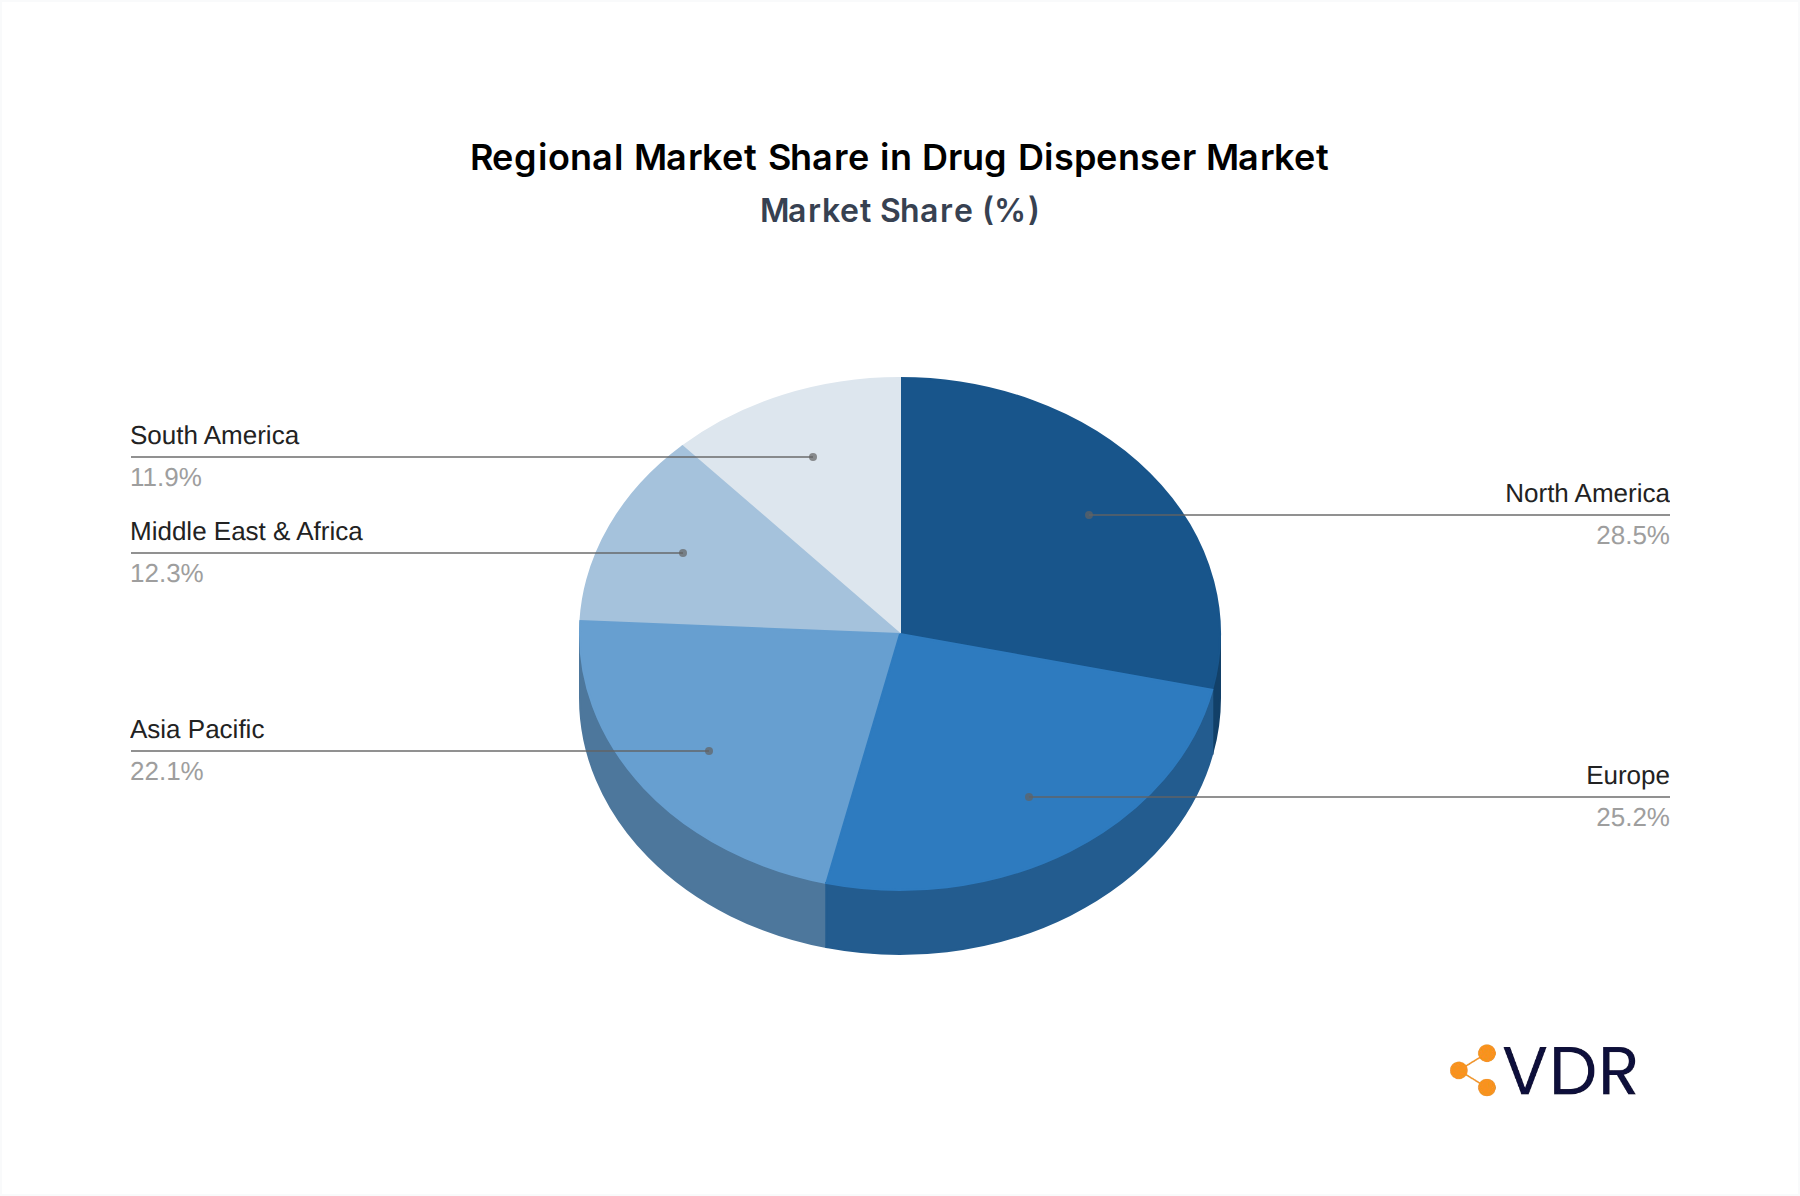
The global Drug Dispenser market's dominance is largely dictated by a confluence of demographic, economic, and technological factors, with North America emerging as the leading region. This supremacy is underpinned by a robust healthcare infrastructure, high disposable incomes, a significant aging population, and an early and widespread adoption of advanced medical technologies. The United States, in particular, plays a pivotal role, driven by government initiatives promoting home healthcare and patient adherence, alongside a strong presence of key market players and continuous technological innovation.
Within the Application segment, the Other category, encompassing home healthcare settings and assisted living facilities, is exhibiting the most dynamic growth. This is directly correlated with the global trend of de-institutionalization of care and the increasing preference for managing chronic conditions at home. Hospitals and clinics, while significant consumers, are witnessing steady but less explosive growth compared to the burgeoning home-use segment. The demand in institutional settings is driven by efficiency gains and patient safety protocols.
In terms of Types, Electronic drug dispensers are the primary growth engine. Their advanced features, such as programmable reminders, dose verification, and connectivity, align perfectly with the rising demand for smart healthcare solutions. While plastic dispensers remain relevant for basic organization and cost-sensitive markets, the technological sophistication and enhanced patient outcomes offered by electronic variants are driving their market share expansion. The market share of electronic drug dispensers is projected to grow from 60% in 2025 to over 75% by 2033.
Key drivers of dominance in North America include:
- Economic Policies: Favorable reimbursement policies for home-based care technologies and a strong emphasis on preventative healthcare.
- Infrastructure: Well-established healthcare networks and advanced technological adoption across the population.
- Demographics: A substantial and growing elderly population requiring robust medication management solutions.
- Market Penetration: High adoption rates of electronic and smart drug dispensers due to consumer awareness and trust in technology.
The market share for North America is estimated at 38% in 2025, with a projected growth to 42% by 2033. Europe follows as a significant market, driven by similar demographic trends and increasing healthcare expenditure. Asia Pacific is the fastest-growing region, propelled by improving healthcare access, rising disposable incomes, and a large population base, especially in countries like China and India. The growth potential in emerging markets within Asia Pacific and Latin America is substantial, driven by increasing awareness and the affordability of basic electronic dispensing solutions.
Drug Dispenser Product Landscape
The drug dispenser product landscape is rapidly evolving, characterized by innovative advancements in both plastic and electronic categories. Plastic dispensers are increasingly incorporating user-friendly designs, larger capacities, and improved portability for everyday convenience. Electronic drug dispensers are at the forefront of technological innovation, featuring smart capabilities such as Wi-Fi and Bluetooth connectivity, allowing for remote monitoring by caregivers and healthcare professionals. Unique selling propositions include automated dispensing schedules, tamper-proof designs, and integration with mobile applications for personalized reminders and adherence tracking. Performance metrics are increasingly focused on accuracy, reliability, ease of use, and data security. Advancements like AI-powered dose optimization and predictive refill alerts are enhancing their value proposition.
Key Drivers, Barriers & Challenges in Drug Dispenser
Key Drivers:
- Aging Global Population: A demographic imperative driving demand for assisted medication management.
- Rising Chronic Disease Prevalence: Increasing need for accurate and consistent medication adherence.
- Technological Advancements: Integration of IoT, AI, and connectivity for enhanced functionality and remote monitoring.
- Focus on Patient Adherence: Growing recognition of adherence as a critical factor in treatment efficacy and healthcare cost reduction.
- Government Initiatives & Healthcare Reforms: Support for home healthcare and digital health solutions.
Barriers & Challenges:
- High Cost of Advanced Devices: The initial investment for sophisticated electronic dispensers can be a barrier for some segments.
- Regulatory Hurdles: Navigating complex medical device certifications and data privacy regulations can be time-consuming and costly.
- User Adoption & Digital Literacy: Resistance to new technology or lack of digital literacy among certain user groups, particularly the elderly.
- Competition from Substitutes: Availability of low-cost manual organizers and reminder apps.
- Supply Chain Disruptions: Global events impacting the availability and cost of components, particularly for electronic devices. The impact of supply chain disruptions on production costs is estimated to be around 8-10% in the current year.
Emerging Opportunities in Drug Dispenser
Emerging opportunities in the drug dispenser market lie in the development of highly personalized and integrated medication management systems. This includes AI-driven platforms that analyze patient data to optimize dosing schedules and provide proactive alerts for potential drug interactions. Untapped markets in developing economies offer significant potential as healthcare infrastructure improves and digital literacy rises. Innovative applications are emerging in specialized patient groups, such as pediatric medication management and psychiatric care, where adherence is particularly critical. Evolving consumer preferences are leaning towards aesthetically pleasing, discreet, and smart devices that seamlessly integrate into daily life. The development of dispensers with built-in diagnostics and connectivity to wearable health trackers presents a promising avenue for comprehensive health monitoring.
Growth Accelerators in the Drug Dispenser Industry
Growth accelerators in the drug dispenser industry are multifaceted, driven by continuous technological breakthroughs and strategic market expansion. The development of miniaturized, portable, and highly accurate dispensing mechanisms is enabling wider application and user acceptance. Strategic partnerships between technology companies, pharmaceutical firms, and healthcare providers are crucial for creating integrated ecosystems that enhance patient care pathways and data interoperability. Market expansion strategies, particularly targeting emerging economies with rapidly growing healthcare sectors and increasing disposable incomes, are key to long-term growth. The increasing adoption of telehealth and remote patient monitoring further amplifies the demand for connected drug dispensers that facilitate secure and efficient medication management outside traditional clinical settings.
Key Players Shaping the Drug Dispenser Market
- Capsa Healthcare
- MedMinder
- Bioland
- Hero Health, Inc
- Philips
- Black and Decker (Pria)
- PharmAdva (MedaCube)
- Stevanato
- LiveFine
- Lepu Medical
- TabTimer
- Pharmacell Medication Systems Ltd
- Ningbo Easyget Co.,Ltd.
- Suzhou Sunmed Co.,Ltd.
- Saferlife Products Co.,Ltd
Notable Milestones in Drug Dispenser Sector
- 2019: Introduction of AI-powered adherence tracking features in smart dispensers.
- 2020: Increased demand for home-based medication management solutions due to the global pandemic.
- 2021: Launch of cloud-connected drug dispensers enabling remote monitoring for caregivers.
- 2022: Significant investments in R&D for advanced security and privacy features in connected devices.
- 2023: Expansion of partnerships between drug dispenser manufacturers and telehealth platforms.
- 2024: Focus on developing multi-drug dispensing capabilities and personalized dosage adjustments.
In-Depth Drug Dispenser Market Outlook
The future of the drug dispenser market is exceptionally bright, propelled by a robust interplay of demographic trends, technological innovation, and a persistent global focus on improving patient outcomes. Growth accelerators such as the continued integration of AI for personalized medication management, the expansion of smart home healthcare ecosystems, and the increasing penetration in emerging markets will solidify the market's upward trajectory. Strategic opportunities lie in developing cost-effective, feature-rich electronic dispensers tailored for diverse populations and expanding into novel therapeutic areas requiring specialized dispensing solutions. The market is projected to exceed \$12 billion in revenue by 2033, driven by an insatiable demand for reliable, efficient, and technologically advanced medication adherence tools.
Drug Dispenser Segmentation
-
1. Application
- 1.1. Hospital
- 1.2. Clinic
- 1.3. Other
-
2. Types
- 2.1. Plastic
- 2.2. Electronic
Drug Dispenser Segmentation By Geography
-
1. North America
- 1.1. United States
- 1.2. Canada
- 1.3. Mexico
-
2. South America
- 2.1. Brazil
- 2.2. Argentina
- 2.3. Rest of South America
-
3. Europe
- 3.1. United Kingdom
- 3.2. Germany
- 3.3. France
- 3.4. Italy
- 3.5. Spain
- 3.6. Russia
- 3.7. Benelux
- 3.8. Nordics
- 3.9. Rest of Europe
-
4. Middle East & Africa
- 4.1. Turkey
- 4.2. Israel
- 4.3. GCC
- 4.4. North Africa
- 4.5. South Africa
- 4.6. Rest of Middle East & Africa
-
5. Asia Pacific
- 5.1. China
- 5.2. India
- 5.3. Japan
- 5.4. South Korea
- 5.5. ASEAN
- 5.6. Oceania
- 5.7. Rest of Asia Pacific
Drug Dispenser Regional Market Share
Geographic Coverage of Drug Dispenser
Drug Dispenser REPORT HIGHLIGHTS
| Aspects | Details |
|---|---|
| Study Period | 2020-2034 |
| Base Year | 2025 |
| Estimated Year | 2026 |
| Forecast Period | 2026-2034 |
| Historical Period | 2020-2025 |
| Growth Rate | CAGR of 13.15% from 2020-2034 |
| Segmentation |
|
Table of Contents
- 1. Introduction
- 1.1. Research Scope
- 1.2. Market Segmentation
- 1.3. Research Methodology
- 1.4. Definitions and Assumptions
- 2. Executive Summary
- 2.1. Introduction
- 3. Market Dynamics
- 3.1. Introduction
- 3.2. Market Drivers
- 3.3. Market Restrains
- 3.4. Market Trends
- 4. Market Factor Analysis
- 4.1. Porters Five Forces
- 4.2. Supply/Value Chain
- 4.3. PESTEL analysis
- 4.4. Market Entropy
- 4.5. Patent/Trademark Analysis
- 5. Global Drug Dispenser Analysis, Insights and Forecast, 2020-2032
- 5.1. Market Analysis, Insights and Forecast - by Application
- 5.1.1. Hospital
- 5.1.2. Clinic
- 5.1.3. Other
- 5.2. Market Analysis, Insights and Forecast - by Types
- 5.2.1. Plastic
- 5.2.2. Electronic
- 5.3. Market Analysis, Insights and Forecast - by Region
- 5.3.1. North America
- 5.3.2. South America
- 5.3.3. Europe
- 5.3.4. Middle East & Africa
- 5.3.5. Asia Pacific
- 5.1. Market Analysis, Insights and Forecast - by Application
- 6. North America Drug Dispenser Analysis, Insights and Forecast, 2020-2032
- 6.1. Market Analysis, Insights and Forecast - by Application
- 6.1.1. Hospital
- 6.1.2. Clinic
- 6.1.3. Other
- 6.2. Market Analysis, Insights and Forecast - by Types
- 6.2.1. Plastic
- 6.2.2. Electronic
- 6.1. Market Analysis, Insights and Forecast - by Application
- 7. South America Drug Dispenser Analysis, Insights and Forecast, 2020-2032
- 7.1. Market Analysis, Insights and Forecast - by Application
- 7.1.1. Hospital
- 7.1.2. Clinic
- 7.1.3. Other
- 7.2. Market Analysis, Insights and Forecast - by Types
- 7.2.1. Plastic
- 7.2.2. Electronic
- 7.1. Market Analysis, Insights and Forecast - by Application
- 8. Europe Drug Dispenser Analysis, Insights and Forecast, 2020-2032
- 8.1. Market Analysis, Insights and Forecast - by Application
- 8.1.1. Hospital
- 8.1.2. Clinic
- 8.1.3. Other
- 8.2. Market Analysis, Insights and Forecast - by Types
- 8.2.1. Plastic
- 8.2.2. Electronic
- 8.1. Market Analysis, Insights and Forecast - by Application
- 9. Middle East & Africa Drug Dispenser Analysis, Insights and Forecast, 2020-2032
- 9.1. Market Analysis, Insights and Forecast - by Application
- 9.1.1. Hospital
- 9.1.2. Clinic
- 9.1.3. Other
- 9.2. Market Analysis, Insights and Forecast - by Types
- 9.2.1. Plastic
- 9.2.2. Electronic
- 9.1. Market Analysis, Insights and Forecast - by Application
- 10. Asia Pacific Drug Dispenser Analysis, Insights and Forecast, 2020-2032
- 10.1. Market Analysis, Insights and Forecast - by Application
- 10.1.1. Hospital
- 10.1.2. Clinic
- 10.1.3. Other
- 10.2. Market Analysis, Insights and Forecast - by Types
- 10.2.1. Plastic
- 10.2.2. Electronic
- 10.1. Market Analysis, Insights and Forecast - by Application
- 11. Competitive Analysis
- 11.1. Global Market Share Analysis 2025
- 11.2. Company Profiles
- 11.2.1 Capsa Healthcare
- 11.2.1.1. Overview
- 11.2.1.2. Products
- 11.2.1.3. SWOT Analysis
- 11.2.1.4. Recent Developments
- 11.2.1.5. Financials (Based on Availability)
- 11.2.2 MedMinder
- 11.2.2.1. Overview
- 11.2.2.2. Products
- 11.2.2.3. SWOT Analysis
- 11.2.2.4. Recent Developments
- 11.2.2.5. Financials (Based on Availability)
- 11.2.3 Bioland
- 11.2.3.1. Overview
- 11.2.3.2. Products
- 11.2.3.3. SWOT Analysis
- 11.2.3.4. Recent Developments
- 11.2.3.5. Financials (Based on Availability)
- 11.2.4 Hero Health
- 11.2.4.1. Overview
- 11.2.4.2. Products
- 11.2.4.3. SWOT Analysis
- 11.2.4.4. Recent Developments
- 11.2.4.5. Financials (Based on Availability)
- 11.2.5 Inc
- 11.2.5.1. Overview
- 11.2.5.2. Products
- 11.2.5.3. SWOT Analysis
- 11.2.5.4. Recent Developments
- 11.2.5.5. Financials (Based on Availability)
- 11.2.6 Philips
- 11.2.6.1. Overview
- 11.2.6.2. Products
- 11.2.6.3. SWOT Analysis
- 11.2.6.4. Recent Developments
- 11.2.6.5. Financials (Based on Availability)
- 11.2.7 Black and Decker(Pria)
- 11.2.7.1. Overview
- 11.2.7.2. Products
- 11.2.7.3. SWOT Analysis
- 11.2.7.4. Recent Developments
- 11.2.7.5. Financials (Based on Availability)
- 11.2.8 PharmAdva(MedaCube)
- 11.2.8.1. Overview
- 11.2.8.2. Products
- 11.2.8.3. SWOT Analysis
- 11.2.8.4. Recent Developments
- 11.2.8.5. Financials (Based on Availability)
- 11.2.9 Stevanato
- 11.2.9.1. Overview
- 11.2.9.2. Products
- 11.2.9.3. SWOT Analysis
- 11.2.9.4. Recent Developments
- 11.2.9.5. Financials (Based on Availability)
- 11.2.10 LiveFine
- 11.2.10.1. Overview
- 11.2.10.2. Products
- 11.2.10.3. SWOT Analysis
- 11.2.10.4. Recent Developments
- 11.2.10.5. Financials (Based on Availability)
- 11.2.11 Lepu Medical
- 11.2.11.1. Overview
- 11.2.11.2. Products
- 11.2.11.3. SWOT Analysis
- 11.2.11.4. Recent Developments
- 11.2.11.5. Financials (Based on Availability)
- 11.2.12 TabTimer
- 11.2.12.1. Overview
- 11.2.12.2. Products
- 11.2.12.3. SWOT Analysis
- 11.2.12.4. Recent Developments
- 11.2.12.5. Financials (Based on Availability)
- 11.2.13 Pharmacell Medication Systems Ltd
- 11.2.13.1. Overview
- 11.2.13.2. Products
- 11.2.13.3. SWOT Analysis
- 11.2.13.4. Recent Developments
- 11.2.13.5. Financials (Based on Availability)
- 11.2.14 Ningbo Easyget Co.
- 11.2.14.1. Overview
- 11.2.14.2. Products
- 11.2.14.3. SWOT Analysis
- 11.2.14.4. Recent Developments
- 11.2.14.5. Financials (Based on Availability)
- 11.2.15 Ltd.
- 11.2.15.1. Overview
- 11.2.15.2. Products
- 11.2.15.3. SWOT Analysis
- 11.2.15.4. Recent Developments
- 11.2.15.5. Financials (Based on Availability)
- 11.2.16 Suzhou Sunmed Co.
- 11.2.16.1. Overview
- 11.2.16.2. Products
- 11.2.16.3. SWOT Analysis
- 11.2.16.4. Recent Developments
- 11.2.16.5. Financials (Based on Availability)
- 11.2.17 Ltd.
- 11.2.17.1. Overview
- 11.2.17.2. Products
- 11.2.17.3. SWOT Analysis
- 11.2.17.4. Recent Developments
- 11.2.17.5. Financials (Based on Availability)
- 11.2.18 Saferlife Products Co.
- 11.2.18.1. Overview
- 11.2.18.2. Products
- 11.2.18.3. SWOT Analysis
- 11.2.18.4. Recent Developments
- 11.2.18.5. Financials (Based on Availability)
- 11.2.19 Ltd
- 11.2.19.1. Overview
- 11.2.19.2. Products
- 11.2.19.3. SWOT Analysis
- 11.2.19.4. Recent Developments
- 11.2.19.5. Financials (Based on Availability)
- 11.2.1 Capsa Healthcare
List of Figures
- Figure 1: Global Drug Dispenser Revenue Breakdown (undefined, %) by Region 2025 & 2033
- Figure 2: Global Drug Dispenser Volume Breakdown (K, %) by Region 2025 & 2033
- Figure 3: North America Drug Dispenser Revenue (undefined), by Application 2025 & 2033
- Figure 4: North America Drug Dispenser Volume (K), by Application 2025 & 2033
- Figure 5: North America Drug Dispenser Revenue Share (%), by Application 2025 & 2033
- Figure 6: North America Drug Dispenser Volume Share (%), by Application 2025 & 2033
- Figure 7: North America Drug Dispenser Revenue (undefined), by Types 2025 & 2033
- Figure 8: North America Drug Dispenser Volume (K), by Types 2025 & 2033
- Figure 9: North America Drug Dispenser Revenue Share (%), by Types 2025 & 2033
- Figure 10: North America Drug Dispenser Volume Share (%), by Types 2025 & 2033
- Figure 11: North America Drug Dispenser Revenue (undefined), by Country 2025 & 2033
- Figure 12: North America Drug Dispenser Volume (K), by Country 2025 & 2033
- Figure 13: North America Drug Dispenser Revenue Share (%), by Country 2025 & 2033
- Figure 14: North America Drug Dispenser Volume Share (%), by Country 2025 & 2033
- Figure 15: South America Drug Dispenser Revenue (undefined), by Application 2025 & 2033
- Figure 16: South America Drug Dispenser Volume (K), by Application 2025 & 2033
- Figure 17: South America Drug Dispenser Revenue Share (%), by Application 2025 & 2033
- Figure 18: South America Drug Dispenser Volume Share (%), by Application 2025 & 2033
- Figure 19: South America Drug Dispenser Revenue (undefined), by Types 2025 & 2033
- Figure 20: South America Drug Dispenser Volume (K), by Types 2025 & 2033
- Figure 21: South America Drug Dispenser Revenue Share (%), by Types 2025 & 2033
- Figure 22: South America Drug Dispenser Volume Share (%), by Types 2025 & 2033
- Figure 23: South America Drug Dispenser Revenue (undefined), by Country 2025 & 2033
- Figure 24: South America Drug Dispenser Volume (K), by Country 2025 & 2033
- Figure 25: South America Drug Dispenser Revenue Share (%), by Country 2025 & 2033
- Figure 26: South America Drug Dispenser Volume Share (%), by Country 2025 & 2033
- Figure 27: Europe Drug Dispenser Revenue (undefined), by Application 2025 & 2033
- Figure 28: Europe Drug Dispenser Volume (K), by Application 2025 & 2033
- Figure 29: Europe Drug Dispenser Revenue Share (%), by Application 2025 & 2033
- Figure 30: Europe Drug Dispenser Volume Share (%), by Application 2025 & 2033
- Figure 31: Europe Drug Dispenser Revenue (undefined), by Types 2025 & 2033
- Figure 32: Europe Drug Dispenser Volume (K), by Types 2025 & 2033
- Figure 33: Europe Drug Dispenser Revenue Share (%), by Types 2025 & 2033
- Figure 34: Europe Drug Dispenser Volume Share (%), by Types 2025 & 2033
- Figure 35: Europe Drug Dispenser Revenue (undefined), by Country 2025 & 2033
- Figure 36: Europe Drug Dispenser Volume (K), by Country 2025 & 2033
- Figure 37: Europe Drug Dispenser Revenue Share (%), by Country 2025 & 2033
- Figure 38: Europe Drug Dispenser Volume Share (%), by Country 2025 & 2033
- Figure 39: Middle East & Africa Drug Dispenser Revenue (undefined), by Application 2025 & 2033
- Figure 40: Middle East & Africa Drug Dispenser Volume (K), by Application 2025 & 2033
- Figure 41: Middle East & Africa Drug Dispenser Revenue Share (%), by Application 2025 & 2033
- Figure 42: Middle East & Africa Drug Dispenser Volume Share (%), by Application 2025 & 2033
- Figure 43: Middle East & Africa Drug Dispenser Revenue (undefined), by Types 2025 & 2033
- Figure 44: Middle East & Africa Drug Dispenser Volume (K), by Types 2025 & 2033
- Figure 45: Middle East & Africa Drug Dispenser Revenue Share (%), by Types 2025 & 2033
- Figure 46: Middle East & Africa Drug Dispenser Volume Share (%), by Types 2025 & 2033
- Figure 47: Middle East & Africa Drug Dispenser Revenue (undefined), by Country 2025 & 2033
- Figure 48: Middle East & Africa Drug Dispenser Volume (K), by Country 2025 & 2033
- Figure 49: Middle East & Africa Drug Dispenser Revenue Share (%), by Country 2025 & 2033
- Figure 50: Middle East & Africa Drug Dispenser Volume Share (%), by Country 2025 & 2033
- Figure 51: Asia Pacific Drug Dispenser Revenue (undefined), by Application 2025 & 2033
- Figure 52: Asia Pacific Drug Dispenser Volume (K), by Application 2025 & 2033
- Figure 53: Asia Pacific Drug Dispenser Revenue Share (%), by Application 2025 & 2033
- Figure 54: Asia Pacific Drug Dispenser Volume Share (%), by Application 2025 & 2033
- Figure 55: Asia Pacific Drug Dispenser Revenue (undefined), by Types 2025 & 2033
- Figure 56: Asia Pacific Drug Dispenser Volume (K), by Types 2025 & 2033
- Figure 57: Asia Pacific Drug Dispenser Revenue Share (%), by Types 2025 & 2033
- Figure 58: Asia Pacific Drug Dispenser Volume Share (%), by Types 2025 & 2033
- Figure 59: Asia Pacific Drug Dispenser Revenue (undefined), by Country 2025 & 2033
- Figure 60: Asia Pacific Drug Dispenser Volume (K), by Country 2025 & 2033
- Figure 61: Asia Pacific Drug Dispenser Revenue Share (%), by Country 2025 & 2033
- Figure 62: Asia Pacific Drug Dispenser Volume Share (%), by Country 2025 & 2033
List of Tables
- Table 1: Global Drug Dispenser Revenue undefined Forecast, by Application 2020 & 2033
- Table 2: Global Drug Dispenser Volume K Forecast, by Application 2020 & 2033
- Table 3: Global Drug Dispenser Revenue undefined Forecast, by Types 2020 & 2033
- Table 4: Global Drug Dispenser Volume K Forecast, by Types 2020 & 2033
- Table 5: Global Drug Dispenser Revenue undefined Forecast, by Region 2020 & 2033
- Table 6: Global Drug Dispenser Volume K Forecast, by Region 2020 & 2033
- Table 7: Global Drug Dispenser Revenue undefined Forecast, by Application 2020 & 2033
- Table 8: Global Drug Dispenser Volume K Forecast, by Application 2020 & 2033
- Table 9: Global Drug Dispenser Revenue undefined Forecast, by Types 2020 & 2033
- Table 10: Global Drug Dispenser Volume K Forecast, by Types 2020 & 2033
- Table 11: Global Drug Dispenser Revenue undefined Forecast, by Country 2020 & 2033
- Table 12: Global Drug Dispenser Volume K Forecast, by Country 2020 & 2033
- Table 13: United States Drug Dispenser Revenue (undefined) Forecast, by Application 2020 & 2033
- Table 14: United States Drug Dispenser Volume (K) Forecast, by Application 2020 & 2033
- Table 15: Canada Drug Dispenser Revenue (undefined) Forecast, by Application 2020 & 2033
- Table 16: Canada Drug Dispenser Volume (K) Forecast, by Application 2020 & 2033
- Table 17: Mexico Drug Dispenser Revenue (undefined) Forecast, by Application 2020 & 2033
- Table 18: Mexico Drug Dispenser Volume (K) Forecast, by Application 2020 & 2033
- Table 19: Global Drug Dispenser Revenue undefined Forecast, by Application 2020 & 2033
- Table 20: Global Drug Dispenser Volume K Forecast, by Application 2020 & 2033
- Table 21: Global Drug Dispenser Revenue undefined Forecast, by Types 2020 & 2033
- Table 22: Global Drug Dispenser Volume K Forecast, by Types 2020 & 2033
- Table 23: Global Drug Dispenser Revenue undefined Forecast, by Country 2020 & 2033
- Table 24: Global Drug Dispenser Volume K Forecast, by Country 2020 & 2033
- Table 25: Brazil Drug Dispenser Revenue (undefined) Forecast, by Application 2020 & 2033
- Table 26: Brazil Drug Dispenser Volume (K) Forecast, by Application 2020 & 2033
- Table 27: Argentina Drug Dispenser Revenue (undefined) Forecast, by Application 2020 & 2033
- Table 28: Argentina Drug Dispenser Volume (K) Forecast, by Application 2020 & 2033
- Table 29: Rest of South America Drug Dispenser Revenue (undefined) Forecast, by Application 2020 & 2033
- Table 30: Rest of South America Drug Dispenser Volume (K) Forecast, by Application 2020 & 2033
- Table 31: Global Drug Dispenser Revenue undefined Forecast, by Application 2020 & 2033
- Table 32: Global Drug Dispenser Volume K Forecast, by Application 2020 & 2033
- Table 33: Global Drug Dispenser Revenue undefined Forecast, by Types 2020 & 2033
- Table 34: Global Drug Dispenser Volume K Forecast, by Types 2020 & 2033
- Table 35: Global Drug Dispenser Revenue undefined Forecast, by Country 2020 & 2033
- Table 36: Global Drug Dispenser Volume K Forecast, by Country 2020 & 2033
- Table 37: United Kingdom Drug Dispenser Revenue (undefined) Forecast, by Application 2020 & 2033
- Table 38: United Kingdom Drug Dispenser Volume (K) Forecast, by Application 2020 & 2033
- Table 39: Germany Drug Dispenser Revenue (undefined) Forecast, by Application 2020 & 2033
- Table 40: Germany Drug Dispenser Volume (K) Forecast, by Application 2020 & 2033
- Table 41: France Drug Dispenser Revenue (undefined) Forecast, by Application 2020 & 2033
- Table 42: France Drug Dispenser Volume (K) Forecast, by Application 2020 & 2033
- Table 43: Italy Drug Dispenser Revenue (undefined) Forecast, by Application 2020 & 2033
- Table 44: Italy Drug Dispenser Volume (K) Forecast, by Application 2020 & 2033
- Table 45: Spain Drug Dispenser Revenue (undefined) Forecast, by Application 2020 & 2033
- Table 46: Spain Drug Dispenser Volume (K) Forecast, by Application 2020 & 2033
- Table 47: Russia Drug Dispenser Revenue (undefined) Forecast, by Application 2020 & 2033
- Table 48: Russia Drug Dispenser Volume (K) Forecast, by Application 2020 & 2033
- Table 49: Benelux Drug Dispenser Revenue (undefined) Forecast, by Application 2020 & 2033
- Table 50: Benelux Drug Dispenser Volume (K) Forecast, by Application 2020 & 2033
- Table 51: Nordics Drug Dispenser Revenue (undefined) Forecast, by Application 2020 & 2033
- Table 52: Nordics Drug Dispenser Volume (K) Forecast, by Application 2020 & 2033
- Table 53: Rest of Europe Drug Dispenser Revenue (undefined) Forecast, by Application 2020 & 2033
- Table 54: Rest of Europe Drug Dispenser Volume (K) Forecast, by Application 2020 & 2033
- Table 55: Global Drug Dispenser Revenue undefined Forecast, by Application 2020 & 2033
- Table 56: Global Drug Dispenser Volume K Forecast, by Application 2020 & 2033
- Table 57: Global Drug Dispenser Revenue undefined Forecast, by Types 2020 & 2033
- Table 58: Global Drug Dispenser Volume K Forecast, by Types 2020 & 2033
- Table 59: Global Drug Dispenser Revenue undefined Forecast, by Country 2020 & 2033
- Table 60: Global Drug Dispenser Volume K Forecast, by Country 2020 & 2033
- Table 61: Turkey Drug Dispenser Revenue (undefined) Forecast, by Application 2020 & 2033
- Table 62: Turkey Drug Dispenser Volume (K) Forecast, by Application 2020 & 2033
- Table 63: Israel Drug Dispenser Revenue (undefined) Forecast, by Application 2020 & 2033
- Table 64: Israel Drug Dispenser Volume (K) Forecast, by Application 2020 & 2033
- Table 65: GCC Drug Dispenser Revenue (undefined) Forecast, by Application 2020 & 2033
- Table 66: GCC Drug Dispenser Volume (K) Forecast, by Application 2020 & 2033
- Table 67: North Africa Drug Dispenser Revenue (undefined) Forecast, by Application 2020 & 2033
- Table 68: North Africa Drug Dispenser Volume (K) Forecast, by Application 2020 & 2033
- Table 69: South Africa Drug Dispenser Revenue (undefined) Forecast, by Application 2020 & 2033
- Table 70: South Africa Drug Dispenser Volume (K) Forecast, by Application 2020 & 2033
- Table 71: Rest of Middle East & Africa Drug Dispenser Revenue (undefined) Forecast, by Application 2020 & 2033
- Table 72: Rest of Middle East & Africa Drug Dispenser Volume (K) Forecast, by Application 2020 & 2033
- Table 73: Global Drug Dispenser Revenue undefined Forecast, by Application 2020 & 2033
- Table 74: Global Drug Dispenser Volume K Forecast, by Application 2020 & 2033
- Table 75: Global Drug Dispenser Revenue undefined Forecast, by Types 2020 & 2033
- Table 76: Global Drug Dispenser Volume K Forecast, by Types 2020 & 2033
- Table 77: Global Drug Dispenser Revenue undefined Forecast, by Country 2020 & 2033
- Table 78: Global Drug Dispenser Volume K Forecast, by Country 2020 & 2033
- Table 79: China Drug Dispenser Revenue (undefined) Forecast, by Application 2020 & 2033
- Table 80: China Drug Dispenser Volume (K) Forecast, by Application 2020 & 2033
- Table 81: India Drug Dispenser Revenue (undefined) Forecast, by Application 2020 & 2033
- Table 82: India Drug Dispenser Volume (K) Forecast, by Application 2020 & 2033
- Table 83: Japan Drug Dispenser Revenue (undefined) Forecast, by Application 2020 & 2033
- Table 84: Japan Drug Dispenser Volume (K) Forecast, by Application 2020 & 2033
- Table 85: South Korea Drug Dispenser Revenue (undefined) Forecast, by Application 2020 & 2033
- Table 86: South Korea Drug Dispenser Volume (K) Forecast, by Application 2020 & 2033
- Table 87: ASEAN Drug Dispenser Revenue (undefined) Forecast, by Application 2020 & 2033
- Table 88: ASEAN Drug Dispenser Volume (K) Forecast, by Application 2020 & 2033
- Table 89: Oceania Drug Dispenser Revenue (undefined) Forecast, by Application 2020 & 2033
- Table 90: Oceania Drug Dispenser Volume (K) Forecast, by Application 2020 & 2033
- Table 91: Rest of Asia Pacific Drug Dispenser Revenue (undefined) Forecast, by Application 2020 & 2033
- Table 92: Rest of Asia Pacific Drug Dispenser Volume (K) Forecast, by Application 2020 & 2033
Frequently Asked Questions
1. What is the projected Compound Annual Growth Rate (CAGR) of the Drug Dispenser?
The projected CAGR is approximately 13.15%.
2. Which companies are prominent players in the Drug Dispenser?
Key companies in the market include Capsa Healthcare, MedMinder, Bioland, Hero Health, Inc, Philips, Black and Decker(Pria), PharmAdva(MedaCube), Stevanato, LiveFine, Lepu Medical, TabTimer, Pharmacell Medication Systems Ltd, Ningbo Easyget Co., Ltd., Suzhou Sunmed Co., Ltd., Saferlife Products Co., Ltd.
3. What are the main segments of the Drug Dispenser?
The market segments include Application, Types.
4. Can you provide details about the market size?
The market size is estimated to be USD XXX N/A as of 2022.
5. What are some drivers contributing to market growth?
N/A
6. What are the notable trends driving market growth?
N/A
7. Are there any restraints impacting market growth?
N/A
8. Can you provide examples of recent developments in the market?
N/A
9. What pricing options are available for accessing the report?
Pricing options include single-user, multi-user, and enterprise licenses priced at USD 3350.00, USD 5025.00, and USD 6700.00 respectively.
10. Is the market size provided in terms of value or volume?
The market size is provided in terms of value, measured in N/A and volume, measured in K.
11. Are there any specific market keywords associated with the report?
Yes, the market keyword associated with the report is "Drug Dispenser," which aids in identifying and referencing the specific market segment covered.
12. How do I determine which pricing option suits my needs best?
The pricing options vary based on user requirements and access needs. Individual users may opt for single-user licenses, while businesses requiring broader access may choose multi-user or enterprise licenses for cost-effective access to the report.
13. Are there any additional resources or data provided in the Drug Dispenser report?
While the report offers comprehensive insights, it's advisable to review the specific contents or supplementary materials provided to ascertain if additional resources or data are available.
14. How can I stay updated on further developments or reports in the Drug Dispenser?
To stay informed about further developments, trends, and reports in the Drug Dispenser, consider subscribing to industry newsletters, following relevant companies and organizations, or regularly checking reputable industry news sources and publications.
Methodology
Step 1 - Identification of Relevant Samples Size from Population Database


Step 2 - Approaches for Defining Global Market Size (Value, Volume* & Price*)

Note*: In applicable scenarios
Step 3 - Data Sources
Primary Research
- Web Analytics
- Survey Reports
- Research Institute
- Latest Research Reports
- Opinion Leaders
Secondary Research
- Annual Reports
- White Paper
- Latest Press Release
- Industry Association
- Paid Database
- Investor Presentations

Step 4 - Data Triangulation
Involves using different sources of information in order to increase the validity of a study
These sources are likely to be stakeholders in a program - participants, other researchers, program staff, other community members, and so on.
Then we put all data in single framework & apply various statistical tools to find out the dynamic on the market.
During the analysis stage, feedback from the stakeholder groups would be compared to determine areas of agreement as well as areas of divergence