
Key Insights
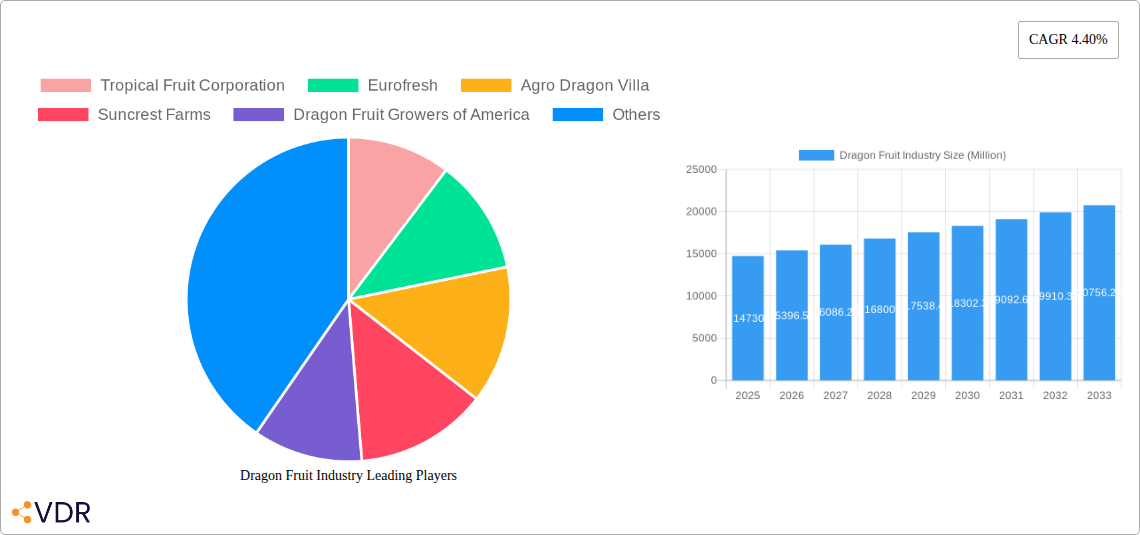
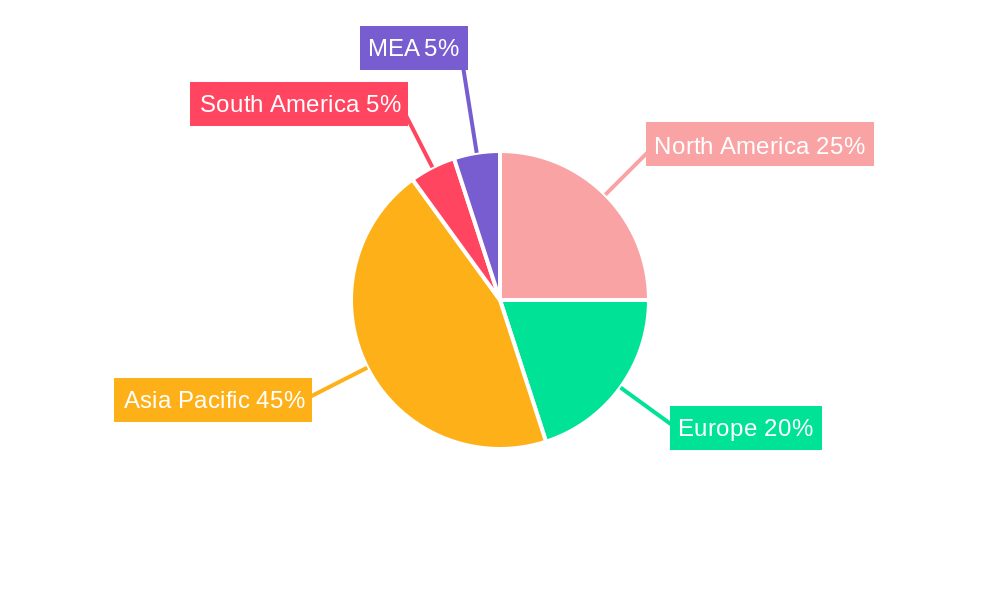
The global dragon fruit market, valued at $14.73 billion in 2025, is projected to experience robust growth, driven by increasing consumer awareness of its health benefits and versatility in culinary applications. The market's Compound Annual Growth Rate (CAGR) of 4.40% from 2025 to 2033 indicates a significant expansion potential. Key drivers include rising demand for exotic fruits, growing popularity in processed food products and beverages incorporating dragon fruit, and the increasing adoption of natural colorants in food and beverage industries. The fresh consumption segment currently holds a significant market share, but the processed food products segment is experiencing rapid growth, fueled by innovation in value-added products like dragon fruit-based jams, juices, and snacks. The retail channel dominates distribution, but online sales are expanding rapidly, driven by e-commerce growth and consumer preference for convenient online grocery shopping. Regional analysis reveals strong growth in Asia-Pacific, particularly in countries like China, India, and Southeast Asia, due to high consumption rates and extensive cultivation. North America and Europe also present significant market opportunities, albeit with slower growth rates compared to the Asia-Pacific region. Competitive landscape includes established players like Tropical Fruit Corporation and emerging companies catering to the growing demand for high-quality dragon fruit products. Challenges include seasonal variations in production, price volatility, and maintaining consistent supply chain efficiency to meet increasing demand.
The market segmentation reveals crucial insights into consumer preferences and product development opportunities. The processed food products and beverage segments are poised for significant growth, driven by ongoing innovation and consumer interest in convenient, healthy food options. Furthermore, the expanding online distribution channel presents opportunities for reaching a wider consumer base and expanding market reach. However, challenges such as maintaining product quality and freshness during online delivery and addressing consumer concerns regarding the sustainability of dragon fruit production need to be considered. Future growth will depend on successful cultivation practices, innovative product development, robust supply chain management, and targeted marketing campaigns that emphasize the unique health and culinary attributes of dragon fruit. Continued research and development in creating value-added products will further expand market potential.
Dragon Fruit Industry Market Report: 2019-2033
This comprehensive report provides an in-depth analysis of the global dragon fruit industry, covering market dynamics, growth trends, key players, and future outlook. The study period spans from 2019 to 2033, with 2025 serving as the base and estimated year. The report leverages extensive research and data analysis to offer valuable insights for industry professionals, investors, and stakeholders. This report examines the parent market of exotic fruits and the child market of dragon fruit specifically. The total market value in 2025 is estimated at xx Million.
Dragon Fruit Industry Market Dynamics & Structure
This section analyzes the competitive landscape of the dragon fruit industry, considering market concentration, technological advancements, regulatory influences, and market forces. The report delves into the dynamics shaping this vibrant sector.
- Market Concentration: The dragon fruit market exhibits a moderately fragmented structure, with key players like Tropical Fruit Corporation, Eurofresh, Agro Dragon Villa, Suncrest Farms, Dragon Fruit Growers of America, Miami Fruit, and Fruit Lovers holding significant but not dominant market shares. The combined market share of the top five players is estimated at 40% in 2025.
- Technological Innovation: Technological advancements in cultivation techniques (e.g., hydroponics), processing methods, and packaging solutions are driving efficiency and product quality. However, adoption rates vary across regions due to infrastructure limitations and financial constraints.
- Regulatory Frameworks: Varying regulations concerning pesticide usage, food safety standards, and labeling requirements across different countries pose challenges for international trade and market expansion.
- Competitive Product Substitutes: Other exotic fruits and berries compete with dragon fruit, leading to intense competition, particularly in developed markets.
- End-User Demographics: The primary end-users include retail consumers, foodservice businesses (restaurants, cafes), and industrial food processors, with retail accounting for the largest share (approximately 60% in 2025).
- M&A Trends: The number of M&A deals in the dragon fruit industry remained relatively low during the historical period (2019-2024) – approximately xx deals. However, a potential increase in M&A activity is predicted for the forecast period (2025-2033) driven by industry consolidation and expansion plans.
Dragon Fruit Industry Growth Trends & Insights
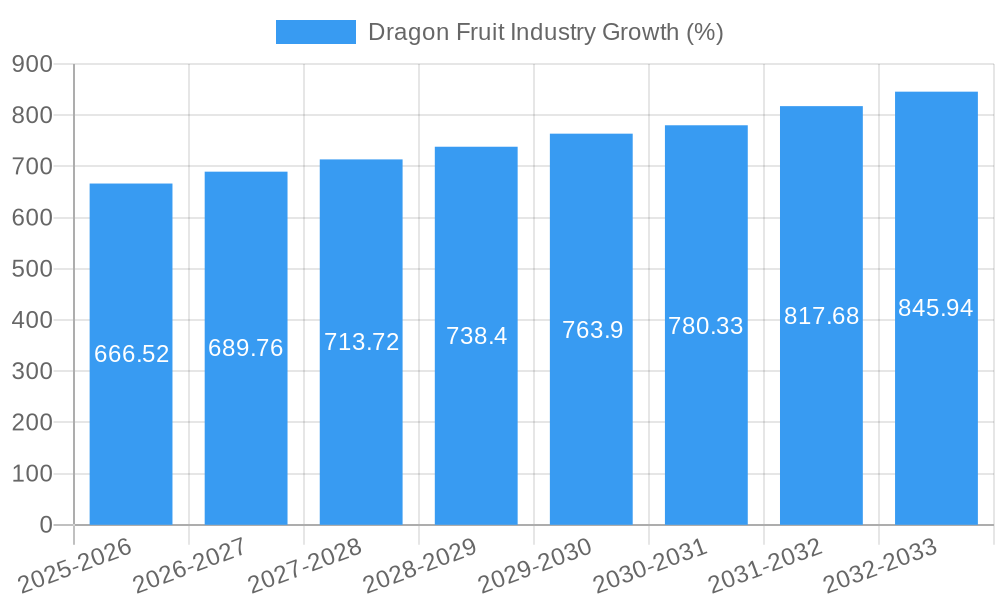
The global dragon fruit market experienced substantial growth during the historical period (2019-2024), driven by increasing consumer awareness of its health benefits and versatility. The market size increased from xx Million in 2019 to xx Million in 2024, registering a CAGR of xx%. The forecast period (2025-2033) is expected to witness continued growth, fueled by factors such as rising disposable incomes, changing dietary habits, and expanding distribution channels. The market is projected to reach xx Million by 2033, maintaining a CAGR of xx%. Market penetration remains relatively low in several regions, representing significant untapped potential. Technological disruptions in cultivation and processing are improving yield and product quality, further stimulating growth.
Dominant Regions, Countries, or Segments in Dragon Fruit Industry
Southeast Asia, particularly Vietnam and Thailand, dominates the global dragon fruit market due to favorable climatic conditions and established production infrastructure. However, other regions, including Latin America and parts of Africa, are showing significant growth potential.
Key Drivers:
- Favorable Climatic Conditions: Southeast Asia's climate is ideal for dragon fruit cultivation.
- Established Production Infrastructure: Long history of dragon fruit cultivation and processing facilities.
- Government Support: Supportive policies and investment in agricultural development.
- Export Opportunities: Increasing global demand for dragon fruit has boosted exports.
Dominant Segments:
- Product: Fresh consumption accounts for the largest market share among product segments (approximately 70% in 2025), followed by processed food products.
- End-User: The retail segment dominates the end-user landscape.
- Distribution Channel: Offline channels (supermarkets, traditional markets) currently hold the largest market share; however, online sales are growing rapidly.
Dragon Fruit Industry Product Landscape
The dragon fruit market offers a variety of products, including fresh fruit for direct consumption, processed products (jams, juices, dried fruit), beverages, and natural colorants. Innovations focus on enhancing shelf life, improving processing efficiency, and developing value-added products to cater to diverse consumer preferences. Unique selling propositions revolve around the fruit's health benefits, distinctive flavor, and visual appeal.
Key Drivers, Barriers & Challenges in Dragon Fruit Industry
Key Drivers:
- Growing consumer awareness of health benefits.
- Increasing demand for exotic fruits.
- Technological advancements in cultivation and processing.
- Expanding distribution networks.
Key Barriers and Challenges:
- Perishable nature of the fruit leads to post-harvest losses (estimated at xx% in 2025).
- Seasonal production can lead to supply chain disruptions.
- Price volatility due to varying yields.
- Competition from other exotic fruits.
Emerging Opportunities in Dragon Fruit Industry
Emerging opportunities include:
- Expansion into new markets (e.g., Europe, North America).
- Development of new value-added products (e.g., functional foods, nutraceuticals).
- Increased adoption of sustainable farming practices.
- Leveraging online sales channels to reach wider consumer base.
Growth Accelerators in the Dragon Fruit Industry Industry
Technological advancements in cultivation, processing, and preservation are key growth accelerators. Strategic partnerships between producers, processors, and retailers are improving supply chain efficiency. Marketing campaigns highlighting the nutritional and sensory benefits of dragon fruit are driving consumer demand.
Key Players Shaping the Dragon Fruit Industry Market
- Tropical Fruit Corporation
- Eurofresh
- Agro Dragon Villa
- Suncrest Farms
- Dragon Fruit Growers of America
- Miami Fruit
- Fruit Lovers
Notable Milestones in Dragon Fruit Industry Sector
- 2020: Introduction of a new dragon fruit variety with enhanced shelf life by Tropical Fruit Corporation.
- 2022: Acquisition of a major processing facility by Eurofresh, expanding their production capacity.
- 2023: Launch of a dragon fruit-based functional beverage by Suncrest Farms.
In-Depth Dragon Fruit Industry Market Outlook
The dragon fruit industry is poised for significant growth over the forecast period. Continued innovation in cultivation techniques, value-added product development, and expansion into new markets will drive future market potential. Strategic partnerships and investments in sustainable farming practices will further enhance the industry's long-term prospects. The market is expected to experience substantial growth, driven by the factors mentioned throughout the report. Companies that invest in research and development, optimize their supply chains, and adapt to evolving consumer preferences are best positioned to succeed in this dynamic market.
Dragon Fruit Industry Segmentation
- 1. Production Analysis
- 2. Consumption Analysis
- 3. Import Market Analysis (Value & Volume)
- 4. Export Market Analysis (Value & Volume)
- 5. Price Trend Analysis
Dragon Fruit Industry Segmentation By Geography
-
1. North America
- 1.1. United States
- 1.2. Canada
- 1.3. Mexico
-
2. Europe
- 2.1. Germany
- 2.2. UK
- 2.3. France
- 2.4. Netherlands
-
3. Asia Pacific
- 3.1. China
- 3.2. Vietnam
- 3.3. Cambodia
- 3.4. India
- 3.5. Thailand
- 3.6. Indonesia
-
4. South America
- 4.1. Brazil
- 4.2. Columbia
- 4.3. Argentina
-
5. Middle East and Africa
- 5.1. South Africa
- 5.2. Israel
- 5.3. Egypt
Dragon Fruit Industry REPORT HIGHLIGHTS
| Aspects | Details |
|---|---|
| Study Period | 2019-2033 |
| Base Year | 2024 |
| Estimated Year | 2025 |
| Forecast Period | 2025-2033 |
| Historical Period | 2019-2024 |
| Growth Rate | CAGR of 4.40% from 2019-2033 |
| Segmentation |
|
Table of Contents
- 1. Introduction
- 1.1. Research Scope
- 1.2. Market Segmentation
- 1.3. Research Methodology
- 1.4. Definitions and Assumptions
- 2. Executive Summary
- 2.1. Introduction
- 3. Market Dynamics
- 3.1. Introduction
- 3.2. Market Drivers
- 3.2.1. Increasing Demand for Garlic Due to Various Uses in Industries; Rising Demad of Organic Garlic; Increasing Government Initiatives
- 3.3. Market Restrains
- 3.3.1. Lack of Technical Knowledge of Farmers; Price Fluctuations
- 3.4. Market Trends
- 3.4.1. Growing Demand for Dragon Fruit in China
- 4. Market Factor Analysis
- 4.1. Porters Five Forces
- 4.2. Supply/Value Chain
- 4.3. PESTEL analysis
- 4.4. Market Entropy
- 4.5. Patent/Trademark Analysis
- 5. Global Dragon Fruit Industry Analysis, Insights and Forecast, 2019-2031
- 5.1. Market Analysis, Insights and Forecast - by Production Analysis
- 5.2. Market Analysis, Insights and Forecast - by Consumption Analysis
- 5.3. Market Analysis, Insights and Forecast - by Import Market Analysis (Value & Volume)
- 5.4. Market Analysis, Insights and Forecast - by Export Market Analysis (Value & Volume)
- 5.5. Market Analysis, Insights and Forecast - by Price Trend Analysis
- 5.6. Market Analysis, Insights and Forecast - by Region
- 5.6.1. North America
- 5.6.2. Europe
- 5.6.3. Asia Pacific
- 5.6.4. South America
- 5.6.5. Middle East and Africa
- 5.1. Market Analysis, Insights and Forecast - by Production Analysis
- 6. North America Dragon Fruit Industry Analysis, Insights and Forecast, 2019-2031
- 6.1. Market Analysis, Insights and Forecast - by Production Analysis
- 6.2. Market Analysis, Insights and Forecast - by Consumption Analysis
- 6.3. Market Analysis, Insights and Forecast - by Import Market Analysis (Value & Volume)
- 6.4. Market Analysis, Insights and Forecast - by Export Market Analysis (Value & Volume)
- 6.5. Market Analysis, Insights and Forecast - by Price Trend Analysis
- 6.1. Market Analysis, Insights and Forecast - by Production Analysis
- 7. Europe Dragon Fruit Industry Analysis, Insights and Forecast, 2019-2031
- 7.1. Market Analysis, Insights and Forecast - by Production Analysis
- 7.2. Market Analysis, Insights and Forecast - by Consumption Analysis
- 7.3. Market Analysis, Insights and Forecast - by Import Market Analysis (Value & Volume)
- 7.4. Market Analysis, Insights and Forecast - by Export Market Analysis (Value & Volume)
- 7.5. Market Analysis, Insights and Forecast - by Price Trend Analysis
- 7.1. Market Analysis, Insights and Forecast - by Production Analysis
- 8. Asia Pacific Dragon Fruit Industry Analysis, Insights and Forecast, 2019-2031
- 8.1. Market Analysis, Insights and Forecast - by Production Analysis
- 8.2. Market Analysis, Insights and Forecast - by Consumption Analysis
- 8.3. Market Analysis, Insights and Forecast - by Import Market Analysis (Value & Volume)
- 8.4. Market Analysis, Insights and Forecast - by Export Market Analysis (Value & Volume)
- 8.5. Market Analysis, Insights and Forecast - by Price Trend Analysis
- 8.1. Market Analysis, Insights and Forecast - by Production Analysis
- 9. South America Dragon Fruit Industry Analysis, Insights and Forecast, 2019-2031
- 9.1. Market Analysis, Insights and Forecast - by Production Analysis
- 9.2. Market Analysis, Insights and Forecast - by Consumption Analysis
- 9.3. Market Analysis, Insights and Forecast - by Import Market Analysis (Value & Volume)
- 9.4. Market Analysis, Insights and Forecast - by Export Market Analysis (Value & Volume)
- 9.5. Market Analysis, Insights and Forecast - by Price Trend Analysis
- 9.1. Market Analysis, Insights and Forecast - by Production Analysis
- 10. Middle East and Africa Dragon Fruit Industry Analysis, Insights and Forecast, 2019-2031
- 10.1. Market Analysis, Insights and Forecast - by Production Analysis
- 10.2. Market Analysis, Insights and Forecast - by Consumption Analysis
- 10.3. Market Analysis, Insights and Forecast - by Import Market Analysis (Value & Volume)
- 10.4. Market Analysis, Insights and Forecast - by Export Market Analysis (Value & Volume)
- 10.5. Market Analysis, Insights and Forecast - by Price Trend Analysis
- 10.1. Market Analysis, Insights and Forecast - by Production Analysis
- 11. North America Dragon Fruit Industry Analysis, Insights and Forecast, 2019-2031
- 11.1. Market Analysis, Insights and Forecast - By Country/Sub-region
- 11.1.1 United States
- 11.1.2 Canada
- 11.1.3 Mexico
- 12. Europe Dragon Fruit Industry Analysis, Insights and Forecast, 2019-2031
- 12.1. Market Analysis, Insights and Forecast - By Country/Sub-region
- 12.1.1 Germany
- 12.1.2 United Kingdom
- 12.1.3 France
- 12.1.4 Spain
- 12.1.5 Italy
- 12.1.6 Spain
- 12.1.7 Belgium
- 12.1.8 Netherland
- 12.1.9 Nordics
- 12.1.10 Rest of Europe
- 13. Asia Pacific Dragon Fruit Industry Analysis, Insights and Forecast, 2019-2031
- 13.1. Market Analysis, Insights and Forecast - By Country/Sub-region
- 13.1.1 China
- 13.1.2 Japan
- 13.1.3 India
- 13.1.4 South Korea
- 13.1.5 Southeast Asia
- 13.1.6 Australia
- 13.1.7 Indonesia
- 13.1.8 Phillipes
- 13.1.9 Singapore
- 13.1.10 Thailandc
- 13.1.11 Rest of Asia Pacific
- 14. South America Dragon Fruit Industry Analysis, Insights and Forecast, 2019-2031
- 14.1. Market Analysis, Insights and Forecast - By Country/Sub-region
- 14.1.1 Brazil
- 14.1.2 Argentina
- 14.1.3 Peru
- 14.1.4 Chile
- 14.1.5 Colombia
- 14.1.6 Ecuador
- 14.1.7 Venezuela
- 14.1.8 Rest of South America
- 15. MEA Dragon Fruit Industry Analysis, Insights and Forecast, 2019-2031
- 15.1. Market Analysis, Insights and Forecast - By Country/Sub-region
- 15.1.1 United Arab Emirates
- 15.1.2 Saudi Arabia
- 15.1.3 South Africa
- 15.1.4 Rest of Middle East and Africa
- 16. Competitive Analysis
- 16.1. Global Market Share Analysis 2024
- 16.2. Company Profiles
- 16.2.1 Tropical Fruit Corporation
- 16.2.1.1. Overview
- 16.2.1.2. Products
- 16.2.1.3. SWOT Analysis
- 16.2.1.4. Recent Developments
- 16.2.1.5. Financials (Based on Availability)
- 16.2.2 Eurofresh
- 16.2.2.1. Overview
- 16.2.2.2. Products
- 16.2.2.3. SWOT Analysis
- 16.2.2.4. Recent Developments
- 16.2.2.5. Financials (Based on Availability)
- 16.2.3 Agro Dragon Villa
- 16.2.3.1. Overview
- 16.2.3.2. Products
- 16.2.3.3. SWOT Analysis
- 16.2.3.4. Recent Developments
- 16.2.3.5. Financials (Based on Availability)
- 16.2.4 Suncrest Farms
- 16.2.4.1. Overview
- 16.2.4.2. Products
- 16.2.4.3. SWOT Analysis
- 16.2.4.4. Recent Developments
- 16.2.4.5. Financials (Based on Availability)
- 16.2.5 Dragon Fruit Growers of America
- 16.2.5.1. Overview
- 16.2.5.2. Products
- 16.2.5.3. SWOT Analysis
- 16.2.5.4. Recent Developments
- 16.2.5.5. Financials (Based on Availability)
- 16.2.6 Miami Fruit
- 16.2.6.1. Overview
- 16.2.6.2. Products
- 16.2.6.3. SWOT Analysis
- 16.2.6.4. Recent Developments
- 16.2.6.5. Financials (Based on Availability)
- 16.2.7 Fruit Lovers
- 16.2.7.1. Overview
- 16.2.7.2. Products
- 16.2.7.3. SWOT Analysis
- 16.2.7.4. Recent Developments
- 16.2.7.5. Financials (Based on Availability)
- 16.2.1 Tropical Fruit Corporation
List of Figures
- Figure 1: Global Dragon Fruit Industry Revenue Breakdown (Million, %) by Region 2024 & 2032
- Figure 2: North America Dragon Fruit Industry Revenue (Million), by Country 2024 & 2032
- Figure 3: North America Dragon Fruit Industry Revenue Share (%), by Country 2024 & 2032
- Figure 4: Europe Dragon Fruit Industry Revenue (Million), by Country 2024 & 2032
- Figure 5: Europe Dragon Fruit Industry Revenue Share (%), by Country 2024 & 2032
- Figure 6: Asia Pacific Dragon Fruit Industry Revenue (Million), by Country 2024 & 2032
- Figure 7: Asia Pacific Dragon Fruit Industry Revenue Share (%), by Country 2024 & 2032
- Figure 8: South America Dragon Fruit Industry Revenue (Million), by Country 2024 & 2032
- Figure 9: South America Dragon Fruit Industry Revenue Share (%), by Country 2024 & 2032
- Figure 10: MEA Dragon Fruit Industry Revenue (Million), by Country 2024 & 2032
- Figure 11: MEA Dragon Fruit Industry Revenue Share (%), by Country 2024 & 2032
- Figure 12: North America Dragon Fruit Industry Revenue (Million), by Production Analysis 2024 & 2032
- Figure 13: North America Dragon Fruit Industry Revenue Share (%), by Production Analysis 2024 & 2032
- Figure 14: North America Dragon Fruit Industry Revenue (Million), by Consumption Analysis 2024 & 2032
- Figure 15: North America Dragon Fruit Industry Revenue Share (%), by Consumption Analysis 2024 & 2032
- Figure 16: North America Dragon Fruit Industry Revenue (Million), by Import Market Analysis (Value & Volume) 2024 & 2032
- Figure 17: North America Dragon Fruit Industry Revenue Share (%), by Import Market Analysis (Value & Volume) 2024 & 2032
- Figure 18: North America Dragon Fruit Industry Revenue (Million), by Export Market Analysis (Value & Volume) 2024 & 2032
- Figure 19: North America Dragon Fruit Industry Revenue Share (%), by Export Market Analysis (Value & Volume) 2024 & 2032
- Figure 20: North America Dragon Fruit Industry Revenue (Million), by Price Trend Analysis 2024 & 2032
- Figure 21: North America Dragon Fruit Industry Revenue Share (%), by Price Trend Analysis 2024 & 2032
- Figure 22: North America Dragon Fruit Industry Revenue (Million), by Country 2024 & 2032
- Figure 23: North America Dragon Fruit Industry Revenue Share (%), by Country 2024 & 2032
- Figure 24: Europe Dragon Fruit Industry Revenue (Million), by Production Analysis 2024 & 2032
- Figure 25: Europe Dragon Fruit Industry Revenue Share (%), by Production Analysis 2024 & 2032
- Figure 26: Europe Dragon Fruit Industry Revenue (Million), by Consumption Analysis 2024 & 2032
- Figure 27: Europe Dragon Fruit Industry Revenue Share (%), by Consumption Analysis 2024 & 2032
- Figure 28: Europe Dragon Fruit Industry Revenue (Million), by Import Market Analysis (Value & Volume) 2024 & 2032
- Figure 29: Europe Dragon Fruit Industry Revenue Share (%), by Import Market Analysis (Value & Volume) 2024 & 2032
- Figure 30: Europe Dragon Fruit Industry Revenue (Million), by Export Market Analysis (Value & Volume) 2024 & 2032
- Figure 31: Europe Dragon Fruit Industry Revenue Share (%), by Export Market Analysis (Value & Volume) 2024 & 2032
- Figure 32: Europe Dragon Fruit Industry Revenue (Million), by Price Trend Analysis 2024 & 2032
- Figure 33: Europe Dragon Fruit Industry Revenue Share (%), by Price Trend Analysis 2024 & 2032
- Figure 34: Europe Dragon Fruit Industry Revenue (Million), by Country 2024 & 2032
- Figure 35: Europe Dragon Fruit Industry Revenue Share (%), by Country 2024 & 2032
- Figure 36: Asia Pacific Dragon Fruit Industry Revenue (Million), by Production Analysis 2024 & 2032
- Figure 37: Asia Pacific Dragon Fruit Industry Revenue Share (%), by Production Analysis 2024 & 2032
- Figure 38: Asia Pacific Dragon Fruit Industry Revenue (Million), by Consumption Analysis 2024 & 2032
- Figure 39: Asia Pacific Dragon Fruit Industry Revenue Share (%), by Consumption Analysis 2024 & 2032
- Figure 40: Asia Pacific Dragon Fruit Industry Revenue (Million), by Import Market Analysis (Value & Volume) 2024 & 2032
- Figure 41: Asia Pacific Dragon Fruit Industry Revenue Share (%), by Import Market Analysis (Value & Volume) 2024 & 2032
- Figure 42: Asia Pacific Dragon Fruit Industry Revenue (Million), by Export Market Analysis (Value & Volume) 2024 & 2032
- Figure 43: Asia Pacific Dragon Fruit Industry Revenue Share (%), by Export Market Analysis (Value & Volume) 2024 & 2032
- Figure 44: Asia Pacific Dragon Fruit Industry Revenue (Million), by Price Trend Analysis 2024 & 2032
- Figure 45: Asia Pacific Dragon Fruit Industry Revenue Share (%), by Price Trend Analysis 2024 & 2032
- Figure 46: Asia Pacific Dragon Fruit Industry Revenue (Million), by Country 2024 & 2032
- Figure 47: Asia Pacific Dragon Fruit Industry Revenue Share (%), by Country 2024 & 2032
- Figure 48: South America Dragon Fruit Industry Revenue (Million), by Production Analysis 2024 & 2032
- Figure 49: South America Dragon Fruit Industry Revenue Share (%), by Production Analysis 2024 & 2032
- Figure 50: South America Dragon Fruit Industry Revenue (Million), by Consumption Analysis 2024 & 2032
- Figure 51: South America Dragon Fruit Industry Revenue Share (%), by Consumption Analysis 2024 & 2032
- Figure 52: South America Dragon Fruit Industry Revenue (Million), by Import Market Analysis (Value & Volume) 2024 & 2032
- Figure 53: South America Dragon Fruit Industry Revenue Share (%), by Import Market Analysis (Value & Volume) 2024 & 2032
- Figure 54: South America Dragon Fruit Industry Revenue (Million), by Export Market Analysis (Value & Volume) 2024 & 2032
- Figure 55: South America Dragon Fruit Industry Revenue Share (%), by Export Market Analysis (Value & Volume) 2024 & 2032
- Figure 56: South America Dragon Fruit Industry Revenue (Million), by Price Trend Analysis 2024 & 2032
- Figure 57: South America Dragon Fruit Industry Revenue Share (%), by Price Trend Analysis 2024 & 2032
- Figure 58: South America Dragon Fruit Industry Revenue (Million), by Country 2024 & 2032
- Figure 59: South America Dragon Fruit Industry Revenue Share (%), by Country 2024 & 2032
- Figure 60: Middle East and Africa Dragon Fruit Industry Revenue (Million), by Production Analysis 2024 & 2032
- Figure 61: Middle East and Africa Dragon Fruit Industry Revenue Share (%), by Production Analysis 2024 & 2032
- Figure 62: Middle East and Africa Dragon Fruit Industry Revenue (Million), by Consumption Analysis 2024 & 2032
- Figure 63: Middle East and Africa Dragon Fruit Industry Revenue Share (%), by Consumption Analysis 2024 & 2032
- Figure 64: Middle East and Africa Dragon Fruit Industry Revenue (Million), by Import Market Analysis (Value & Volume) 2024 & 2032
- Figure 65: Middle East and Africa Dragon Fruit Industry Revenue Share (%), by Import Market Analysis (Value & Volume) 2024 & 2032
- Figure 66: Middle East and Africa Dragon Fruit Industry Revenue (Million), by Export Market Analysis (Value & Volume) 2024 & 2032
- Figure 67: Middle East and Africa Dragon Fruit Industry Revenue Share (%), by Export Market Analysis (Value & Volume) 2024 & 2032
- Figure 68: Middle East and Africa Dragon Fruit Industry Revenue (Million), by Price Trend Analysis 2024 & 2032
- Figure 69: Middle East and Africa Dragon Fruit Industry Revenue Share (%), by Price Trend Analysis 2024 & 2032
- Figure 70: Middle East and Africa Dragon Fruit Industry Revenue (Million), by Country 2024 & 2032
- Figure 71: Middle East and Africa Dragon Fruit Industry Revenue Share (%), by Country 2024 & 2032
List of Tables
- Table 1: Global Dragon Fruit Industry Revenue Million Forecast, by Region 2019 & 2032
- Table 2: Global Dragon Fruit Industry Revenue Million Forecast, by Production Analysis 2019 & 2032
- Table 3: Global Dragon Fruit Industry Revenue Million Forecast, by Consumption Analysis 2019 & 2032
- Table 4: Global Dragon Fruit Industry Revenue Million Forecast, by Import Market Analysis (Value & Volume) 2019 & 2032
- Table 5: Global Dragon Fruit Industry Revenue Million Forecast, by Export Market Analysis (Value & Volume) 2019 & 2032
- Table 6: Global Dragon Fruit Industry Revenue Million Forecast, by Price Trend Analysis 2019 & 2032
- Table 7: Global Dragon Fruit Industry Revenue Million Forecast, by Region 2019 & 2032
- Table 8: Global Dragon Fruit Industry Revenue Million Forecast, by Country 2019 & 2032
- Table 9: United States Dragon Fruit Industry Revenue (Million) Forecast, by Application 2019 & 2032
- Table 10: Canada Dragon Fruit Industry Revenue (Million) Forecast, by Application 2019 & 2032
- Table 11: Mexico Dragon Fruit Industry Revenue (Million) Forecast, by Application 2019 & 2032
- Table 12: Global Dragon Fruit Industry Revenue Million Forecast, by Country 2019 & 2032
- Table 13: Germany Dragon Fruit Industry Revenue (Million) Forecast, by Application 2019 & 2032
- Table 14: United Kingdom Dragon Fruit Industry Revenue (Million) Forecast, by Application 2019 & 2032
- Table 15: France Dragon Fruit Industry Revenue (Million) Forecast, by Application 2019 & 2032
- Table 16: Spain Dragon Fruit Industry Revenue (Million) Forecast, by Application 2019 & 2032
- Table 17: Italy Dragon Fruit Industry Revenue (Million) Forecast, by Application 2019 & 2032
- Table 18: Spain Dragon Fruit Industry Revenue (Million) Forecast, by Application 2019 & 2032
- Table 19: Belgium Dragon Fruit Industry Revenue (Million) Forecast, by Application 2019 & 2032
- Table 20: Netherland Dragon Fruit Industry Revenue (Million) Forecast, by Application 2019 & 2032
- Table 21: Nordics Dragon Fruit Industry Revenue (Million) Forecast, by Application 2019 & 2032
- Table 22: Rest of Europe Dragon Fruit Industry Revenue (Million) Forecast, by Application 2019 & 2032
- Table 23: Global Dragon Fruit Industry Revenue Million Forecast, by Country 2019 & 2032
- Table 24: China Dragon Fruit Industry Revenue (Million) Forecast, by Application 2019 & 2032
- Table 25: Japan Dragon Fruit Industry Revenue (Million) Forecast, by Application 2019 & 2032
- Table 26: India Dragon Fruit Industry Revenue (Million) Forecast, by Application 2019 & 2032
- Table 27: South Korea Dragon Fruit Industry Revenue (Million) Forecast, by Application 2019 & 2032
- Table 28: Southeast Asia Dragon Fruit Industry Revenue (Million) Forecast, by Application 2019 & 2032
- Table 29: Australia Dragon Fruit Industry Revenue (Million) Forecast, by Application 2019 & 2032
- Table 30: Indonesia Dragon Fruit Industry Revenue (Million) Forecast, by Application 2019 & 2032
- Table 31: Phillipes Dragon Fruit Industry Revenue (Million) Forecast, by Application 2019 & 2032
- Table 32: Singapore Dragon Fruit Industry Revenue (Million) Forecast, by Application 2019 & 2032
- Table 33: Thailandc Dragon Fruit Industry Revenue (Million) Forecast, by Application 2019 & 2032
- Table 34: Rest of Asia Pacific Dragon Fruit Industry Revenue (Million) Forecast, by Application 2019 & 2032
- Table 35: Global Dragon Fruit Industry Revenue Million Forecast, by Country 2019 & 2032
- Table 36: Brazil Dragon Fruit Industry Revenue (Million) Forecast, by Application 2019 & 2032
- Table 37: Argentina Dragon Fruit Industry Revenue (Million) Forecast, by Application 2019 & 2032
- Table 38: Peru Dragon Fruit Industry Revenue (Million) Forecast, by Application 2019 & 2032
- Table 39: Chile Dragon Fruit Industry Revenue (Million) Forecast, by Application 2019 & 2032
- Table 40: Colombia Dragon Fruit Industry Revenue (Million) Forecast, by Application 2019 & 2032
- Table 41: Ecuador Dragon Fruit Industry Revenue (Million) Forecast, by Application 2019 & 2032
- Table 42: Venezuela Dragon Fruit Industry Revenue (Million) Forecast, by Application 2019 & 2032
- Table 43: Rest of South America Dragon Fruit Industry Revenue (Million) Forecast, by Application 2019 & 2032
- Table 44: Global Dragon Fruit Industry Revenue Million Forecast, by Country 2019 & 2032
- Table 45: United Arab Emirates Dragon Fruit Industry Revenue (Million) Forecast, by Application 2019 & 2032
- Table 46: Saudi Arabia Dragon Fruit Industry Revenue (Million) Forecast, by Application 2019 & 2032
- Table 47: South Africa Dragon Fruit Industry Revenue (Million) Forecast, by Application 2019 & 2032
- Table 48: Rest of Middle East and Africa Dragon Fruit Industry Revenue (Million) Forecast, by Application 2019 & 2032
- Table 49: Global Dragon Fruit Industry Revenue Million Forecast, by Production Analysis 2019 & 2032
- Table 50: Global Dragon Fruit Industry Revenue Million Forecast, by Consumption Analysis 2019 & 2032
- Table 51: Global Dragon Fruit Industry Revenue Million Forecast, by Import Market Analysis (Value & Volume) 2019 & 2032
- Table 52: Global Dragon Fruit Industry Revenue Million Forecast, by Export Market Analysis (Value & Volume) 2019 & 2032
- Table 53: Global Dragon Fruit Industry Revenue Million Forecast, by Price Trend Analysis 2019 & 2032
- Table 54: Global Dragon Fruit Industry Revenue Million Forecast, by Country 2019 & 2032
- Table 55: United States Dragon Fruit Industry Revenue (Million) Forecast, by Application 2019 & 2032
- Table 56: Canada Dragon Fruit Industry Revenue (Million) Forecast, by Application 2019 & 2032
- Table 57: Mexico Dragon Fruit Industry Revenue (Million) Forecast, by Application 2019 & 2032
- Table 58: Global Dragon Fruit Industry Revenue Million Forecast, by Production Analysis 2019 & 2032
- Table 59: Global Dragon Fruit Industry Revenue Million Forecast, by Consumption Analysis 2019 & 2032
- Table 60: Global Dragon Fruit Industry Revenue Million Forecast, by Import Market Analysis (Value & Volume) 2019 & 2032
- Table 61: Global Dragon Fruit Industry Revenue Million Forecast, by Export Market Analysis (Value & Volume) 2019 & 2032
- Table 62: Global Dragon Fruit Industry Revenue Million Forecast, by Price Trend Analysis 2019 & 2032
- Table 63: Global Dragon Fruit Industry Revenue Million Forecast, by Country 2019 & 2032
- Table 64: Germany Dragon Fruit Industry Revenue (Million) Forecast, by Application 2019 & 2032
- Table 65: UK Dragon Fruit Industry Revenue (Million) Forecast, by Application 2019 & 2032
- Table 66: France Dragon Fruit Industry Revenue (Million) Forecast, by Application 2019 & 2032
- Table 67: Netherlands Dragon Fruit Industry Revenue (Million) Forecast, by Application 2019 & 2032
- Table 68: Global Dragon Fruit Industry Revenue Million Forecast, by Production Analysis 2019 & 2032
- Table 69: Global Dragon Fruit Industry Revenue Million Forecast, by Consumption Analysis 2019 & 2032
- Table 70: Global Dragon Fruit Industry Revenue Million Forecast, by Import Market Analysis (Value & Volume) 2019 & 2032
- Table 71: Global Dragon Fruit Industry Revenue Million Forecast, by Export Market Analysis (Value & Volume) 2019 & 2032
- Table 72: Global Dragon Fruit Industry Revenue Million Forecast, by Price Trend Analysis 2019 & 2032
- Table 73: Global Dragon Fruit Industry Revenue Million Forecast, by Country 2019 & 2032
- Table 74: China Dragon Fruit Industry Revenue (Million) Forecast, by Application 2019 & 2032
- Table 75: Vietnam Dragon Fruit Industry Revenue (Million) Forecast, by Application 2019 & 2032
- Table 76: Cambodia Dragon Fruit Industry Revenue (Million) Forecast, by Application 2019 & 2032
- Table 77: India Dragon Fruit Industry Revenue (Million) Forecast, by Application 2019 & 2032
- Table 78: Thailand Dragon Fruit Industry Revenue (Million) Forecast, by Application 2019 & 2032
- Table 79: Indonesia Dragon Fruit Industry Revenue (Million) Forecast, by Application 2019 & 2032
- Table 80: Global Dragon Fruit Industry Revenue Million Forecast, by Production Analysis 2019 & 2032
- Table 81: Global Dragon Fruit Industry Revenue Million Forecast, by Consumption Analysis 2019 & 2032
- Table 82: Global Dragon Fruit Industry Revenue Million Forecast, by Import Market Analysis (Value & Volume) 2019 & 2032
- Table 83: Global Dragon Fruit Industry Revenue Million Forecast, by Export Market Analysis (Value & Volume) 2019 & 2032
- Table 84: Global Dragon Fruit Industry Revenue Million Forecast, by Price Trend Analysis 2019 & 2032
- Table 85: Global Dragon Fruit Industry Revenue Million Forecast, by Country 2019 & 2032
- Table 86: Brazil Dragon Fruit Industry Revenue (Million) Forecast, by Application 2019 & 2032
- Table 87: Columbia Dragon Fruit Industry Revenue (Million) Forecast, by Application 2019 & 2032
- Table 88: Argentina Dragon Fruit Industry Revenue (Million) Forecast, by Application 2019 & 2032
- Table 89: Global Dragon Fruit Industry Revenue Million Forecast, by Production Analysis 2019 & 2032
- Table 90: Global Dragon Fruit Industry Revenue Million Forecast, by Consumption Analysis 2019 & 2032
- Table 91: Global Dragon Fruit Industry Revenue Million Forecast, by Import Market Analysis (Value & Volume) 2019 & 2032
- Table 92: Global Dragon Fruit Industry Revenue Million Forecast, by Export Market Analysis (Value & Volume) 2019 & 2032
- Table 93: Global Dragon Fruit Industry Revenue Million Forecast, by Price Trend Analysis 2019 & 2032
- Table 94: Global Dragon Fruit Industry Revenue Million Forecast, by Country 2019 & 2032
- Table 95: South Africa Dragon Fruit Industry Revenue (Million) Forecast, by Application 2019 & 2032
- Table 96: Israel Dragon Fruit Industry Revenue (Million) Forecast, by Application 2019 & 2032
- Table 97: Egypt Dragon Fruit Industry Revenue (Million) Forecast, by Application 2019 & 2032
Frequently Asked Questions
1. What is the projected Compound Annual Growth Rate (CAGR) of the Dragon Fruit Industry?
The projected CAGR is approximately 4.40%.
2. Which companies are prominent players in the Dragon Fruit Industry?
Key companies in the market include Tropical Fruit Corporation , Eurofresh , Agro Dragon Villa , Suncrest Farms , Dragon Fruit Growers of America , Miami Fruit , Fruit Lovers.
3. What are the main segments of the Dragon Fruit Industry?
The market segments include Production Analysis, Consumption Analysis, Import Market Analysis (Value & Volume), Export Market Analysis (Value & Volume), Price Trend Analysis.
4. Can you provide details about the market size?
The market size is estimated to be USD 14.73 Million as of 2022.
5. What are some drivers contributing to market growth?
Increasing Demand for Garlic Due to Various Uses in Industries; Rising Demad of Organic Garlic; Increasing Government Initiatives.
6. What are the notable trends driving market growth?
Growing Demand for Dragon Fruit in China.
7. Are there any restraints impacting market growth?
Lack of Technical Knowledge of Farmers; Price Fluctuations.
8. Can you provide examples of recent developments in the market?
N/A
9. What pricing options are available for accessing the report?
Pricing options include single-user, multi-user, and enterprise licenses priced at USD 4750, USD 5250, and USD 8750 respectively.
10. Is the market size provided in terms of value or volume?
The market size is provided in terms of value, measured in Million.
11. Are there any specific market keywords associated with the report?
Yes, the market keyword associated with the report is "Dragon Fruit Industry," which aids in identifying and referencing the specific market segment covered.
12. How do I determine which pricing option suits my needs best?
The pricing options vary based on user requirements and access needs. Individual users may opt for single-user licenses, while businesses requiring broader access may choose multi-user or enterprise licenses for cost-effective access to the report.
13. Are there any additional resources or data provided in the Dragon Fruit Industry report?
While the report offers comprehensive insights, it's advisable to review the specific contents or supplementary materials provided to ascertain if additional resources or data are available.
14. How can I stay updated on further developments or reports in the Dragon Fruit Industry?
To stay informed about further developments, trends, and reports in the Dragon Fruit Industry, consider subscribing to industry newsletters, following relevant companies and organizations, or regularly checking reputable industry news sources and publications.
Methodology
Step 1 - Identification of Relevant Samples Size from Population Database


Step 2 - Approaches for Defining Global Market Size (Value, Volume* & Price*)

Note*: In applicable scenarios
Step 3 - Data Sources
Primary Research
- Web Analytics
- Survey Reports
- Research Institute
- Latest Research Reports
- Opinion Leaders
Secondary Research
- Annual Reports
- White Paper
- Latest Press Release
- Industry Association
- Paid Database
- Investor Presentations

Step 4 - Data Triangulation
Involves using different sources of information in order to increase the validity of a study
These sources are likely to be stakeholders in a program - participants, other researchers, program staff, other community members, and so on.
Then we put all data in single framework & apply various statistical tools to find out the dynamic on the market.
During the analysis stage, feedback from the stakeholder groups would be compared to determine areas of agreement as well as areas of divergence


