
Key Insights
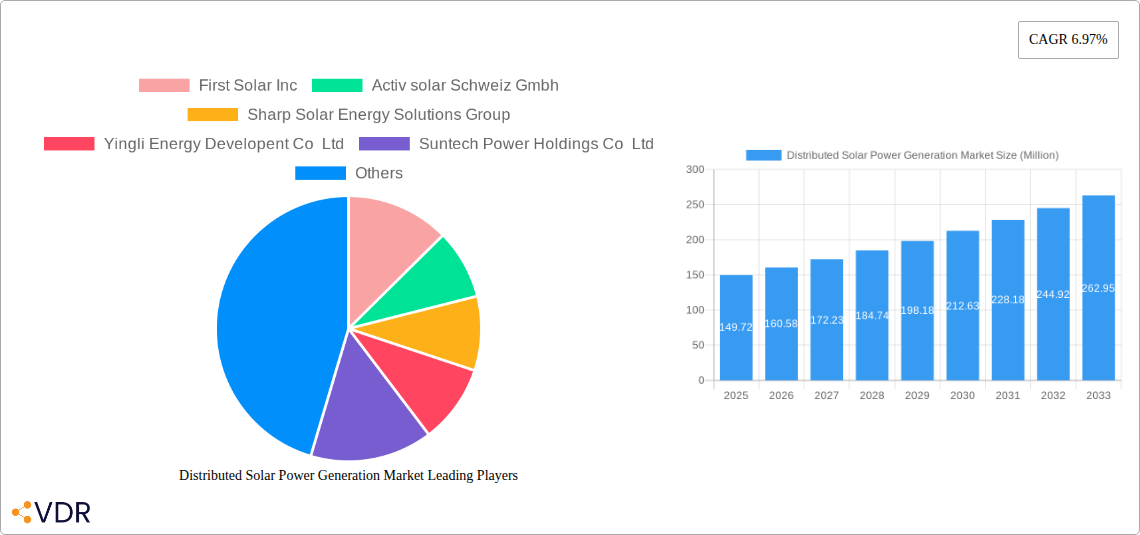
The distributed solar power generation market, valued at $149.72 million in 2025, is projected to experience robust growth, driven by increasing concerns about climate change, declining solar panel costs, and supportive government policies promoting renewable energy adoption. This growth is further fueled by the rising energy demands of residential, commercial, and industrial sectors, coupled with the increasing unreliability and escalating costs of traditional grid electricity. The market segmentation reveals a significant share held by on-grid systems, benefiting from established grid infrastructure and ease of integration. However, off-grid systems are demonstrating substantial growth potential, particularly in remote areas with limited or no grid access. Geographically, North America and Europe currently dominate the market, owing to established renewable energy initiatives and technological advancements. However, Asia-Pacific is poised for significant expansion, driven by rapid economic growth and increasing energy consumption in countries like China and India. Key players like First Solar, Canadian Solar, and Tesla are actively shaping the market through technological innovation, strategic partnerships, and aggressive expansion strategies. The market's trajectory suggests a continued upward trend, with growth propelled by technological advancements such as improved energy storage solutions and advancements in photovoltaic technology.
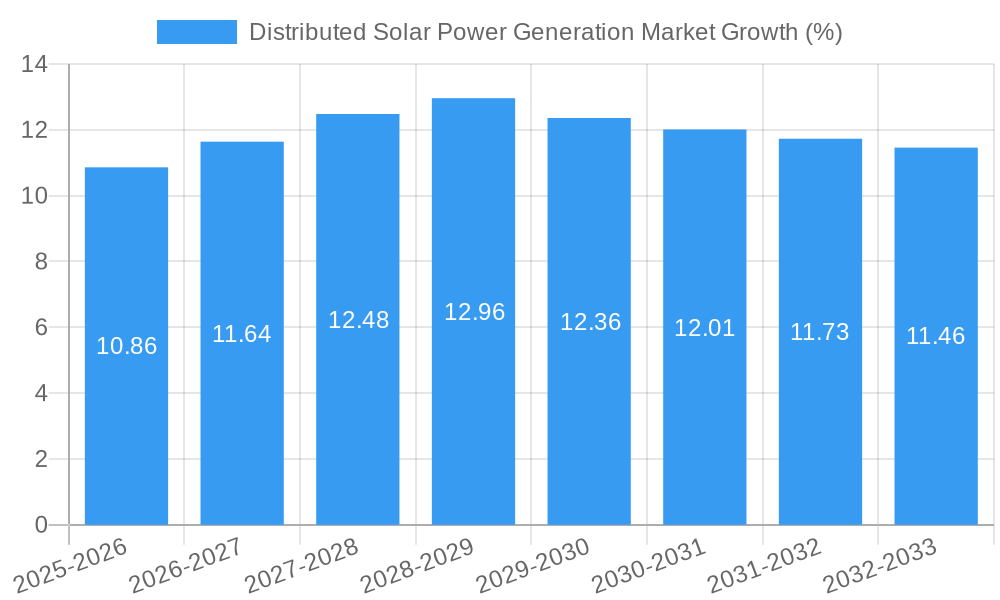
The market’s restraints primarily involve the intermittent nature of solar energy, requiring efficient energy storage solutions to ensure consistent power supply. Furthermore, initial investment costs and permitting processes can pose challenges to wider adoption. However, continuous technological advancements in battery storage and streamlined regulatory frameworks are mitigating these hurdles. The forecast period (2025-2033) anticipates a sustained CAGR of 6.97%, reflecting the market's resilience and potential for future growth. This expansion will be further driven by rising consumer awareness of environmental sustainability, increasing government incentives, and the decreasing levelized cost of energy from distributed solar power generation. The competitive landscape is marked by intense innovation and strategic alliances, as companies strive to enhance efficiency, reduce costs, and expand their market presence.
Distributed Solar Power Generation Market: A Comprehensive Report (2019-2033)
This comprehensive report provides an in-depth analysis of the Distributed Solar Power Generation market, encompassing market dynamics, growth trends, regional dominance, product landscape, key players, and future outlook. The study period spans from 2019 to 2033, with 2025 serving as the base and estimated year. The report leverages extensive data analysis to offer valuable insights for industry professionals, investors, and strategic decision-makers. The parent market is the broader renewable energy sector, while the child market focuses specifically on distributed solar power generation systems. Market values are presented in Million units.
Distributed Solar Power Generation Market Dynamics & Structure
This section delves into the intricate structure of the distributed solar power generation market, analyzing market concentration, technological innovation, regulatory landscapes, and competitive dynamics. We examine the impact of mergers and acquisitions (M&A) activities, end-user demographics, and the presence of substitute products.
- Market Concentration: The market exhibits a moderately concentrated structure, with a few major players holding significant market share, while numerous smaller companies compete in niche segments. We estimate the top 5 players hold approximately xx% of the market share in 2025.
- Technological Innovation: Continuous advancements in photovoltaic (PV) technology, including higher efficiency cells and improved energy storage solutions, are driving market growth. However, innovation barriers, such as high initial investment costs and complex regulatory approvals, remain significant challenges.
- Regulatory Frameworks: Government policies promoting renewable energy adoption, feed-in tariffs, and net metering schemes significantly influence market growth. Variations in regulatory frameworks across different regions create unique opportunities and challenges.
- Competitive Product Substitutes: Distributed solar faces competition from other distributed generation technologies, such as wind power and biomass energy. The competitive landscape is further shaped by the availability of grid-connected electricity.
- End-User Demographics: Residential, commercial, and industrial sectors represent distinct market segments, each with varying adoption rates and drivers. The increasing awareness of environmental sustainability and cost savings is driving growth across all segments.
- M&A Trends: The past five years have witnessed a moderate level of M&A activity, with xx deals recorded during the historical period (2019-2024). These activities are driven by the need for economies of scale, technological integration, and geographical expansion.
Distributed Solar Power Generation Market Growth Trends & Insights
This section offers a detailed analysis of market size evolution, adoption rates, and technological disruptions impacting the distributed solar power generation market. We explore consumer behavior shifts and provide quantitative insights into market growth trajectories.
The global distributed solar power generation market is experiencing robust growth, driven by factors such as increasing electricity demand, declining solar PV costs, and supportive government policies. The market size is projected to reach xx Million units by 2033, registering a compound annual growth rate (CAGR) of xx% during the forecast period (2025-2033). Market penetration rates are expected to increase significantly, particularly in developing economies with substantial unmet energy needs. Technological advancements, such as the integration of smart inverters and battery storage, are enhancing the efficiency and reliability of distributed solar systems, further boosting market adoption. Changing consumer preferences, including a heightened awareness of environmental sustainability and a desire for energy independence, are also propelling market growth.
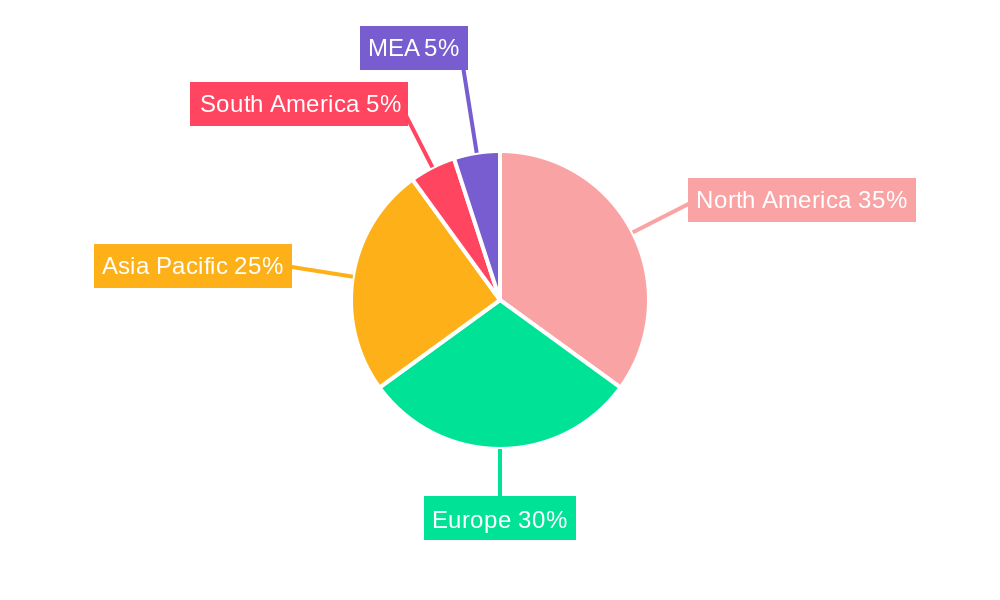
Dominant Regions, Countries, or Segments in Distributed Solar Power Generation Market
This section pinpoints the leading regions, countries, and market segments driving market growth. We analyze dominance factors, including market share and growth potential, for both system types (off-grid, on-grid) and applications (residential, commercial, industrial).
Dominant Regions: [Specify the leading region, e.g., Asia-Pacific] is expected to maintain its dominant position throughout the forecast period, driven by strong government support, rapid economic growth, and increasing energy demands. [Mention other regions with strong growth potential, e.g., North America and Europe] are also expected to witness substantial growth.
Dominant Countries: [Specify leading countries within the dominant region, e.g., China, India, and the US] are key contributors to market growth due to their favorable policy environments, extensive deployment of solar projects, and large consumer bases.
Dominant Segments: The on-grid system type is projected to dominate the market due to its wider applicability and potential for grid integration. Within applications, the residential sector is currently the largest segment, although the commercial and industrial sectors are expected to experience faster growth rates in the coming years. Key drivers for each segment are detailed below:
- Residential: Government incentives, declining system costs, and growing awareness of environmental benefits are driving residential adoption.
- Commercial: Businesses are increasingly adopting distributed solar to reduce operational costs and improve their environmental footprint.
- Industrial: Large industrial facilities are implementing distributed solar systems to lower energy expenses and enhance energy security.
Distributed Solar Power Generation Market Product Landscape
The distributed solar power generation market features a diverse range of products, encompassing various PV module technologies, inverters, mounting systems, and energy storage solutions. Continuous product innovations focus on enhancing efficiency, reliability, and cost-effectiveness. Advancements include higher-efficiency solar cells, improved power electronics, and smarter energy management systems. Unique selling propositions often center on system performance, ease of installation, and integration capabilities with smart home technologies.
Key Drivers, Barriers & Challenges in Distributed Solar Power Generation Market
Key Drivers:
- Declining PV technology costs.
- Increasing electricity prices.
- Government incentives and subsidies.
- Growing environmental awareness.
- Improved energy storage technologies.
Challenges & Restraints:
- Intermittency of solar power.
- Grid infrastructure limitations.
- High initial investment costs.
- Regulatory complexities and permitting processes.
- Dependence on weather conditions.
Emerging Opportunities in Distributed Solar Power Generation Market
The market presents several promising opportunities, including:
- Expanding into underserved markets in developing countries.
- Integration of distributed solar with other renewable energy sources.
- Development of innovative financing models to address high upfront costs.
- Growing demand for solar energy storage solutions.
- Emerging applications in areas such as agrivoltaics.
Growth Accelerators in the Distributed Solar Power Generation Market Industry
Technological breakthroughs in PV technology, strategic partnerships between solar developers and energy providers, and aggressive market expansion strategies into new regions and customer segments are accelerating growth. These strategies include leveraging innovative financing mechanisms to make solar energy more accessible and targeting specific market niches.
Key Players Shaping the Distributed Solar Power Generation Market Market
- First Solar Inc
- Activ solar Schweiz Gmbh
- Sharp Solar Energy Solutions Group
- Yingli Energy Developent Co Ltd
- Suntech Power Holdings Co Ltd
- Canadian Solar Inc
- Tesla Inc
- JinkoSolar Holding Co Ltd
- Trina Solar Limited
Notable Milestones in Distributed Solar Power Generation Market Sector
- May 2022: GreenYellow secures an 8.03 MWp contract to power Grupo DPSP pharmacies in Brazil.
- March 2022: Smart Power India partners with Adani Solar to promote solar energy in rural India.
In-Depth Distributed Solar Power Generation Market Market Outlook
The distributed solar power generation market is poised for sustained growth, driven by the factors discussed earlier. Strategic opportunities lie in capitalizing on emerging technologies, expanding into new markets, and developing innovative business models. The continued decline in solar PV costs, coupled with supportive government policies, will play a key role in shaping the market's future trajectory. The increasing integration of energy storage systems and the growing demand for grid-connected solutions will further propel market expansion.
Distributed Solar Power Generation Market Segmentation
- 1. Production Analysis
- 2. Consumption Analysis
- 3. Import Market Analysis (Value & Volume)
- 4. Export Market Analysis (Value & Volume)
- 5. Price Trend Analysis
Distributed Solar Power Generation Market Segmentation By Geography
- 1. North America
- 2. Europe
- 3. Asia Pacific
- 4. South America
- 5. Middle East and Africa
Distributed Solar Power Generation Market REPORT HIGHLIGHTS
| Aspects | Details |
|---|---|
| Study Period | 2019-2033 |
| Base Year | 2024 |
| Estimated Year | 2025 |
| Forecast Period | 2025-2033 |
| Historical Period | 2019-2024 |
| Growth Rate | CAGR of 6.97% from 2019-2033 |
| Segmentation |
|
Table of Contents
- 1. Introduction
- 1.1. Research Scope
- 1.2. Market Segmentation
- 1.3. Research Methodology
- 1.4. Definitions and Assumptions
- 2. Executive Summary
- 2.1. Introduction
- 3. Market Dynamics
- 3.1. Introduction
- 3.2. Market Drivers
- 3.2.1. 4.; Favorable Government Policies4.; Declining Solar Panel Costs
- 3.3. Market Restrains
- 3.3.1. 4.; Development of Alternate Sources of Renewable Energy
- 3.4. Market Trends
- 3.4.1. Declining Price of Solar PV Systems and Installations Cost Expected to Drive the Market
- 4. Market Factor Analysis
- 4.1. Porters Five Forces
- 4.2. Supply/Value Chain
- 4.3. PESTEL analysis
- 4.4. Market Entropy
- 4.5. Patent/Trademark Analysis
- 5. Global Distributed Solar Power Generation Market Analysis, Insights and Forecast, 2019-2031
- 5.1. Market Analysis, Insights and Forecast - by Production Analysis
- 5.2. Market Analysis, Insights and Forecast - by Consumption Analysis
- 5.3. Market Analysis, Insights and Forecast - by Import Market Analysis (Value & Volume)
- 5.4. Market Analysis, Insights and Forecast - by Export Market Analysis (Value & Volume)
- 5.5. Market Analysis, Insights and Forecast - by Price Trend Analysis
- 5.6. Market Analysis, Insights and Forecast - by Region
- 5.6.1. North America
- 5.6.2. Europe
- 5.6.3. Asia Pacific
- 5.6.4. South America
- 5.6.5. Middle East and Africa
- 5.1. Market Analysis, Insights and Forecast - by Production Analysis
- 6. North America Distributed Solar Power Generation Market Analysis, Insights and Forecast, 2019-2031
- 6.1. Market Analysis, Insights and Forecast - by Production Analysis
- 6.2. Market Analysis, Insights and Forecast - by Consumption Analysis
- 6.3. Market Analysis, Insights and Forecast - by Import Market Analysis (Value & Volume)
- 6.4. Market Analysis, Insights and Forecast - by Export Market Analysis (Value & Volume)
- 6.5. Market Analysis, Insights and Forecast - by Price Trend Analysis
- 6.1. Market Analysis, Insights and Forecast - by Production Analysis
- 7. Europe Distributed Solar Power Generation Market Analysis, Insights and Forecast, 2019-2031
- 7.1. Market Analysis, Insights and Forecast - by Production Analysis
- 7.2. Market Analysis, Insights and Forecast - by Consumption Analysis
- 7.3. Market Analysis, Insights and Forecast - by Import Market Analysis (Value & Volume)
- 7.4. Market Analysis, Insights and Forecast - by Export Market Analysis (Value & Volume)
- 7.5. Market Analysis, Insights and Forecast - by Price Trend Analysis
- 7.1. Market Analysis, Insights and Forecast - by Production Analysis
- 8. Asia Pacific Distributed Solar Power Generation Market Analysis, Insights and Forecast, 2019-2031
- 8.1. Market Analysis, Insights and Forecast - by Production Analysis
- 8.2. Market Analysis, Insights and Forecast - by Consumption Analysis
- 8.3. Market Analysis, Insights and Forecast - by Import Market Analysis (Value & Volume)
- 8.4. Market Analysis, Insights and Forecast - by Export Market Analysis (Value & Volume)
- 8.5. Market Analysis, Insights and Forecast - by Price Trend Analysis
- 8.1. Market Analysis, Insights and Forecast - by Production Analysis
- 9. South America Distributed Solar Power Generation Market Analysis, Insights and Forecast, 2019-2031
- 9.1. Market Analysis, Insights and Forecast - by Production Analysis
- 9.2. Market Analysis, Insights and Forecast - by Consumption Analysis
- 9.3. Market Analysis, Insights and Forecast - by Import Market Analysis (Value & Volume)
- 9.4. Market Analysis, Insights and Forecast - by Export Market Analysis (Value & Volume)
- 9.5. Market Analysis, Insights and Forecast - by Price Trend Analysis
- 9.1. Market Analysis, Insights and Forecast - by Production Analysis
- 10. Middle East and Africa Distributed Solar Power Generation Market Analysis, Insights and Forecast, 2019-2031
- 10.1. Market Analysis, Insights and Forecast - by Production Analysis
- 10.2. Market Analysis, Insights and Forecast - by Consumption Analysis
- 10.3. Market Analysis, Insights and Forecast - by Import Market Analysis (Value & Volume)
- 10.4. Market Analysis, Insights and Forecast - by Export Market Analysis (Value & Volume)
- 10.5. Market Analysis, Insights and Forecast - by Price Trend Analysis
- 10.1. Market Analysis, Insights and Forecast - by Production Analysis
- 11. North America Distributed Solar Power Generation Market Analysis, Insights and Forecast, 2019-2031
- 11.1. Market Analysis, Insights and Forecast - By Country/Sub-region
- 11.1.1 United States
- 11.1.2 Canada
- 11.1.3 Mexico
- 12. Europe Distributed Solar Power Generation Market Analysis, Insights and Forecast, 2019-2031
- 12.1. Market Analysis, Insights and Forecast - By Country/Sub-region
- 12.1.1 Germany
- 12.1.2 United Kingdom
- 12.1.3 France
- 12.1.4 Spain
- 12.1.5 Italy
- 12.1.6 Spain
- 12.1.7 Belgium
- 12.1.8 Netherland
- 12.1.9 Nordics
- 12.1.10 Rest of Europe
- 13. Asia Pacific Distributed Solar Power Generation Market Analysis, Insights and Forecast, 2019-2031
- 13.1. Market Analysis, Insights and Forecast - By Country/Sub-region
- 13.1.1 China
- 13.1.2 Japan
- 13.1.3 India
- 13.1.4 South Korea
- 13.1.5 Southeast Asia
- 13.1.6 Australia
- 13.1.7 Indonesia
- 13.1.8 Phillipes
- 13.1.9 Singapore
- 13.1.10 Thailandc
- 13.1.11 Rest of Asia Pacific
- 14. South America Distributed Solar Power Generation Market Analysis, Insights and Forecast, 2019-2031
- 14.1. Market Analysis, Insights and Forecast - By Country/Sub-region
- 14.1.1 Brazil
- 14.1.2 Argentina
- 14.1.3 Peru
- 14.1.4 Chile
- 14.1.5 Colombia
- 14.1.6 Ecuador
- 14.1.7 Venezuela
- 14.1.8 Rest of South America
- 15. North America Distributed Solar Power Generation Market Analysis, Insights and Forecast, 2019-2031
- 15.1. Market Analysis, Insights and Forecast - By Country/Sub-region
- 15.1.1 United States
- 15.1.2 Canada
- 15.1.3 Mexico
- 16. MEA Distributed Solar Power Generation Market Analysis, Insights and Forecast, 2019-2031
- 16.1. Market Analysis, Insights and Forecast - By Country/Sub-region
- 16.1.1 United Arab Emirates
- 16.1.2 Saudi Arabia
- 16.1.3 South Africa
- 16.1.4 Rest of Middle East and Africa
- 17. Competitive Analysis
- 17.1. Global Market Share Analysis 2024
- 17.2. Company Profiles
- 17.2.1 First Solar Inc
- 17.2.1.1. Overview
- 17.2.1.2. Products
- 17.2.1.3. SWOT Analysis
- 17.2.1.4. Recent Developments
- 17.2.1.5. Financials (Based on Availability)
- 17.2.2 Activ solar Schweiz Gmbh
- 17.2.2.1. Overview
- 17.2.2.2. Products
- 17.2.2.3. SWOT Analysis
- 17.2.2.4. Recent Developments
- 17.2.2.5. Financials (Based on Availability)
- 17.2.3 Sharp Solar Energy Solutions Group
- 17.2.3.1. Overview
- 17.2.3.2. Products
- 17.2.3.3. SWOT Analysis
- 17.2.3.4. Recent Developments
- 17.2.3.5. Financials (Based on Availability)
- 17.2.4 Yingli Energy Developent Co Ltd
- 17.2.4.1. Overview
- 17.2.4.2. Products
- 17.2.4.3. SWOT Analysis
- 17.2.4.4. Recent Developments
- 17.2.4.5. Financials (Based on Availability)
- 17.2.5 Suntech Power Holdings Co Ltd
- 17.2.5.1. Overview
- 17.2.5.2. Products
- 17.2.5.3. SWOT Analysis
- 17.2.5.4. Recent Developments
- 17.2.5.5. Financials (Based on Availability)
- 17.2.6 Canadian Solar Inc
- 17.2.6.1. Overview
- 17.2.6.2. Products
- 17.2.6.3. SWOT Analysis
- 17.2.6.4. Recent Developments
- 17.2.6.5. Financials (Based on Availability)
- 17.2.7 Tesla Inc
- 17.2.7.1. Overview
- 17.2.7.2. Products
- 17.2.7.3. SWOT Analysis
- 17.2.7.4. Recent Developments
- 17.2.7.5. Financials (Based on Availability)
- 17.2.8 JinkoSolar Holding Co Ltd *List Not Exhaustive
- 17.2.8.1. Overview
- 17.2.8.2. Products
- 17.2.8.3. SWOT Analysis
- 17.2.8.4. Recent Developments
- 17.2.8.5. Financials (Based on Availability)
- 17.2.9 Trina Solar Limited
- 17.2.9.1. Overview
- 17.2.9.2. Products
- 17.2.9.3. SWOT Analysis
- 17.2.9.4. Recent Developments
- 17.2.9.5. Financials (Based on Availability)
- 17.2.1 First Solar Inc
List of Figures
- Figure 1: Global Distributed Solar Power Generation Market Revenue Breakdown (Million, %) by Region 2024 & 2032
- Figure 2: North America Distributed Solar Power Generation Market Revenue (Million), by Country 2024 & 2032
- Figure 3: North America Distributed Solar Power Generation Market Revenue Share (%), by Country 2024 & 2032
- Figure 4: Europe Distributed Solar Power Generation Market Revenue (Million), by Country 2024 & 2032
- Figure 5: Europe Distributed Solar Power Generation Market Revenue Share (%), by Country 2024 & 2032
- Figure 6: Asia Pacific Distributed Solar Power Generation Market Revenue (Million), by Country 2024 & 2032
- Figure 7: Asia Pacific Distributed Solar Power Generation Market Revenue Share (%), by Country 2024 & 2032
- Figure 8: South America Distributed Solar Power Generation Market Revenue (Million), by Country 2024 & 2032
- Figure 9: South America Distributed Solar Power Generation Market Revenue Share (%), by Country 2024 & 2032
- Figure 10: North America Distributed Solar Power Generation Market Revenue (Million), by Country 2024 & 2032
- Figure 11: North America Distributed Solar Power Generation Market Revenue Share (%), by Country 2024 & 2032
- Figure 12: MEA Distributed Solar Power Generation Market Revenue (Million), by Country 2024 & 2032
- Figure 13: MEA Distributed Solar Power Generation Market Revenue Share (%), by Country 2024 & 2032
- Figure 14: North America Distributed Solar Power Generation Market Revenue (Million), by Production Analysis 2024 & 2032
- Figure 15: North America Distributed Solar Power Generation Market Revenue Share (%), by Production Analysis 2024 & 2032
- Figure 16: North America Distributed Solar Power Generation Market Revenue (Million), by Consumption Analysis 2024 & 2032
- Figure 17: North America Distributed Solar Power Generation Market Revenue Share (%), by Consumption Analysis 2024 & 2032
- Figure 18: North America Distributed Solar Power Generation Market Revenue (Million), by Import Market Analysis (Value & Volume) 2024 & 2032
- Figure 19: North America Distributed Solar Power Generation Market Revenue Share (%), by Import Market Analysis (Value & Volume) 2024 & 2032
- Figure 20: North America Distributed Solar Power Generation Market Revenue (Million), by Export Market Analysis (Value & Volume) 2024 & 2032
- Figure 21: North America Distributed Solar Power Generation Market Revenue Share (%), by Export Market Analysis (Value & Volume) 2024 & 2032
- Figure 22: North America Distributed Solar Power Generation Market Revenue (Million), by Price Trend Analysis 2024 & 2032
- Figure 23: North America Distributed Solar Power Generation Market Revenue Share (%), by Price Trend Analysis 2024 & 2032
- Figure 24: North America Distributed Solar Power Generation Market Revenue (Million), by Country 2024 & 2032
- Figure 25: North America Distributed Solar Power Generation Market Revenue Share (%), by Country 2024 & 2032
- Figure 26: Europe Distributed Solar Power Generation Market Revenue (Million), by Production Analysis 2024 & 2032
- Figure 27: Europe Distributed Solar Power Generation Market Revenue Share (%), by Production Analysis 2024 & 2032
- Figure 28: Europe Distributed Solar Power Generation Market Revenue (Million), by Consumption Analysis 2024 & 2032
- Figure 29: Europe Distributed Solar Power Generation Market Revenue Share (%), by Consumption Analysis 2024 & 2032
- Figure 30: Europe Distributed Solar Power Generation Market Revenue (Million), by Import Market Analysis (Value & Volume) 2024 & 2032
- Figure 31: Europe Distributed Solar Power Generation Market Revenue Share (%), by Import Market Analysis (Value & Volume) 2024 & 2032
- Figure 32: Europe Distributed Solar Power Generation Market Revenue (Million), by Export Market Analysis (Value & Volume) 2024 & 2032
- Figure 33: Europe Distributed Solar Power Generation Market Revenue Share (%), by Export Market Analysis (Value & Volume) 2024 & 2032
- Figure 34: Europe Distributed Solar Power Generation Market Revenue (Million), by Price Trend Analysis 2024 & 2032
- Figure 35: Europe Distributed Solar Power Generation Market Revenue Share (%), by Price Trend Analysis 2024 & 2032
- Figure 36: Europe Distributed Solar Power Generation Market Revenue (Million), by Country 2024 & 2032
- Figure 37: Europe Distributed Solar Power Generation Market Revenue Share (%), by Country 2024 & 2032
- Figure 38: Asia Pacific Distributed Solar Power Generation Market Revenue (Million), by Production Analysis 2024 & 2032
- Figure 39: Asia Pacific Distributed Solar Power Generation Market Revenue Share (%), by Production Analysis 2024 & 2032
- Figure 40: Asia Pacific Distributed Solar Power Generation Market Revenue (Million), by Consumption Analysis 2024 & 2032
- Figure 41: Asia Pacific Distributed Solar Power Generation Market Revenue Share (%), by Consumption Analysis 2024 & 2032
- Figure 42: Asia Pacific Distributed Solar Power Generation Market Revenue (Million), by Import Market Analysis (Value & Volume) 2024 & 2032
- Figure 43: Asia Pacific Distributed Solar Power Generation Market Revenue Share (%), by Import Market Analysis (Value & Volume) 2024 & 2032
- Figure 44: Asia Pacific Distributed Solar Power Generation Market Revenue (Million), by Export Market Analysis (Value & Volume) 2024 & 2032
- Figure 45: Asia Pacific Distributed Solar Power Generation Market Revenue Share (%), by Export Market Analysis (Value & Volume) 2024 & 2032
- Figure 46: Asia Pacific Distributed Solar Power Generation Market Revenue (Million), by Price Trend Analysis 2024 & 2032
- Figure 47: Asia Pacific Distributed Solar Power Generation Market Revenue Share (%), by Price Trend Analysis 2024 & 2032
- Figure 48: Asia Pacific Distributed Solar Power Generation Market Revenue (Million), by Country 2024 & 2032
- Figure 49: Asia Pacific Distributed Solar Power Generation Market Revenue Share (%), by Country 2024 & 2032
- Figure 50: South America Distributed Solar Power Generation Market Revenue (Million), by Production Analysis 2024 & 2032
- Figure 51: South America Distributed Solar Power Generation Market Revenue Share (%), by Production Analysis 2024 & 2032
- Figure 52: South America Distributed Solar Power Generation Market Revenue (Million), by Consumption Analysis 2024 & 2032
- Figure 53: South America Distributed Solar Power Generation Market Revenue Share (%), by Consumption Analysis 2024 & 2032
- Figure 54: South America Distributed Solar Power Generation Market Revenue (Million), by Import Market Analysis (Value & Volume) 2024 & 2032
- Figure 55: South America Distributed Solar Power Generation Market Revenue Share (%), by Import Market Analysis (Value & Volume) 2024 & 2032
- Figure 56: South America Distributed Solar Power Generation Market Revenue (Million), by Export Market Analysis (Value & Volume) 2024 & 2032
- Figure 57: South America Distributed Solar Power Generation Market Revenue Share (%), by Export Market Analysis (Value & Volume) 2024 & 2032
- Figure 58: South America Distributed Solar Power Generation Market Revenue (Million), by Price Trend Analysis 2024 & 2032
- Figure 59: South America Distributed Solar Power Generation Market Revenue Share (%), by Price Trend Analysis 2024 & 2032
- Figure 60: South America Distributed Solar Power Generation Market Revenue (Million), by Country 2024 & 2032
- Figure 61: South America Distributed Solar Power Generation Market Revenue Share (%), by Country 2024 & 2032
- Figure 62: Middle East and Africa Distributed Solar Power Generation Market Revenue (Million), by Production Analysis 2024 & 2032
- Figure 63: Middle East and Africa Distributed Solar Power Generation Market Revenue Share (%), by Production Analysis 2024 & 2032
- Figure 64: Middle East and Africa Distributed Solar Power Generation Market Revenue (Million), by Consumption Analysis 2024 & 2032
- Figure 65: Middle East and Africa Distributed Solar Power Generation Market Revenue Share (%), by Consumption Analysis 2024 & 2032
- Figure 66: Middle East and Africa Distributed Solar Power Generation Market Revenue (Million), by Import Market Analysis (Value & Volume) 2024 & 2032
- Figure 67: Middle East and Africa Distributed Solar Power Generation Market Revenue Share (%), by Import Market Analysis (Value & Volume) 2024 & 2032
- Figure 68: Middle East and Africa Distributed Solar Power Generation Market Revenue (Million), by Export Market Analysis (Value & Volume) 2024 & 2032
- Figure 69: Middle East and Africa Distributed Solar Power Generation Market Revenue Share (%), by Export Market Analysis (Value & Volume) 2024 & 2032
- Figure 70: Middle East and Africa Distributed Solar Power Generation Market Revenue (Million), by Price Trend Analysis 2024 & 2032
- Figure 71: Middle East and Africa Distributed Solar Power Generation Market Revenue Share (%), by Price Trend Analysis 2024 & 2032
- Figure 72: Middle East and Africa Distributed Solar Power Generation Market Revenue (Million), by Country 2024 & 2032
- Figure 73: Middle East and Africa Distributed Solar Power Generation Market Revenue Share (%), by Country 2024 & 2032
List of Tables
- Table 1: Global Distributed Solar Power Generation Market Revenue Million Forecast, by Region 2019 & 2032
- Table 2: Global Distributed Solar Power Generation Market Revenue Million Forecast, by Production Analysis 2019 & 2032
- Table 3: Global Distributed Solar Power Generation Market Revenue Million Forecast, by Consumption Analysis 2019 & 2032
- Table 4: Global Distributed Solar Power Generation Market Revenue Million Forecast, by Import Market Analysis (Value & Volume) 2019 & 2032
- Table 5: Global Distributed Solar Power Generation Market Revenue Million Forecast, by Export Market Analysis (Value & Volume) 2019 & 2032
- Table 6: Global Distributed Solar Power Generation Market Revenue Million Forecast, by Price Trend Analysis 2019 & 2032
- Table 7: Global Distributed Solar Power Generation Market Revenue Million Forecast, by Region 2019 & 2032
- Table 8: Global Distributed Solar Power Generation Market Revenue Million Forecast, by Country 2019 & 2032
- Table 9: United States Distributed Solar Power Generation Market Revenue (Million) Forecast, by Application 2019 & 2032
- Table 10: Canada Distributed Solar Power Generation Market Revenue (Million) Forecast, by Application 2019 & 2032
- Table 11: Mexico Distributed Solar Power Generation Market Revenue (Million) Forecast, by Application 2019 & 2032
- Table 12: Global Distributed Solar Power Generation Market Revenue Million Forecast, by Country 2019 & 2032
- Table 13: Germany Distributed Solar Power Generation Market Revenue (Million) Forecast, by Application 2019 & 2032
- Table 14: United Kingdom Distributed Solar Power Generation Market Revenue (Million) Forecast, by Application 2019 & 2032
- Table 15: France Distributed Solar Power Generation Market Revenue (Million) Forecast, by Application 2019 & 2032
- Table 16: Spain Distributed Solar Power Generation Market Revenue (Million) Forecast, by Application 2019 & 2032
- Table 17: Italy Distributed Solar Power Generation Market Revenue (Million) Forecast, by Application 2019 & 2032
- Table 18: Spain Distributed Solar Power Generation Market Revenue (Million) Forecast, by Application 2019 & 2032
- Table 19: Belgium Distributed Solar Power Generation Market Revenue (Million) Forecast, by Application 2019 & 2032
- Table 20: Netherland Distributed Solar Power Generation Market Revenue (Million) Forecast, by Application 2019 & 2032
- Table 21: Nordics Distributed Solar Power Generation Market Revenue (Million) Forecast, by Application 2019 & 2032
- Table 22: Rest of Europe Distributed Solar Power Generation Market Revenue (Million) Forecast, by Application 2019 & 2032
- Table 23: Global Distributed Solar Power Generation Market Revenue Million Forecast, by Country 2019 & 2032
- Table 24: China Distributed Solar Power Generation Market Revenue (Million) Forecast, by Application 2019 & 2032
- Table 25: Japan Distributed Solar Power Generation Market Revenue (Million) Forecast, by Application 2019 & 2032
- Table 26: India Distributed Solar Power Generation Market Revenue (Million) Forecast, by Application 2019 & 2032
- Table 27: South Korea Distributed Solar Power Generation Market Revenue (Million) Forecast, by Application 2019 & 2032
- Table 28: Southeast Asia Distributed Solar Power Generation Market Revenue (Million) Forecast, by Application 2019 & 2032
- Table 29: Australia Distributed Solar Power Generation Market Revenue (Million) Forecast, by Application 2019 & 2032
- Table 30: Indonesia Distributed Solar Power Generation Market Revenue (Million) Forecast, by Application 2019 & 2032
- Table 31: Phillipes Distributed Solar Power Generation Market Revenue (Million) Forecast, by Application 2019 & 2032
- Table 32: Singapore Distributed Solar Power Generation Market Revenue (Million) Forecast, by Application 2019 & 2032
- Table 33: Thailandc Distributed Solar Power Generation Market Revenue (Million) Forecast, by Application 2019 & 2032
- Table 34: Rest of Asia Pacific Distributed Solar Power Generation Market Revenue (Million) Forecast, by Application 2019 & 2032
- Table 35: Global Distributed Solar Power Generation Market Revenue Million Forecast, by Country 2019 & 2032
- Table 36: Brazil Distributed Solar Power Generation Market Revenue (Million) Forecast, by Application 2019 & 2032
- Table 37: Argentina Distributed Solar Power Generation Market Revenue (Million) Forecast, by Application 2019 & 2032
- Table 38: Peru Distributed Solar Power Generation Market Revenue (Million) Forecast, by Application 2019 & 2032
- Table 39: Chile Distributed Solar Power Generation Market Revenue (Million) Forecast, by Application 2019 & 2032
- Table 40: Colombia Distributed Solar Power Generation Market Revenue (Million) Forecast, by Application 2019 & 2032
- Table 41: Ecuador Distributed Solar Power Generation Market Revenue (Million) Forecast, by Application 2019 & 2032
- Table 42: Venezuela Distributed Solar Power Generation Market Revenue (Million) Forecast, by Application 2019 & 2032
- Table 43: Rest of South America Distributed Solar Power Generation Market Revenue (Million) Forecast, by Application 2019 & 2032
- Table 44: Global Distributed Solar Power Generation Market Revenue Million Forecast, by Country 2019 & 2032
- Table 45: United States Distributed Solar Power Generation Market Revenue (Million) Forecast, by Application 2019 & 2032
- Table 46: Canada Distributed Solar Power Generation Market Revenue (Million) Forecast, by Application 2019 & 2032
- Table 47: Mexico Distributed Solar Power Generation Market Revenue (Million) Forecast, by Application 2019 & 2032
- Table 48: Global Distributed Solar Power Generation Market Revenue Million Forecast, by Country 2019 & 2032
- Table 49: United Arab Emirates Distributed Solar Power Generation Market Revenue (Million) Forecast, by Application 2019 & 2032
- Table 50: Saudi Arabia Distributed Solar Power Generation Market Revenue (Million) Forecast, by Application 2019 & 2032
- Table 51: South Africa Distributed Solar Power Generation Market Revenue (Million) Forecast, by Application 2019 & 2032
- Table 52: Rest of Middle East and Africa Distributed Solar Power Generation Market Revenue (Million) Forecast, by Application 2019 & 2032
- Table 53: Global Distributed Solar Power Generation Market Revenue Million Forecast, by Production Analysis 2019 & 2032
- Table 54: Global Distributed Solar Power Generation Market Revenue Million Forecast, by Consumption Analysis 2019 & 2032
- Table 55: Global Distributed Solar Power Generation Market Revenue Million Forecast, by Import Market Analysis (Value & Volume) 2019 & 2032
- Table 56: Global Distributed Solar Power Generation Market Revenue Million Forecast, by Export Market Analysis (Value & Volume) 2019 & 2032
- Table 57: Global Distributed Solar Power Generation Market Revenue Million Forecast, by Price Trend Analysis 2019 & 2032
- Table 58: Global Distributed Solar Power Generation Market Revenue Million Forecast, by Country 2019 & 2032
- Table 59: Global Distributed Solar Power Generation Market Revenue Million Forecast, by Production Analysis 2019 & 2032
- Table 60: Global Distributed Solar Power Generation Market Revenue Million Forecast, by Consumption Analysis 2019 & 2032
- Table 61: Global Distributed Solar Power Generation Market Revenue Million Forecast, by Import Market Analysis (Value & Volume) 2019 & 2032
- Table 62: Global Distributed Solar Power Generation Market Revenue Million Forecast, by Export Market Analysis (Value & Volume) 2019 & 2032
- Table 63: Global Distributed Solar Power Generation Market Revenue Million Forecast, by Price Trend Analysis 2019 & 2032
- Table 64: Global Distributed Solar Power Generation Market Revenue Million Forecast, by Country 2019 & 2032
- Table 65: Global Distributed Solar Power Generation Market Revenue Million Forecast, by Production Analysis 2019 & 2032
- Table 66: Global Distributed Solar Power Generation Market Revenue Million Forecast, by Consumption Analysis 2019 & 2032
- Table 67: Global Distributed Solar Power Generation Market Revenue Million Forecast, by Import Market Analysis (Value & Volume) 2019 & 2032
- Table 68: Global Distributed Solar Power Generation Market Revenue Million Forecast, by Export Market Analysis (Value & Volume) 2019 & 2032
- Table 69: Global Distributed Solar Power Generation Market Revenue Million Forecast, by Price Trend Analysis 2019 & 2032
- Table 70: Global Distributed Solar Power Generation Market Revenue Million Forecast, by Country 2019 & 2032
- Table 71: Global Distributed Solar Power Generation Market Revenue Million Forecast, by Production Analysis 2019 & 2032
- Table 72: Global Distributed Solar Power Generation Market Revenue Million Forecast, by Consumption Analysis 2019 & 2032
- Table 73: Global Distributed Solar Power Generation Market Revenue Million Forecast, by Import Market Analysis (Value & Volume) 2019 & 2032
- Table 74: Global Distributed Solar Power Generation Market Revenue Million Forecast, by Export Market Analysis (Value & Volume) 2019 & 2032
- Table 75: Global Distributed Solar Power Generation Market Revenue Million Forecast, by Price Trend Analysis 2019 & 2032
- Table 76: Global Distributed Solar Power Generation Market Revenue Million Forecast, by Country 2019 & 2032
- Table 77: Global Distributed Solar Power Generation Market Revenue Million Forecast, by Production Analysis 2019 & 2032
- Table 78: Global Distributed Solar Power Generation Market Revenue Million Forecast, by Consumption Analysis 2019 & 2032
- Table 79: Global Distributed Solar Power Generation Market Revenue Million Forecast, by Import Market Analysis (Value & Volume) 2019 & 2032
- Table 80: Global Distributed Solar Power Generation Market Revenue Million Forecast, by Export Market Analysis (Value & Volume) 2019 & 2032
- Table 81: Global Distributed Solar Power Generation Market Revenue Million Forecast, by Price Trend Analysis 2019 & 2032
- Table 82: Global Distributed Solar Power Generation Market Revenue Million Forecast, by Country 2019 & 2032
Frequently Asked Questions
1. What is the projected Compound Annual Growth Rate (CAGR) of the Distributed Solar Power Generation Market?
The projected CAGR is approximately 6.97%.
2. Which companies are prominent players in the Distributed Solar Power Generation Market?
Key companies in the market include First Solar Inc, Activ solar Schweiz Gmbh, Sharp Solar Energy Solutions Group, Yingli Energy Developent Co Ltd, Suntech Power Holdings Co Ltd, Canadian Solar Inc, Tesla Inc, JinkoSolar Holding Co Ltd *List Not Exhaustive, Trina Solar Limited.
3. What are the main segments of the Distributed Solar Power Generation Market?
The market segments include Production Analysis, Consumption Analysis, Import Market Analysis (Value & Volume), Export Market Analysis (Value & Volume), Price Trend Analysis.
4. Can you provide details about the market size?
The market size is estimated to be USD 149.72 Million as of 2022.
5. What are some drivers contributing to market growth?
4.; Favorable Government Policies4.; Declining Solar Panel Costs.
6. What are the notable trends driving market growth?
Declining Price of Solar PV Systems and Installations Cost Expected to Drive the Market.
7. Are there any restraints impacting market growth?
4.; Development of Alternate Sources of Renewable Energy.
8. Can you provide examples of recent developments in the market?
In May 2022, GreenYellow was awarded a contract to build 8.03 MWp of solar distributed generation (DG) plants to supply power to a pharmacy chain Grupo DPSP in Brazil. It has signed the agreement with Brazil's Grupo DPSP to install 25,000 PV at five locations, three in Sao Paulo, one in Rio de Janeiro, and one in the Federal District. The contract has a term of ten years, during which GreenYellow will supply 15 GWh of power annually to Grupo DPSP. GreenYellow will provide the entire initial investment and take care of the plant's construction, operation, and maintenance (O&M) for the duration of the contract.
9. What pricing options are available for accessing the report?
Pricing options include single-user, multi-user, and enterprise licenses priced at USD 4750, USD 5250, and USD 8750 respectively.
10. Is the market size provided in terms of value or volume?
The market size is provided in terms of value, measured in Million.
11. Are there any specific market keywords associated with the report?
Yes, the market keyword associated with the report is "Distributed Solar Power Generation Market," which aids in identifying and referencing the specific market segment covered.
12. How do I determine which pricing option suits my needs best?
The pricing options vary based on user requirements and access needs. Individual users may opt for single-user licenses, while businesses requiring broader access may choose multi-user or enterprise licenses for cost-effective access to the report.
13. Are there any additional resources or data provided in the Distributed Solar Power Generation Market report?
While the report offers comprehensive insights, it's advisable to review the specific contents or supplementary materials provided to ascertain if additional resources or data are available.
14. How can I stay updated on further developments or reports in the Distributed Solar Power Generation Market?
To stay informed about further developments, trends, and reports in the Distributed Solar Power Generation Market, consider subscribing to industry newsletters, following relevant companies and organizations, or regularly checking reputable industry news sources and publications.
Methodology
Step 1 - Identification of Relevant Samples Size from Population Database


Step 2 - Approaches for Defining Global Market Size (Value, Volume* & Price*)

Note*: In applicable scenarios
Step 3 - Data Sources
Primary Research
- Web Analytics
- Survey Reports
- Research Institute
- Latest Research Reports
- Opinion Leaders
Secondary Research
- Annual Reports
- White Paper
- Latest Press Release
- Industry Association
- Paid Database
- Investor Presentations

Step 4 - Data Triangulation
Involves using different sources of information in order to increase the validity of a study
These sources are likely to be stakeholders in a program - participants, other researchers, program staff, other community members, and so on.
Then we put all data in single framework & apply various statistical tools to find out the dynamic on the market.
During the analysis stage, feedback from the stakeholder groups would be compared to determine areas of agreement as well as areas of divergence


