
Key Insights
The distributed energy generation (DEG) industry is experiencing robust growth, driven by increasing demand for reliable and sustainable energy solutions. A compound annual growth rate (CAGR) exceeding 8% indicates a significant expansion of the market, projected to reach substantial value within the forecast period (2025-2033). Several factors contribute to this growth. Firstly, the rising adoption of renewable energy sources, particularly solar photovoltaic (PV) systems, is a major driver. Governments worldwide are incentivizing renewable energy adoption through subsidies and regulations, making DEG solutions economically viable for both residential and commercial applications. Furthermore, advancements in battery storage technologies are improving the reliability and efficiency of DEG systems, addressing concerns about intermittency associated with solar and wind power. The growing need for energy independence and resilience, particularly in remote areas or regions prone to grid instability, also fuels market expansion. Microgrids, in particular, are gaining traction as they offer localized energy generation and management, enhancing grid stability and reducing reliance on centralized power grids. While the industry faces challenges such as fluctuating energy prices and the need for substantial upfront investment, the long-term benefits of reduced carbon emissions and enhanced energy security outweigh these constraints.
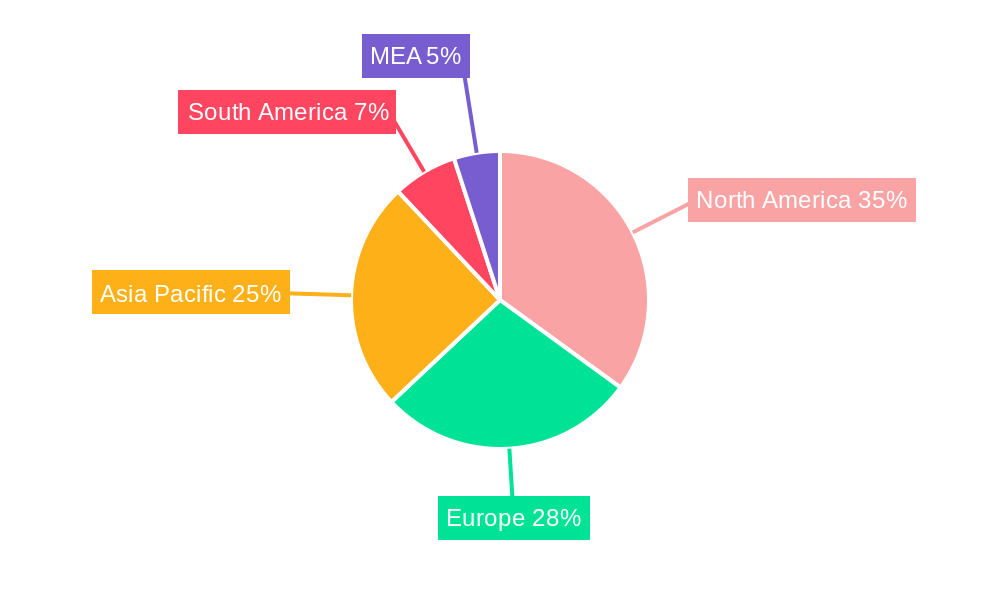
Technological advancements within DEG are diversifying the market landscape. While solar PV remains a dominant technology, the adoption of diesel and natural gas gensets continues, especially in areas with limited grid infrastructure. However, the transition towards cleaner energy sources is accelerating, driven by environmental concerns and government regulations. This transition creates opportunities for emerging technologies such as fuel cells and microgrids that offer greater efficiency and lower emissions. The geographical distribution of the DEG market is largely influenced by government policies, economic conditions, and access to resources. North America, Europe, and Asia Pacific are expected to be leading regions, with significant growth potential in emerging markets across Asia, South America, and the Middle East & Africa. This expansion will be driven by increasing urbanization, industrialization, and the need for decentralized energy systems in these regions. The competitive landscape is characterized by a mix of established players and emerging companies, driving innovation and competition within the DEG sector.
This comprehensive report provides an in-depth analysis of the Distributed Energy Generation (DEG) industry, encompassing market dynamics, growth trends, key players, and future outlook. With a focus on parent market segments like renewable energy and child markets such as solar PV and microgrids, this report is an essential resource for industry professionals, investors, and strategic decision-makers. The study period covers 2019-2033, with 2025 as the base and estimated year.
Distributed Energy Generation Industry Market Dynamics & Structure
This section analyzes the DEG market's competitive landscape, technological advancements, regulatory environment, and market trends. The industry exhibits a moderately fragmented structure, with several major players and numerous smaller niche companies competing. The market is characterized by strong technological innovation driven by the need for cleaner energy sources and improved energy efficiency. Government regulations and incentives significantly influence market growth, while the availability of alternative energy solutions, particularly grid-connected power, presents competitive pressures. Mergers and acquisitions (M&A) activity is moderate, with strategic alliances playing a significant role in consolidating market share.
- Market Concentration: Moderately fragmented, with a top 5 market share of approximately xx%.
- Technological Innovation: Driven by advancements in solar PV, fuel cell technology, and energy storage solutions. Barriers include high initial investment costs and technological complexities.
- Regulatory Frameworks: Government policies and incentives play a crucial role, varying significantly across regions. This includes feed-in tariffs, renewable portfolio standards, and tax credits.
- Competitive Substitutes: Primarily grid-connected power and centralized power generation plants.
- End-User Demographics: Residential, commercial, and industrial sectors are all key end-users, with varying adoption rates based on factors like energy consumption and economic feasibility.
- M&A Trends: Moderate M&A activity, with strategic acquisitions focused on acquiring niche technologies and expanding geographical reach. An estimated xx million USD worth of deals occurred during the historical period.
Distributed Energy Generation Industry Growth Trends & Insights
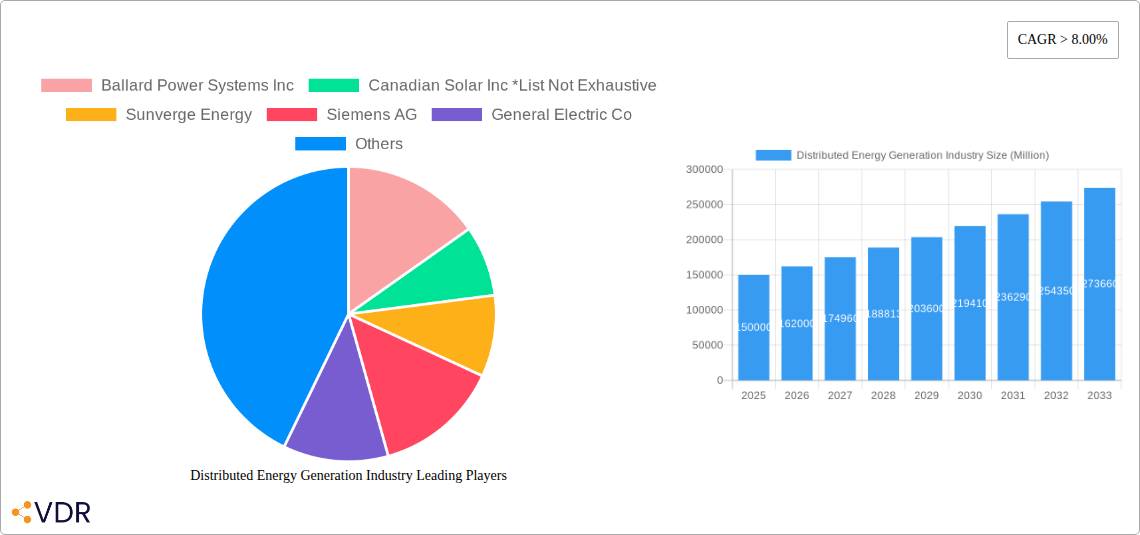
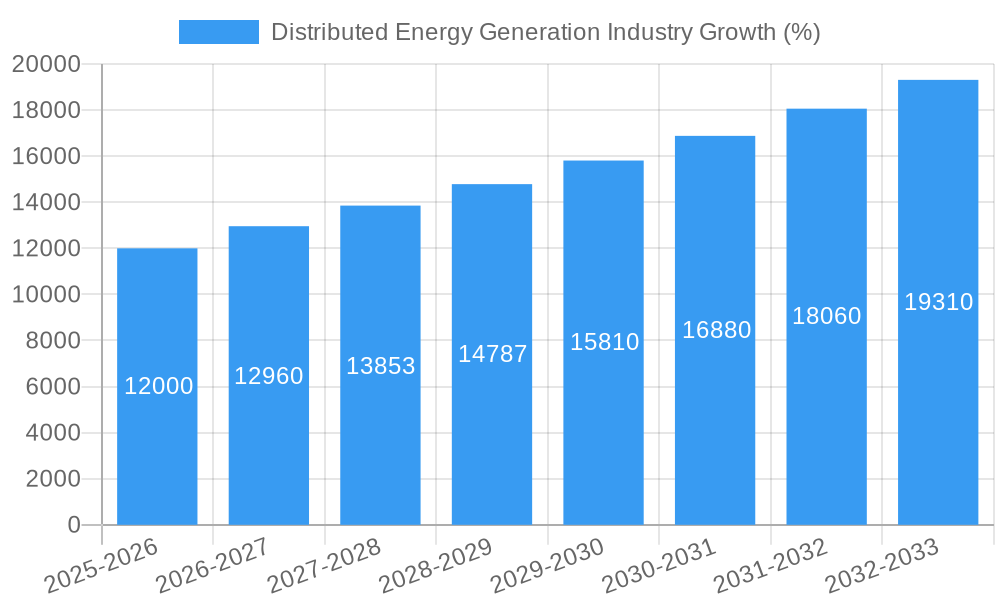
The DEG market has witnessed significant growth driven by increasing electricity demand, rising energy prices, environmental concerns, and supportive government policies. The adoption of distributed generation technologies is accelerating, particularly in regions with favorable regulatory frameworks and high renewable energy potential. Technological disruptions, such as advancements in energy storage and smart grid technologies, further boost market expansion. Consumer behavior is shifting towards greater energy independence and sustainability, driving the demand for on-site power generation solutions. The market is expected to achieve a CAGR of xx% during the forecast period (2025-2033), reaching a market size of xx million USD by 2033. Market penetration of DEG technologies is expected to increase from xx% in 2025 to xx% by 2033.
Dominant Regions, Countries, or Segments in Distributed Energy Generation Industry
The North American and European markets are currently leading the DEG industry, followed by Asia-Pacific. Within the technology segments, Solar PV dominates, driven by decreasing costs and improving efficiency. However, the microgrid segment showcases substantial growth potential due to its ability to provide reliable and resilient power supply.
- Solar PV: Strong growth due to decreasing costs, improving technology, and supportive government policies, accounting for xx% of the market. Key drivers include substantial government subsidies and falling solar panel prices.
- Diesel Gensets: Primarily used in remote areas and backup power applications, this segment is experiencing relatively slower growth compared to renewables.
- Natural Gas Gensets: Maintains a significant market share, especially in regions with abundant natural gas resources, though facing increased competition from renewable sources.
- Microgrids: Experiencing rapid growth driven by increasing demand for reliable and resilient power supply, particularly in developing countries. Key drivers include rising electricity prices and increasing concerns about power outages.
- Other Technologies: This segment includes fuel cells, wind turbines, and other emerging technologies that are expected to contribute to market growth in the long term.
Regions like the U.S. and China are key players, leveraging robust technological advancements and government incentives. The EU is also a significant market, heavily influenced by environmental regulations.
Distributed Energy Generation Industry Product Landscape
The DEG industry offers a wide range of products, including solar PV panels, diesel and natural gas generators, energy storage systems, and microgrid controllers. Recent innovations focus on enhancing efficiency, reducing costs, and improving grid integration. Key advancements include the development of higher-efficiency solar cells, improved battery technology, and advanced control systems for microgrids. Unique selling propositions often focus on reliability, sustainability, and cost savings for end-users.
Key Drivers, Barriers & Challenges in Distributed Energy Generation Industry
Key Drivers:
- Increasing electricity demand and rising energy costs.
- Growing environmental concerns and the push for decarbonization.
- Government policies and incentives promoting renewable energy.
- Technological advancements leading to cost reductions and improved efficiency.
Challenges & Restraints:
- High initial investment costs for some DEG technologies.
- Intermittency of renewable energy sources and the need for effective energy storage solutions.
- Regulatory hurdles and grid integration challenges.
- Competition from traditional centralized power generation. This leads to an estimated xx% loss in market share annually due to price competition.
- Supply chain disruptions leading to material shortages and cost increases.
Emerging Opportunities in Distributed Energy Generation Industry
The DEG market presents several emerging opportunities, including the growth of microgrids in remote areas, the integration of renewable energy sources with energy storage systems, and the development of smart grid technologies. Further opportunities lie in the expansion into untapped markets, particularly in developing countries with limited access to electricity. The integration of DEG systems with electric vehicles and other smart devices also presents a significant avenue for expansion.
Growth Accelerators in the Distributed Energy Generation Industry
Long-term growth will be accelerated by continued technological advancements, particularly in battery storage and energy efficiency. Strategic partnerships between technology providers, energy companies, and policymakers will be critical for market expansion. Furthermore, the development of innovative business models and financing mechanisms will facilitate broader adoption of DEG technologies.
Key Players Shaping the Distributed Energy Generation Industry Market
- Ballard Power Systems Inc
- Canadian Solar Inc
- Sunverge Energy
- Siemens AG
- General Electric Co
- Schneider Electric SE
- Caterpillar Inc
- Fuelcell Energy Inc
- Cummins Inc
- Ansaldo Energia SpA
- Capstone Turbine Corporation
- Bloom Energy
Notable Milestones in Distributed Energy Generation Industry Sector
- December 2022: Phase 2 of the grid-connected rooftop solar scheme commenced by BESCOM in India, with a target capacity of 10 MW.
- November 2022: Michigan's distributed generation program expanded by 37%, adding 3,709 customers and 14,446 installations.
In-Depth Distributed Energy Generation Industry Market Outlook
The DEG market is poised for continued strong growth, driven by a convergence of technological advancements, supportive government policies, and increasing consumer demand for sustainable and reliable energy solutions. Strategic opportunities exist in developing innovative technologies, expanding into new markets, and forging strategic partnerships to accelerate market penetration and unlock the full potential of distributed energy generation. The long-term outlook is positive, with significant growth potential across various regions and technology segments.
Distributed Energy Generation Industry Segmentation
-
1. Technology
- 1.1. Solar PV
- 1.2. Diesel Gensets
- 1.3. Natural Gas Gensets
- 1.4. Microgrids
- 1.5. Other Technologies
Distributed Energy Generation Industry Segmentation By Geography
- 1. North America
- 2. Europe
- 3. Asia Pacific
- 4. South America
- 5. Middle East and Africa
Distributed Energy Generation Industry REPORT HIGHLIGHTS
| Aspects | Details |
|---|---|
| Study Period | 2019-2033 |
| Base Year | 2024 |
| Estimated Year | 2025 |
| Forecast Period | 2025-2033 |
| Historical Period | 2019-2024 |
| Growth Rate | CAGR of > 8.00% from 2019-2033 |
| Segmentation |
|
Table of Contents
- 1. Introduction
- 1.1. Research Scope
- 1.2. Market Segmentation
- 1.3. Research Methodology
- 1.4. Definitions and Assumptions
- 2. Executive Summary
- 2.1. Introduction
- 3. Market Dynamics
- 3.1. Introduction
- 3.2. Market Drivers
- 3.2.1. 4.; Global Energy Transition Toward Renewables4.; The Rollout of New Technologies in Many Developed Countries
- 3.3. Market Restrains
- 3.3.1. 4.; The Technology's Exorbitant Costs and Environmental Impacts
- 3.4. Market Trends
- 3.4.1. Solar PV to Dominate the Market
- 4. Market Factor Analysis
- 4.1. Porters Five Forces
- 4.2. Supply/Value Chain
- 4.3. PESTEL analysis
- 4.4. Market Entropy
- 4.5. Patent/Trademark Analysis
- 5. Global Distributed Energy Generation Industry Analysis, Insights and Forecast, 2019-2031
- 5.1. Market Analysis, Insights and Forecast - by Technology
- 5.1.1. Solar PV
- 5.1.2. Diesel Gensets
- 5.1.3. Natural Gas Gensets
- 5.1.4. Microgrids
- 5.1.5. Other Technologies
- 5.2. Market Analysis, Insights and Forecast - by Region
- 5.2.1. North America
- 5.2.2. Europe
- 5.2.3. Asia Pacific
- 5.2.4. South America
- 5.2.5. Middle East and Africa
- 5.1. Market Analysis, Insights and Forecast - by Technology
- 6. North America Distributed Energy Generation Industry Analysis, Insights and Forecast, 2019-2031
- 6.1. Market Analysis, Insights and Forecast - by Technology
- 6.1.1. Solar PV
- 6.1.2. Diesel Gensets
- 6.1.3. Natural Gas Gensets
- 6.1.4. Microgrids
- 6.1.5. Other Technologies
- 6.1. Market Analysis, Insights and Forecast - by Technology
- 7. Europe Distributed Energy Generation Industry Analysis, Insights and Forecast, 2019-2031
- 7.1. Market Analysis, Insights and Forecast - by Technology
- 7.1.1. Solar PV
- 7.1.2. Diesel Gensets
- 7.1.3. Natural Gas Gensets
- 7.1.4. Microgrids
- 7.1.5. Other Technologies
- 7.1. Market Analysis, Insights and Forecast - by Technology
- 8. Asia Pacific Distributed Energy Generation Industry Analysis, Insights and Forecast, 2019-2031
- 8.1. Market Analysis, Insights and Forecast - by Technology
- 8.1.1. Solar PV
- 8.1.2. Diesel Gensets
- 8.1.3. Natural Gas Gensets
- 8.1.4. Microgrids
- 8.1.5. Other Technologies
- 8.1. Market Analysis, Insights and Forecast - by Technology
- 9. South America Distributed Energy Generation Industry Analysis, Insights and Forecast, 2019-2031
- 9.1. Market Analysis, Insights and Forecast - by Technology
- 9.1.1. Solar PV
- 9.1.2. Diesel Gensets
- 9.1.3. Natural Gas Gensets
- 9.1.4. Microgrids
- 9.1.5. Other Technologies
- 9.1. Market Analysis, Insights and Forecast - by Technology
- 10. Middle East and Africa Distributed Energy Generation Industry Analysis, Insights and Forecast, 2019-2031
- 10.1. Market Analysis, Insights and Forecast - by Technology
- 10.1.1. Solar PV
- 10.1.2. Diesel Gensets
- 10.1.3. Natural Gas Gensets
- 10.1.4. Microgrids
- 10.1.5. Other Technologies
- 10.1. Market Analysis, Insights and Forecast - by Technology
- 11. North America Distributed Energy Generation Industry Analysis, Insights and Forecast, 2019-2031
- 11.1. Market Analysis, Insights and Forecast - By Country/Sub-region
- 11.1.1 United States
- 11.1.2 Canada
- 11.1.3 Mexico
- 12. Europe Distributed Energy Generation Industry Analysis, Insights and Forecast, 2019-2031
- 12.1. Market Analysis, Insights and Forecast - By Country/Sub-region
- 12.1.1 Germany
- 12.1.2 United Kingdom
- 12.1.3 France
- 12.1.4 Spain
- 12.1.5 Italy
- 12.1.6 Spain
- 12.1.7 Belgium
- 12.1.8 Netherland
- 12.1.9 Nordics
- 12.1.10 Rest of Europe
- 13. Asia Pacific Distributed Energy Generation Industry Analysis, Insights and Forecast, 2019-2031
- 13.1. Market Analysis, Insights and Forecast - By Country/Sub-region
- 13.1.1 China
- 13.1.2 Japan
- 13.1.3 India
- 13.1.4 South Korea
- 13.1.5 Southeast Asia
- 13.1.6 Australia
- 13.1.7 Indonesia
- 13.1.8 Phillipes
- 13.1.9 Singapore
- 13.1.10 Thailandc
- 13.1.11 Rest of Asia Pacific
- 14. South America Distributed Energy Generation Industry Analysis, Insights and Forecast, 2019-2031
- 14.1. Market Analysis, Insights and Forecast - By Country/Sub-region
- 14.1.1 Brazil
- 14.1.2 Argentina
- 14.1.3 Peru
- 14.1.4 Chile
- 14.1.5 Colombia
- 14.1.6 Ecuador
- 14.1.7 Venezuela
- 14.1.8 Rest of South America
- 15. North America Distributed Energy Generation Industry Analysis, Insights and Forecast, 2019-2031
- 15.1. Market Analysis, Insights and Forecast - By Country/Sub-region
- 15.1.1 United States
- 15.1.2 Canada
- 15.1.3 Mexico
- 16. MEA Distributed Energy Generation Industry Analysis, Insights and Forecast, 2019-2031
- 16.1. Market Analysis, Insights and Forecast - By Country/Sub-region
- 16.1.1 United Arab Emirates
- 16.1.2 Saudi Arabia
- 16.1.3 South Africa
- 16.1.4 Rest of Middle East and Africa
- 17. Competitive Analysis
- 17.1. Global Market Share Analysis 2024
- 17.2. Company Profiles
- 17.2.1 Ballard Power Systems Inc
- 17.2.1.1. Overview
- 17.2.1.2. Products
- 17.2.1.3. SWOT Analysis
- 17.2.1.4. Recent Developments
- 17.2.1.5. Financials (Based on Availability)
- 17.2.2 Canadian Solar Inc *List Not Exhaustive
- 17.2.2.1. Overview
- 17.2.2.2. Products
- 17.2.2.3. SWOT Analysis
- 17.2.2.4. Recent Developments
- 17.2.2.5. Financials (Based on Availability)
- 17.2.3 Sunverge Energy
- 17.2.3.1. Overview
- 17.2.3.2. Products
- 17.2.3.3. SWOT Analysis
- 17.2.3.4. Recent Developments
- 17.2.3.5. Financials (Based on Availability)
- 17.2.4 Siemens AG
- 17.2.4.1. Overview
- 17.2.4.2. Products
- 17.2.4.3. SWOT Analysis
- 17.2.4.4. Recent Developments
- 17.2.4.5. Financials (Based on Availability)
- 17.2.5 General Electric Co
- 17.2.5.1. Overview
- 17.2.5.2. Products
- 17.2.5.3. SWOT Analysis
- 17.2.5.4. Recent Developments
- 17.2.5.5. Financials (Based on Availability)
- 17.2.6 Schneider Electric SE
- 17.2.6.1. Overview
- 17.2.6.2. Products
- 17.2.6.3. SWOT Analysis
- 17.2.6.4. Recent Developments
- 17.2.6.5. Financials (Based on Availability)
- 17.2.7 Caterpillar Inc
- 17.2.7.1. Overview
- 17.2.7.2. Products
- 17.2.7.3. SWOT Analysis
- 17.2.7.4. Recent Developments
- 17.2.7.5. Financials (Based on Availability)
- 17.2.8 Fuelcell Energy Inc
- 17.2.8.1. Overview
- 17.2.8.2. Products
- 17.2.8.3. SWOT Analysis
- 17.2.8.4. Recent Developments
- 17.2.8.5. Financials (Based on Availability)
- 17.2.9 Cummins Inc
- 17.2.9.1. Overview
- 17.2.9.2. Products
- 17.2.9.3. SWOT Analysis
- 17.2.9.4. Recent Developments
- 17.2.9.5. Financials (Based on Availability)
- 17.2.10 Ansaldo Energia SpA
- 17.2.10.1. Overview
- 17.2.10.2. Products
- 17.2.10.3. SWOT Analysis
- 17.2.10.4. Recent Developments
- 17.2.10.5. Financials (Based on Availability)
- 17.2.11 Capstone Turbine Corporation
- 17.2.11.1. Overview
- 17.2.11.2. Products
- 17.2.11.3. SWOT Analysis
- 17.2.11.4. Recent Developments
- 17.2.11.5. Financials (Based on Availability)
- 17.2.12 Bloom Energy
- 17.2.12.1. Overview
- 17.2.12.2. Products
- 17.2.12.3. SWOT Analysis
- 17.2.12.4. Recent Developments
- 17.2.12.5. Financials (Based on Availability)
- 17.2.1 Ballard Power Systems Inc
List of Figures
- Figure 1: Global Distributed Energy Generation Industry Revenue Breakdown (Million, %) by Region 2024 & 2032
- Figure 2: North America Distributed Energy Generation Industry Revenue (Million), by Country 2024 & 2032
- Figure 3: North America Distributed Energy Generation Industry Revenue Share (%), by Country 2024 & 2032
- Figure 4: Europe Distributed Energy Generation Industry Revenue (Million), by Country 2024 & 2032
- Figure 5: Europe Distributed Energy Generation Industry Revenue Share (%), by Country 2024 & 2032
- Figure 6: Asia Pacific Distributed Energy Generation Industry Revenue (Million), by Country 2024 & 2032
- Figure 7: Asia Pacific Distributed Energy Generation Industry Revenue Share (%), by Country 2024 & 2032
- Figure 8: South America Distributed Energy Generation Industry Revenue (Million), by Country 2024 & 2032
- Figure 9: South America Distributed Energy Generation Industry Revenue Share (%), by Country 2024 & 2032
- Figure 10: North America Distributed Energy Generation Industry Revenue (Million), by Country 2024 & 2032
- Figure 11: North America Distributed Energy Generation Industry Revenue Share (%), by Country 2024 & 2032
- Figure 12: MEA Distributed Energy Generation Industry Revenue (Million), by Country 2024 & 2032
- Figure 13: MEA Distributed Energy Generation Industry Revenue Share (%), by Country 2024 & 2032
- Figure 14: North America Distributed Energy Generation Industry Revenue (Million), by Technology 2024 & 2032
- Figure 15: North America Distributed Energy Generation Industry Revenue Share (%), by Technology 2024 & 2032
- Figure 16: North America Distributed Energy Generation Industry Revenue (Million), by Country 2024 & 2032
- Figure 17: North America Distributed Energy Generation Industry Revenue Share (%), by Country 2024 & 2032
- Figure 18: Europe Distributed Energy Generation Industry Revenue (Million), by Technology 2024 & 2032
- Figure 19: Europe Distributed Energy Generation Industry Revenue Share (%), by Technology 2024 & 2032
- Figure 20: Europe Distributed Energy Generation Industry Revenue (Million), by Country 2024 & 2032
- Figure 21: Europe Distributed Energy Generation Industry Revenue Share (%), by Country 2024 & 2032
- Figure 22: Asia Pacific Distributed Energy Generation Industry Revenue (Million), by Technology 2024 & 2032
- Figure 23: Asia Pacific Distributed Energy Generation Industry Revenue Share (%), by Technology 2024 & 2032
- Figure 24: Asia Pacific Distributed Energy Generation Industry Revenue (Million), by Country 2024 & 2032
- Figure 25: Asia Pacific Distributed Energy Generation Industry Revenue Share (%), by Country 2024 & 2032
- Figure 26: South America Distributed Energy Generation Industry Revenue (Million), by Technology 2024 & 2032
- Figure 27: South America Distributed Energy Generation Industry Revenue Share (%), by Technology 2024 & 2032
- Figure 28: South America Distributed Energy Generation Industry Revenue (Million), by Country 2024 & 2032
- Figure 29: South America Distributed Energy Generation Industry Revenue Share (%), by Country 2024 & 2032
- Figure 30: Middle East and Africa Distributed Energy Generation Industry Revenue (Million), by Technology 2024 & 2032
- Figure 31: Middle East and Africa Distributed Energy Generation Industry Revenue Share (%), by Technology 2024 & 2032
- Figure 32: Middle East and Africa Distributed Energy Generation Industry Revenue (Million), by Country 2024 & 2032
- Figure 33: Middle East and Africa Distributed Energy Generation Industry Revenue Share (%), by Country 2024 & 2032
List of Tables
- Table 1: Global Distributed Energy Generation Industry Revenue Million Forecast, by Region 2019 & 2032
- Table 2: Global Distributed Energy Generation Industry Revenue Million Forecast, by Technology 2019 & 2032
- Table 3: Global Distributed Energy Generation Industry Revenue Million Forecast, by Region 2019 & 2032
- Table 4: Global Distributed Energy Generation Industry Revenue Million Forecast, by Country 2019 & 2032
- Table 5: United States Distributed Energy Generation Industry Revenue (Million) Forecast, by Application 2019 & 2032
- Table 6: Canada Distributed Energy Generation Industry Revenue (Million) Forecast, by Application 2019 & 2032
- Table 7: Mexico Distributed Energy Generation Industry Revenue (Million) Forecast, by Application 2019 & 2032
- Table 8: Global Distributed Energy Generation Industry Revenue Million Forecast, by Country 2019 & 2032
- Table 9: Germany Distributed Energy Generation Industry Revenue (Million) Forecast, by Application 2019 & 2032
- Table 10: United Kingdom Distributed Energy Generation Industry Revenue (Million) Forecast, by Application 2019 & 2032
- Table 11: France Distributed Energy Generation Industry Revenue (Million) Forecast, by Application 2019 & 2032
- Table 12: Spain Distributed Energy Generation Industry Revenue (Million) Forecast, by Application 2019 & 2032
- Table 13: Italy Distributed Energy Generation Industry Revenue (Million) Forecast, by Application 2019 & 2032
- Table 14: Spain Distributed Energy Generation Industry Revenue (Million) Forecast, by Application 2019 & 2032
- Table 15: Belgium Distributed Energy Generation Industry Revenue (Million) Forecast, by Application 2019 & 2032
- Table 16: Netherland Distributed Energy Generation Industry Revenue (Million) Forecast, by Application 2019 & 2032
- Table 17: Nordics Distributed Energy Generation Industry Revenue (Million) Forecast, by Application 2019 & 2032
- Table 18: Rest of Europe Distributed Energy Generation Industry Revenue (Million) Forecast, by Application 2019 & 2032
- Table 19: Global Distributed Energy Generation Industry Revenue Million Forecast, by Country 2019 & 2032
- Table 20: China Distributed Energy Generation Industry Revenue (Million) Forecast, by Application 2019 & 2032
- Table 21: Japan Distributed Energy Generation Industry Revenue (Million) Forecast, by Application 2019 & 2032
- Table 22: India Distributed Energy Generation Industry Revenue (Million) Forecast, by Application 2019 & 2032
- Table 23: South Korea Distributed Energy Generation Industry Revenue (Million) Forecast, by Application 2019 & 2032
- Table 24: Southeast Asia Distributed Energy Generation Industry Revenue (Million) Forecast, by Application 2019 & 2032
- Table 25: Australia Distributed Energy Generation Industry Revenue (Million) Forecast, by Application 2019 & 2032
- Table 26: Indonesia Distributed Energy Generation Industry Revenue (Million) Forecast, by Application 2019 & 2032
- Table 27: Phillipes Distributed Energy Generation Industry Revenue (Million) Forecast, by Application 2019 & 2032
- Table 28: Singapore Distributed Energy Generation Industry Revenue (Million) Forecast, by Application 2019 & 2032
- Table 29: Thailandc Distributed Energy Generation Industry Revenue (Million) Forecast, by Application 2019 & 2032
- Table 30: Rest of Asia Pacific Distributed Energy Generation Industry Revenue (Million) Forecast, by Application 2019 & 2032
- Table 31: Global Distributed Energy Generation Industry Revenue Million Forecast, by Country 2019 & 2032
- Table 32: Brazil Distributed Energy Generation Industry Revenue (Million) Forecast, by Application 2019 & 2032
- Table 33: Argentina Distributed Energy Generation Industry Revenue (Million) Forecast, by Application 2019 & 2032
- Table 34: Peru Distributed Energy Generation Industry Revenue (Million) Forecast, by Application 2019 & 2032
- Table 35: Chile Distributed Energy Generation Industry Revenue (Million) Forecast, by Application 2019 & 2032
- Table 36: Colombia Distributed Energy Generation Industry Revenue (Million) Forecast, by Application 2019 & 2032
- Table 37: Ecuador Distributed Energy Generation Industry Revenue (Million) Forecast, by Application 2019 & 2032
- Table 38: Venezuela Distributed Energy Generation Industry Revenue (Million) Forecast, by Application 2019 & 2032
- Table 39: Rest of South America Distributed Energy Generation Industry Revenue (Million) Forecast, by Application 2019 & 2032
- Table 40: Global Distributed Energy Generation Industry Revenue Million Forecast, by Country 2019 & 2032
- Table 41: United States Distributed Energy Generation Industry Revenue (Million) Forecast, by Application 2019 & 2032
- Table 42: Canada Distributed Energy Generation Industry Revenue (Million) Forecast, by Application 2019 & 2032
- Table 43: Mexico Distributed Energy Generation Industry Revenue (Million) Forecast, by Application 2019 & 2032
- Table 44: Global Distributed Energy Generation Industry Revenue Million Forecast, by Country 2019 & 2032
- Table 45: United Arab Emirates Distributed Energy Generation Industry Revenue (Million) Forecast, by Application 2019 & 2032
- Table 46: Saudi Arabia Distributed Energy Generation Industry Revenue (Million) Forecast, by Application 2019 & 2032
- Table 47: South Africa Distributed Energy Generation Industry Revenue (Million) Forecast, by Application 2019 & 2032
- Table 48: Rest of Middle East and Africa Distributed Energy Generation Industry Revenue (Million) Forecast, by Application 2019 & 2032
- Table 49: Global Distributed Energy Generation Industry Revenue Million Forecast, by Technology 2019 & 2032
- Table 50: Global Distributed Energy Generation Industry Revenue Million Forecast, by Country 2019 & 2032
- Table 51: Global Distributed Energy Generation Industry Revenue Million Forecast, by Technology 2019 & 2032
- Table 52: Global Distributed Energy Generation Industry Revenue Million Forecast, by Country 2019 & 2032
- Table 53: Global Distributed Energy Generation Industry Revenue Million Forecast, by Technology 2019 & 2032
- Table 54: Global Distributed Energy Generation Industry Revenue Million Forecast, by Country 2019 & 2032
- Table 55: Global Distributed Energy Generation Industry Revenue Million Forecast, by Technology 2019 & 2032
- Table 56: Global Distributed Energy Generation Industry Revenue Million Forecast, by Country 2019 & 2032
- Table 57: Global Distributed Energy Generation Industry Revenue Million Forecast, by Technology 2019 & 2032
- Table 58: Global Distributed Energy Generation Industry Revenue Million Forecast, by Country 2019 & 2032
Frequently Asked Questions
1. What is the projected Compound Annual Growth Rate (CAGR) of the Distributed Energy Generation Industry?
The projected CAGR is approximately > 8.00%.
2. Which companies are prominent players in the Distributed Energy Generation Industry?
Key companies in the market include Ballard Power Systems Inc, Canadian Solar Inc *List Not Exhaustive, Sunverge Energy, Siemens AG, General Electric Co, Schneider Electric SE, Caterpillar Inc, Fuelcell Energy Inc, Cummins Inc, Ansaldo Energia SpA, Capstone Turbine Corporation, Bloom Energy.
3. What are the main segments of the Distributed Energy Generation Industry?
The market segments include Technology.
4. Can you provide details about the market size?
The market size is estimated to be USD XX Million as of 2022.
5. What are some drivers contributing to market growth?
4.; Global Energy Transition Toward Renewables4.; The Rollout of New Technologies in Many Developed Countries.
6. What are the notable trends driving market growth?
Solar PV to Dominate the Market.
7. Are there any restraints impacting market growth?
4.; The Technology's Exorbitant Costs and Environmental Impacts.
8. Can you provide examples of recent developments in the market?
December 2022: Phase 2 of the grid-connected rooftop solar scheme was commenced by Bangalore Electricity Supply Company Limited (BESCOM), which was expected to focus on the installation of solar panels. BESCOM was given a mandate to install 10 MW of capacity by the Union Ministry of New and Renewable Energy (MNRE) to promote distributed energy generation.
9. What pricing options are available for accessing the report?
Pricing options include single-user, multi-user, and enterprise licenses priced at USD 4750, USD 5250, and USD 8750 respectively.
10. Is the market size provided in terms of value or volume?
The market size is provided in terms of value, measured in Million.
11. Are there any specific market keywords associated with the report?
Yes, the market keyword associated with the report is "Distributed Energy Generation Industry," which aids in identifying and referencing the specific market segment covered.
12. How do I determine which pricing option suits my needs best?
The pricing options vary based on user requirements and access needs. Individual users may opt for single-user licenses, while businesses requiring broader access may choose multi-user or enterprise licenses for cost-effective access to the report.
13. Are there any additional resources or data provided in the Distributed Energy Generation Industry report?
While the report offers comprehensive insights, it's advisable to review the specific contents or supplementary materials provided to ascertain if additional resources or data are available.
14. How can I stay updated on further developments or reports in the Distributed Energy Generation Industry?
To stay informed about further developments, trends, and reports in the Distributed Energy Generation Industry, consider subscribing to industry newsletters, following relevant companies and organizations, or regularly checking reputable industry news sources and publications.
Methodology
Step 1 - Identification of Relevant Samples Size from Population Database


Step 2 - Approaches for Defining Global Market Size (Value, Volume* & Price*)

Note*: In applicable scenarios
Step 3 - Data Sources
Primary Research
- Web Analytics
- Survey Reports
- Research Institute
- Latest Research Reports
- Opinion Leaders
Secondary Research
- Annual Reports
- White Paper
- Latest Press Release
- Industry Association
- Paid Database
- Investor Presentations

Step 4 - Data Triangulation
Involves using different sources of information in order to increase the validity of a study
These sources are likely to be stakeholders in a program - participants, other researchers, program staff, other community members, and so on.
Then we put all data in single framework & apply various statistical tools to find out the dynamic on the market.
During the analysis stage, feedback from the stakeholder groups would be compared to determine areas of agreement as well as areas of divergence


