

Key Insights
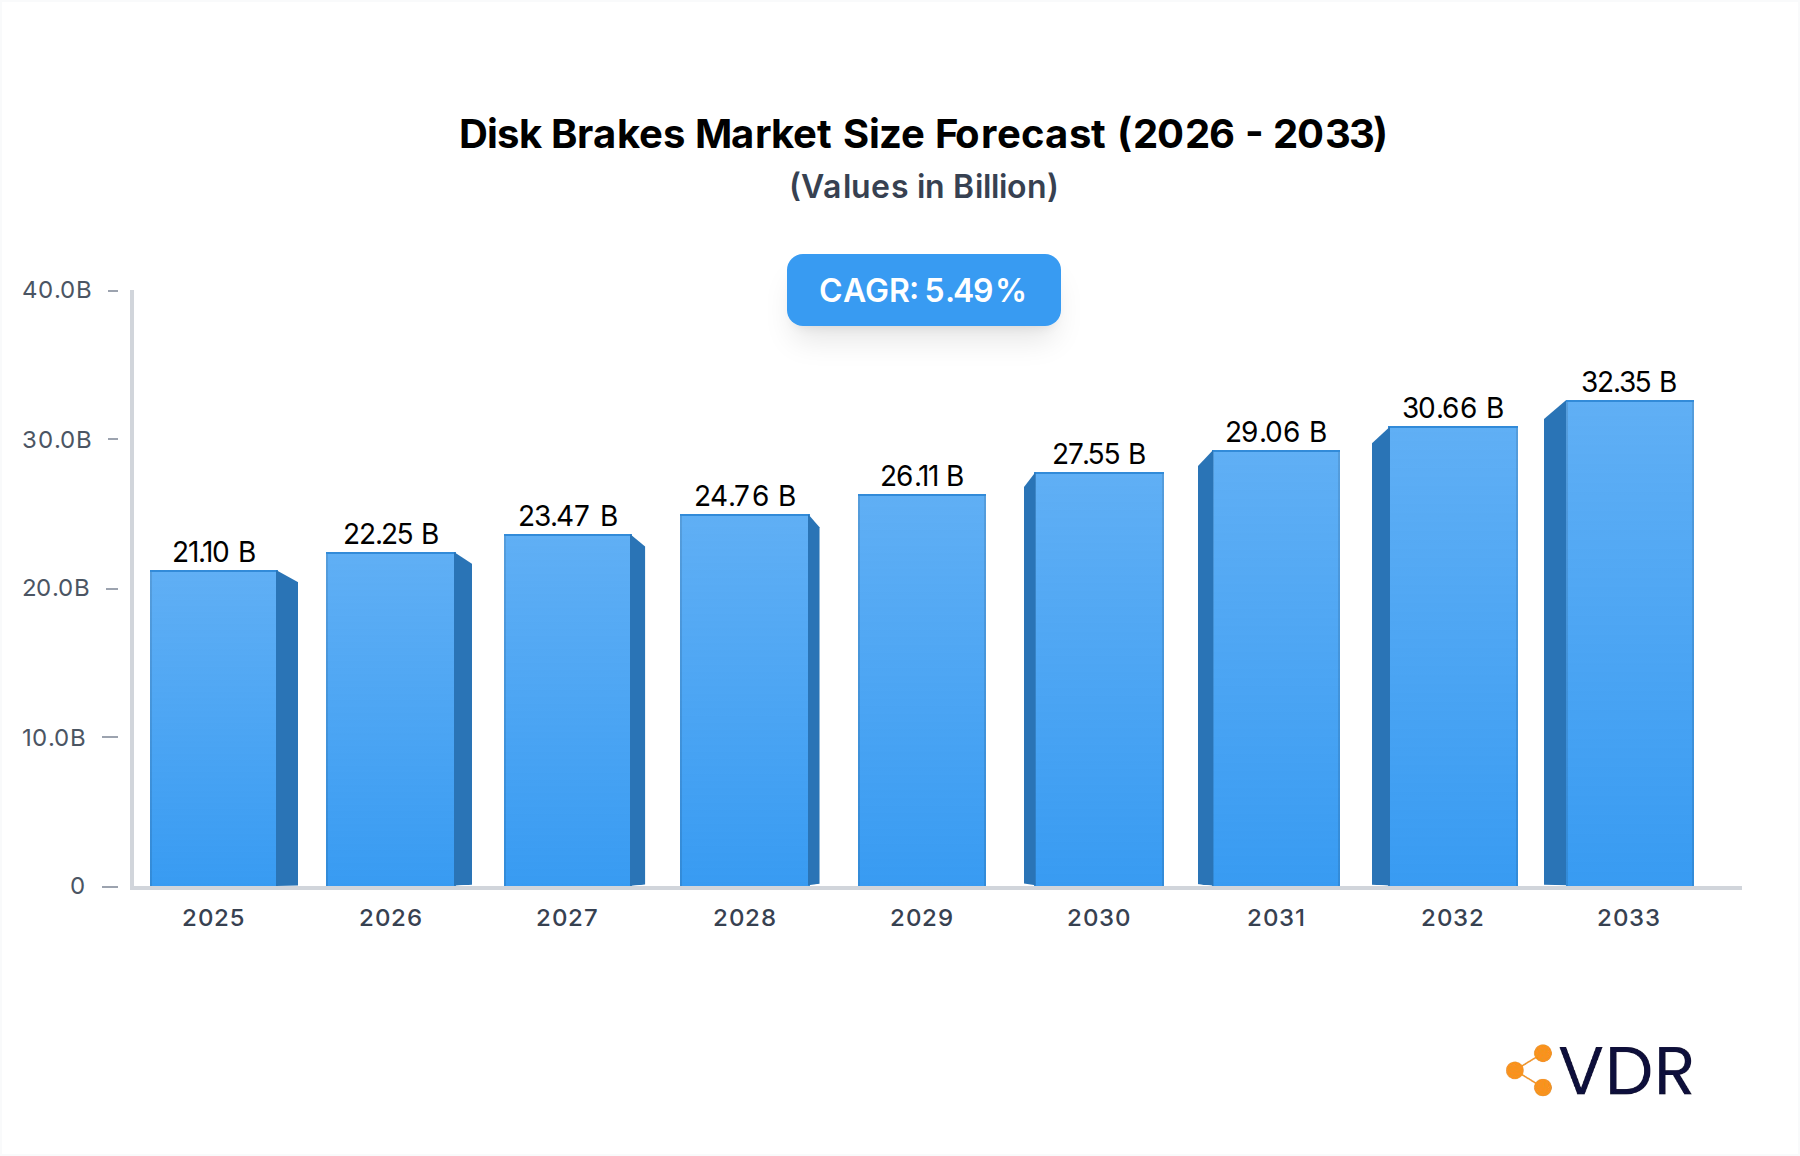
The global disk brake market is poised for robust expansion, projected to reach a significant valuation of $21.1 billion in 2025. This growth trajectory is fueled by a steady Compound Annual Growth Rate (CAGR) of 5.51% over the forecast period of 2025-2033. A primary driver for this market is the increasing global demand for passenger cars, driven by rising disposable incomes and urbanization, especially in emerging economies. Furthermore, stringent vehicle safety regulations worldwide are mandating the adoption of advanced braking systems, including disk brakes, for enhanced performance and reliability. The commercial vehicle segment also contributes substantially, as the expansion of logistics and transportation networks necessitates durable and high-performing braking solutions. Technological advancements, such as the integration of lightweight materials and the development of regenerative braking systems in hybrid and electric vehicles, are further propelling market growth. The increasing sophistication of automotive manufacturing, with a focus on safety and efficiency, ensures a sustained demand for advanced disk brake technologies.

Disk Brakes Market Size (In Billion)
The market for disk brakes is characterized by diverse applications and evolving technological trends. While passenger cars represent a dominant segment, commercial vehicles are a significant growth area. Motorcycles and scooters also contribute to market volume, particularly in regions with high two-wheeler penetration. Emerging applications in rail and aircraft, although smaller in current scale, present future growth opportunities due to the inherent safety demands of these sectors. The market is segmented by type, with floating caliper and opposed piston types being the most prevalent. Innovations in material science, leading to lighter, more durable, and heat-resistant brake components, are key trends. The increasing adoption of electric and hybrid vehicles is also shaping the market, with disk brakes playing a crucial role in their braking systems, often integrated with regenerative braking technologies. Despite the positive outlook, potential restraints include the high cost of advanced braking systems and intense competition among established global players and emerging regional manufacturers.
Disk Brakes Company Market Share
Comprehensive Disk Brakes Market Report: 2019-2033
This in-depth report offers a granular analysis of the global disk brakes market, a critical component across diverse transportation and industrial sectors. Covering the historical period of 2019-2024, base year of 2025, and an extensive forecast period from 2025-2033, this research provides actionable insights for industry stakeholders. The report meticulously examines market dynamics, growth trends, regional dominance, product innovations, key drivers, challenges, emerging opportunities, and the pivotal roles of leading companies. With a focus on automotive disk brakes, commercial vehicle disk brakes, and motorcycle disk brakes, this study is essential for understanding the present landscape and future trajectory of the disk brake industry. The parent market encompasses the broader braking systems industry, while child markets include specific applications like passenger car disk brakes and heavy-duty truck disk brakes.
Disk Brakes Market Dynamics & Structure
The global disk brakes market exhibits a dynamic and evolving structure, characterized by a moderate level of market concentration. Leading players like ZF TRW, Aisin Seiki, Akebono Brake, and Continental hold significant market shares, driven by their established supply chains, technological expertise, and strong relationships with Original Equipment Manufacturers (OEMs). Technological innovation is a primary driver, with continuous advancements in materials science, friction technology, and electronic control systems enhancing braking performance, safety, and fuel efficiency. Regulatory frameworks, particularly concerning vehicle safety standards and emissions, play a crucial role in shaping product development and adoption. Competitive product substitutes, such as drum brakes, remain relevant in certain low-cost segments and niche applications, though disk brakes are increasingly dominating due to their superior performance. End-user demographics are shifting towards greater demand for enhanced safety features and performance across all vehicle types. Mergers and acquisitions (M&A) activity is a notable trend, with companies strategically consolidating to expand their product portfolios, gain access to new markets, and enhance their technological capabilities. For instance, there have been approximately 15-20 significant M&A deals in the braking systems sector over the last five years.
- Market Concentration: Moderate, with top 5 companies holding around 55-60% of the global market share.
- Technological Innovation Drivers: Enhanced stopping power, reduced wear, improved heat dissipation, integration with Advanced Driver-Assistance Systems (ADAS).
- Regulatory Frameworks: Strict safety mandates (e.g., UNECE R13H for passenger cars, ECE R13 for commercial vehicles), environmental regulations impacting material usage.
- Competitive Product Substitutes: Drum brakes, retarders (in heavy-duty applications).
- End-User Demographics: Increasing consumer preference for safety and performance, aging vehicle fleets in developed nations requiring component replacements.
- M&A Trends: Strategic acquisitions to secure technological patents, expand geographical reach, and vertical integration.
Disk Brakes Growth Trends & Insights
The disk brakes market is poised for robust growth, fueled by increasing vehicle production, stringent safety regulations, and the growing adoption of advanced braking technologies. The global market size for disk brakes is projected to reach approximately $75.8 billion by 2025, with a projected Compound Annual Growth Rate (CAGR) of 5.2% from 2019 to 2033. This growth is underpinned by rising demand for passenger cars and commercial vehicles globally, particularly in emerging economies where vehicle ownership is on the rise. Technological disruptions are continuously enhancing the capabilities of disk brake systems, with a focus on lighter materials, more efficient caliper designs, and the integration of regenerative braking systems in electric and hybrid vehicles. Consumer behavior is also shifting, with an increasing emphasis on safety features and the perceived value of advanced braking performance. Market penetration of disk brakes in the passenger car segment is already high, exceeding 95% in most developed markets, and is steadily increasing in the commercial vehicle sector. The motorcycle and scooter segment also shows consistent growth, driven by increasing personal mobility needs in urban areas. The Rail and Aircraft segment, while smaller in volume, demands highly specialized and robust disk brake solutions, contributing to innovation and higher-value market segments.
- Market Size Evolution: From an estimated $68.5 billion in 2019 to a projected $75.8 billion in 2025.
- Adoption Rates: High adoption in passenger cars; increasing penetration in commercial vehicles and motorcycles.
- Technological Disruptions: Electrification driving demand for integrated braking systems, advancements in carbon-ceramic materials for high-performance applications.
- Consumer Behavior Shifts: Growing demand for ADAS-enabled braking, preference for quieter and smoother braking operations.
- CAGR: Approximately 5.2% during the study period (2019-2033).
- Market Penetration: Exceeding 95% in passenger cars in developed regions.
Dominant Regions, Countries, or Segments in Disk Brakes
The Passenger Cars segment stands as the dominant force within the global disk brakes market, driven by sheer volume of production and a consistent demand for enhanced safety and performance. This segment is projected to account for approximately 65-70% of the total market value in 2025. Asia-Pacific, particularly China, is the leading region for both production and consumption of disk brakes, propelled by its massive automotive manufacturing base and a rapidly expanding middle class driving vehicle sales. North America and Europe follow closely, characterized by mature markets with a high focus on advanced safety features and aftermarket replacements. The dominance of passenger cars is further amplified by stringent safety regulations implemented by governments worldwide, mandating advanced braking systems. The widespread adoption of disk brakes in this segment is also attributed to their cost-effectiveness, reliability, and superior performance compared to traditional braking systems. The Floating Caliper Type is the most prevalent disk brake type within the passenger car segment due to its cost-efficiency and effective performance for everyday driving conditions. Economic policies fostering automotive manufacturing and infrastructure development in emerging economies further bolster the growth of this segment.
- Dominant Application Segment: Passenger Cars, contributing over 68% of the market value.
- Leading Region: Asia-Pacific, driven by China's automotive dominance.
- Key Drivers in Passenger Cars: High vehicle production volumes, stringent safety standards, increasing consumer demand for performance and safety.
- Market Share in Passenger Cars: Estimated at $51.5 billion in 2025.
- Growth Potential in Passenger Cars: Steady growth driven by new vehicle sales and aftermarket demand.
- Dominant Caliper Type: Floating Caliper Type, due to its cost-effectiveness and widespread application.
- Regional Dominance Factors: Manufacturing capabilities, regulatory mandates, disposable income, urbanization.
Disk Brakes Product Landscape
The product landscape of disk brakes is characterized by continuous innovation aimed at enhancing performance, durability, and sustainability. Innovations include the development of lighter and stronger rotor materials, advanced ceramic-composite brake pads for reduced dust and improved thermal management, and sophisticated caliper designs that offer enhanced clamping force and responsiveness. These advancements cater to a wide array of applications, from the demanding environments of high-performance vehicles and commercial trucks to the efficiency needs of electric and hybrid cars. Performance metrics such as stopping distance, fade resistance, and wear life are continuously being improved. Unique selling propositions often lie in the integration of smart technologies, such as predictive maintenance sensors and self-adjusting mechanisms, which elevate the safety and convenience of disk brake systems. The trend towards electric vehicles is also driving the development of integrated braking systems that combine regenerative braking with friction braking for optimal energy recovery and performance.
Key Drivers, Barriers & Challenges in Disk Brakes
Key Drivers:
- Rising Vehicle Production: Global increase in automotive manufacturing, especially in emerging economies, directly boosts demand for disk brakes.
- Stringent Safety Regulations: Mandates for advanced braking systems and improved stopping performance drive adoption of superior disk brake technology.
- Technological Advancements: Innovations in materials, designs, and integration with ADAS enhance performance and appeal.
- Growth of Electric and Hybrid Vehicles: These vehicles often require specialized braking systems, including advanced disk brakes for optimal energy management.
Barriers & Challenges:
- Raw Material Price Volatility: Fluctuations in the cost of materials like iron, aluminum, and specialized alloys can impact manufacturing costs and profitability.
- Intense Competition: A crowded market with established players and emerging manufacturers leads to price pressures and innovation challenges.
- Supply Chain Disruptions: Geopolitical events, natural disasters, and logistics issues can disrupt the availability of critical components and raw materials.
- Development Costs for New Technologies: Significant R&D investment is required for advanced materials and integrated systems, posing a barrier for smaller companies.
- Recycling and Disposal Concerns: Environmental regulations regarding the disposal and recycling of brake pad materials, particularly those containing heavy metals, present an ongoing challenge.
Emerging Opportunities in Disk Brakes
Emerging opportunities in the disk brakes market lie in the burgeoning demand for advanced braking solutions in the rapidly growing electric vehicle (EV) sector. The development of specialized disk brakes for EVs, focusing on weight reduction, regenerative braking integration, and quiet operation, presents a significant growth avenue. Furthermore, the aftermarket segment for high-performance and specialized disk brakes, catering to automotive enthusiasts and motorsports, continues to expand. Untapped markets in developing regions, where vehicle ownership is projected to rise significantly, offer substantial potential for market penetration. Innovative applications in the micromobility sector, such as electric scooters and e-bikes, are also creating new demand for compact and efficient disk brake systems.
Growth Accelerators in the Disk Brakes Industry
Several catalysts are accelerating the growth of the disk brakes industry. Technological breakthroughs in lightweight materials, such as advanced aluminum alloys and carbon fiber composites, are enabling the production of lighter and more efficient disk brake systems, contributing to improved vehicle fuel economy. Strategic partnerships between brake manufacturers and automotive OEMs are crucial for co-development and integration of next-generation braking technologies. Market expansion strategies, focusing on penetrating emerging economies with tailored product offerings, are further driving growth. The increasing adoption of automation in manufacturing processes is also improving production efficiency and reducing costs, making disk brakes more accessible.
Key Players Shaping the Disk Brakes Market
- ZF TRW
- Aisin Seiki
- Akebono Brake
- CBI
- Brembo
- Continental
- APG
- Mando
- Knorr-Bremse
- Nissin Kogyo
- Wabco
- Haldex
- Shandong Aoyou
- Hayes Disc Brake
- Knott Brake
- SRAM
- Sheldon Brown
- EBC Brakes
- SilverBack HD
- Ausco Products
- Eaton
- PJ Trailers
- AL-KO
- Meritor
Notable Milestones in Disk Brakes Sector
- 2019: Introduction of enhanced regenerative braking systems integrated with disk brakes for mainstream EVs.
- 2020: Increased focus on lightweight materials and eco-friendly brake pad formulations due to growing environmental concerns.
- 2021: Significant M&A activity as larger players consolidate to gain market share and technological advantages.
- 2022: Advancements in sensor technology for predictive maintenance and real-time performance monitoring of disk brake systems.
- 2023: Growing adoption of electric park brakes (EPB) integrated with disk brake systems in passenger cars.
- 2024: Intensified research and development into next-generation friction materials for higher performance and lower wear.
In-Depth Disk Brakes Market Outlook
The outlook for the disk brakes market remains exceptionally positive, driven by persistent demand across all vehicle segments and continuous technological evolution. Growth accelerators such as increasing vehicle electrification, stringent safety mandates, and a rising global middle class will continue to fuel market expansion. Strategic partnerships and investments in R&D will be pivotal for companies to capitalize on emerging opportunities, particularly in the EV and advanced driver-assistance systems (ADAS) integration spaces. The market is expected to witness further consolidation and innovation as players strive to meet the evolving demands for safer, more efficient, and sustainable braking solutions. The parent market for braking systems will continue to see disk brakes as the primary growth engine.
Disk Brakes Segmentation
-
1. Application
- 1.1. Passenger Cars
- 1.2. Commercial Vehicles
- 1.3. Motocycles and Scooters
- 1.4. Rail and Aircraft
- 1.5. Other
-
2. Type
- 2.1. Opposed Piston Type
- 2.2. Floating Caliper Type
Disk Brakes Segmentation By Geography
-
1. North America
- 1.1. United States
- 1.2. Canada
- 1.3. Mexico
-
2. South America
- 2.1. Brazil
- 2.2. Argentina
- 2.3. Rest of South America
-
3. Europe
- 3.1. United Kingdom
- 3.2. Germany
- 3.3. France
- 3.4. Italy
- 3.5. Spain
- 3.6. Russia
- 3.7. Benelux
- 3.8. Nordics
- 3.9. Rest of Europe
-
4. Middle East & Africa
- 4.1. Turkey
- 4.2. Israel
- 4.3. GCC
- 4.4. North Africa
- 4.5. South Africa
- 4.6. Rest of Middle East & Africa
-
5. Asia Pacific
- 5.1. China
- 5.2. India
- 5.3. Japan
- 5.4. South Korea
- 5.5. ASEAN
- 5.6. Oceania
- 5.7. Rest of Asia Pacific
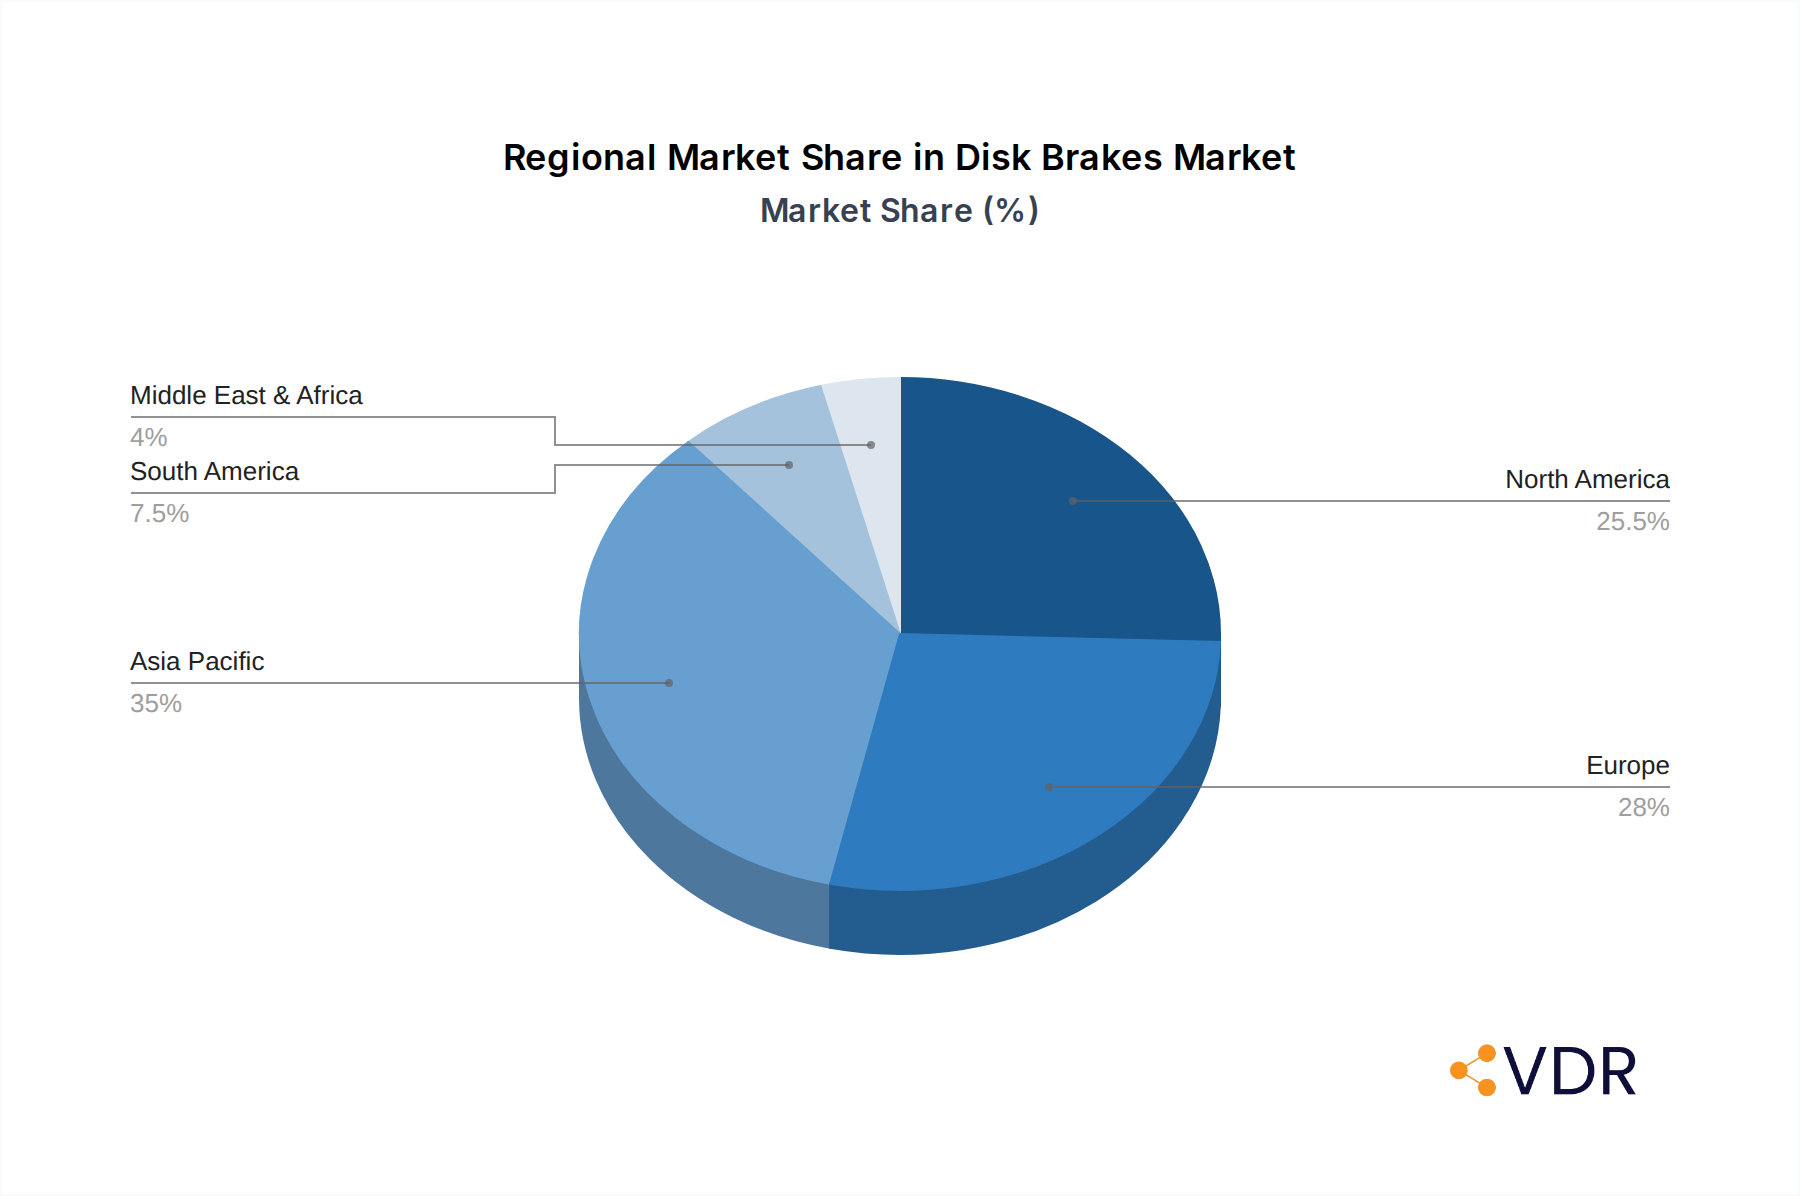
Disk Brakes Regional Market Share
Geographic Coverage of Disk Brakes
Disk Brakes REPORT HIGHLIGHTS
| Aspects | Details |
|---|---|
| Study Period | 2020-2034 |
| Base Year | 2025 |
| Estimated Year | 2026 |
| Forecast Period | 2026-2034 |
| Historical Period | 2020-2025 |
| Growth Rate | CAGR of 5.51% from 2020-2034 |
| Segmentation |
|
Table of Contents
- 1. Introduction
- 1.1. Research Scope
- 1.2. Market Segmentation
- 1.3. Research Methodology
- 1.4. Definitions and Assumptions
- 2. Executive Summary
- 2.1. Introduction
- 3. Market Dynamics
- 3.1. Introduction
- 3.2. Market Drivers
- 3.3. Market Restrains
- 3.4. Market Trends
- 4. Market Factor Analysis
- 4.1. Porters Five Forces
- 4.2. Supply/Value Chain
- 4.3. PESTEL analysis
- 4.4. Market Entropy
- 4.5. Patent/Trademark Analysis
- 5. Global Disk Brakes Analysis, Insights and Forecast, 2020-2032
- 5.1. Market Analysis, Insights and Forecast - by Application
- 5.1.1. Passenger Cars
- 5.1.2. Commercial Vehicles
- 5.1.3. Motocycles and Scooters
- 5.1.4. Rail and Aircraft
- 5.1.5. Other
- 5.2. Market Analysis, Insights and Forecast - by Type
- 5.2.1. Opposed Piston Type
- 5.2.2. Floating Caliper Type
- 5.3. Market Analysis, Insights and Forecast - by Region
- 5.3.1. North America
- 5.3.2. South America
- 5.3.3. Europe
- 5.3.4. Middle East & Africa
- 5.3.5. Asia Pacific
- 5.1. Market Analysis, Insights and Forecast - by Application
- 6. North America Disk Brakes Analysis, Insights and Forecast, 2020-2032
- 6.1. Market Analysis, Insights and Forecast - by Application
- 6.1.1. Passenger Cars
- 6.1.2. Commercial Vehicles
- 6.1.3. Motocycles and Scooters
- 6.1.4. Rail and Aircraft
- 6.1.5. Other
- 6.2. Market Analysis, Insights and Forecast - by Type
- 6.2.1. Opposed Piston Type
- 6.2.2. Floating Caliper Type
- 6.1. Market Analysis, Insights and Forecast - by Application
- 7. South America Disk Brakes Analysis, Insights and Forecast, 2020-2032
- 7.1. Market Analysis, Insights and Forecast - by Application
- 7.1.1. Passenger Cars
- 7.1.2. Commercial Vehicles
- 7.1.3. Motocycles and Scooters
- 7.1.4. Rail and Aircraft
- 7.1.5. Other
- 7.2. Market Analysis, Insights and Forecast - by Type
- 7.2.1. Opposed Piston Type
- 7.2.2. Floating Caliper Type
- 7.1. Market Analysis, Insights and Forecast - by Application
- 8. Europe Disk Brakes Analysis, Insights and Forecast, 2020-2032
- 8.1. Market Analysis, Insights and Forecast - by Application
- 8.1.1. Passenger Cars
- 8.1.2. Commercial Vehicles
- 8.1.3. Motocycles and Scooters
- 8.1.4. Rail and Aircraft
- 8.1.5. Other
- 8.2. Market Analysis, Insights and Forecast - by Type
- 8.2.1. Opposed Piston Type
- 8.2.2. Floating Caliper Type
- 8.1. Market Analysis, Insights and Forecast - by Application
- 9. Middle East & Africa Disk Brakes Analysis, Insights and Forecast, 2020-2032
- 9.1. Market Analysis, Insights and Forecast - by Application
- 9.1.1. Passenger Cars
- 9.1.2. Commercial Vehicles
- 9.1.3. Motocycles and Scooters
- 9.1.4. Rail and Aircraft
- 9.1.5. Other
- 9.2. Market Analysis, Insights and Forecast - by Type
- 9.2.1. Opposed Piston Type
- 9.2.2. Floating Caliper Type
- 9.1. Market Analysis, Insights and Forecast - by Application
- 10. Asia Pacific Disk Brakes Analysis, Insights and Forecast, 2020-2032
- 10.1. Market Analysis, Insights and Forecast - by Application
- 10.1.1. Passenger Cars
- 10.1.2. Commercial Vehicles
- 10.1.3. Motocycles and Scooters
- 10.1.4. Rail and Aircraft
- 10.1.5. Other
- 10.2. Market Analysis, Insights and Forecast - by Type
- 10.2.1. Opposed Piston Type
- 10.2.2. Floating Caliper Type
- 10.1. Market Analysis, Insights and Forecast - by Application
- 11. Competitive Analysis
- 11.1. Global Market Share Analysis 2025
- 11.2. Company Profiles
- 11.2.1 ZF TRW
- 11.2.1.1. Overview
- 11.2.1.2. Products
- 11.2.1.3. SWOT Analysis
- 11.2.1.4. Recent Developments
- 11.2.1.5. Financials (Based on Availability)
- 11.2.2 Aisin Seiki
- 11.2.2.1. Overview
- 11.2.2.2. Products
- 11.2.2.3. SWOT Analysis
- 11.2.2.4. Recent Developments
- 11.2.2.5. Financials (Based on Availability)
- 11.2.3 Akebono Brake
- 11.2.3.1. Overview
- 11.2.3.2. Products
- 11.2.3.3. SWOT Analysis
- 11.2.3.4. Recent Developments
- 11.2.3.5. Financials (Based on Availability)
- 11.2.4 CBI
- 11.2.4.1. Overview
- 11.2.4.2. Products
- 11.2.4.3. SWOT Analysis
- 11.2.4.4. Recent Developments
- 11.2.4.5. Financials (Based on Availability)
- 11.2.5 Brembo
- 11.2.5.1. Overview
- 11.2.5.2. Products
- 11.2.5.3. SWOT Analysis
- 11.2.5.4. Recent Developments
- 11.2.5.5. Financials (Based on Availability)
- 11.2.6 Continental
- 11.2.6.1. Overview
- 11.2.6.2. Products
- 11.2.6.3. SWOT Analysis
- 11.2.6.4. Recent Developments
- 11.2.6.5. Financials (Based on Availability)
- 11.2.7 APG
- 11.2.7.1. Overview
- 11.2.7.2. Products
- 11.2.7.3. SWOT Analysis
- 11.2.7.4. Recent Developments
- 11.2.7.5. Financials (Based on Availability)
- 11.2.8 Mando
- 11.2.8.1. Overview
- 11.2.8.2. Products
- 11.2.8.3. SWOT Analysis
- 11.2.8.4. Recent Developments
- 11.2.8.5. Financials (Based on Availability)
- 11.2.9 Knorr-Bremse
- 11.2.9.1. Overview
- 11.2.9.2. Products
- 11.2.9.3. SWOT Analysis
- 11.2.9.4. Recent Developments
- 11.2.9.5. Financials (Based on Availability)
- 11.2.10 Nissin Kogyo
- 11.2.10.1. Overview
- 11.2.10.2. Products
- 11.2.10.3. SWOT Analysis
- 11.2.10.4. Recent Developments
- 11.2.10.5. Financials (Based on Availability)
- 11.2.11 Wabco
- 11.2.11.1. Overview
- 11.2.11.2. Products
- 11.2.11.3. SWOT Analysis
- 11.2.11.4. Recent Developments
- 11.2.11.5. Financials (Based on Availability)
- 11.2.12 Haldex
- 11.2.12.1. Overview
- 11.2.12.2. Products
- 11.2.12.3. SWOT Analysis
- 11.2.12.4. Recent Developments
- 11.2.12.5. Financials (Based on Availability)
- 11.2.13 Shandong Aoyou
- 11.2.13.1. Overview
- 11.2.13.2. Products
- 11.2.13.3. SWOT Analysis
- 11.2.13.4. Recent Developments
- 11.2.13.5. Financials (Based on Availability)
- 11.2.14 Hayes Disc Brake
- 11.2.14.1. Overview
- 11.2.14.2. Products
- 11.2.14.3. SWOT Analysis
- 11.2.14.4. Recent Developments
- 11.2.14.5. Financials (Based on Availability)
- 11.2.15 Knott Brake
- 11.2.15.1. Overview
- 11.2.15.2. Products
- 11.2.15.3. SWOT Analysis
- 11.2.15.4. Recent Developments
- 11.2.15.5. Financials (Based on Availability)
- 11.2.16 SRAM
- 11.2.16.1. Overview
- 11.2.16.2. Products
- 11.2.16.3. SWOT Analysis
- 11.2.16.4. Recent Developments
- 11.2.16.5. Financials (Based on Availability)
- 11.2.17 Sheldon Brown
- 11.2.17.1. Overview
- 11.2.17.2. Products
- 11.2.17.3. SWOT Analysis
- 11.2.17.4. Recent Developments
- 11.2.17.5. Financials (Based on Availability)
- 11.2.18 EBC Brakes
- 11.2.18.1. Overview
- 11.2.18.2. Products
- 11.2.18.3. SWOT Analysis
- 11.2.18.4. Recent Developments
- 11.2.18.5. Financials (Based on Availability)
- 11.2.19 SilverBack HD
- 11.2.19.1. Overview
- 11.2.19.2. Products
- 11.2.19.3. SWOT Analysis
- 11.2.19.4. Recent Developments
- 11.2.19.5. Financials (Based on Availability)
- 11.2.20 Ausco Products
- 11.2.20.1. Overview
- 11.2.20.2. Products
- 11.2.20.3. SWOT Analysis
- 11.2.20.4. Recent Developments
- 11.2.20.5. Financials (Based on Availability)
- 11.2.21 Eaton
- 11.2.21.1. Overview
- 11.2.21.2. Products
- 11.2.21.3. SWOT Analysis
- 11.2.21.4. Recent Developments
- 11.2.21.5. Financials (Based on Availability)
- 11.2.22 PJ Trailers
- 11.2.22.1. Overview
- 11.2.22.2. Products
- 11.2.22.3. SWOT Analysis
- 11.2.22.4. Recent Developments
- 11.2.22.5. Financials (Based on Availability)
- 11.2.23 AL-KO
- 11.2.23.1. Overview
- 11.2.23.2. Products
- 11.2.23.3. SWOT Analysis
- 11.2.23.4. Recent Developments
- 11.2.23.5. Financials (Based on Availability)
- 11.2.24 Meritor
- 11.2.24.1. Overview
- 11.2.24.2. Products
- 11.2.24.3. SWOT Analysis
- 11.2.24.4. Recent Developments
- 11.2.24.5. Financials (Based on Availability)
- 11.2.1 ZF TRW
List of Figures
- Figure 1: Global Disk Brakes Revenue Breakdown (undefined, %) by Region 2025 & 2033
- Figure 2: North America Disk Brakes Revenue (undefined), by Application 2025 & 2033
- Figure 3: North America Disk Brakes Revenue Share (%), by Application 2025 & 2033
- Figure 4: North America Disk Brakes Revenue (undefined), by Type 2025 & 2033
- Figure 5: North America Disk Brakes Revenue Share (%), by Type 2025 & 2033
- Figure 6: North America Disk Brakes Revenue (undefined), by Country 2025 & 2033
- Figure 7: North America Disk Brakes Revenue Share (%), by Country 2025 & 2033
- Figure 8: South America Disk Brakes Revenue (undefined), by Application 2025 & 2033
- Figure 9: South America Disk Brakes Revenue Share (%), by Application 2025 & 2033
- Figure 10: South America Disk Brakes Revenue (undefined), by Type 2025 & 2033
- Figure 11: South America Disk Brakes Revenue Share (%), by Type 2025 & 2033
- Figure 12: South America Disk Brakes Revenue (undefined), by Country 2025 & 2033
- Figure 13: South America Disk Brakes Revenue Share (%), by Country 2025 & 2033
- Figure 14: Europe Disk Brakes Revenue (undefined), by Application 2025 & 2033
- Figure 15: Europe Disk Brakes Revenue Share (%), by Application 2025 & 2033
- Figure 16: Europe Disk Brakes Revenue (undefined), by Type 2025 & 2033
- Figure 17: Europe Disk Brakes Revenue Share (%), by Type 2025 & 2033
- Figure 18: Europe Disk Brakes Revenue (undefined), by Country 2025 & 2033
- Figure 19: Europe Disk Brakes Revenue Share (%), by Country 2025 & 2033
- Figure 20: Middle East & Africa Disk Brakes Revenue (undefined), by Application 2025 & 2033
- Figure 21: Middle East & Africa Disk Brakes Revenue Share (%), by Application 2025 & 2033
- Figure 22: Middle East & Africa Disk Brakes Revenue (undefined), by Type 2025 & 2033
- Figure 23: Middle East & Africa Disk Brakes Revenue Share (%), by Type 2025 & 2033
- Figure 24: Middle East & Africa Disk Brakes Revenue (undefined), by Country 2025 & 2033
- Figure 25: Middle East & Africa Disk Brakes Revenue Share (%), by Country 2025 & 2033
- Figure 26: Asia Pacific Disk Brakes Revenue (undefined), by Application 2025 & 2033
- Figure 27: Asia Pacific Disk Brakes Revenue Share (%), by Application 2025 & 2033
- Figure 28: Asia Pacific Disk Brakes Revenue (undefined), by Type 2025 & 2033
- Figure 29: Asia Pacific Disk Brakes Revenue Share (%), by Type 2025 & 2033
- Figure 30: Asia Pacific Disk Brakes Revenue (undefined), by Country 2025 & 2033
- Figure 31: Asia Pacific Disk Brakes Revenue Share (%), by Country 2025 & 2033
List of Tables
- Table 1: Global Disk Brakes Revenue undefined Forecast, by Application 2020 & 2033
- Table 2: Global Disk Brakes Revenue undefined Forecast, by Type 2020 & 2033
- Table 3: Global Disk Brakes Revenue undefined Forecast, by Region 2020 & 2033
- Table 4: Global Disk Brakes Revenue undefined Forecast, by Application 2020 & 2033
- Table 5: Global Disk Brakes Revenue undefined Forecast, by Type 2020 & 2033
- Table 6: Global Disk Brakes Revenue undefined Forecast, by Country 2020 & 2033
- Table 7: United States Disk Brakes Revenue (undefined) Forecast, by Application 2020 & 2033
- Table 8: Canada Disk Brakes Revenue (undefined) Forecast, by Application 2020 & 2033
- Table 9: Mexico Disk Brakes Revenue (undefined) Forecast, by Application 2020 & 2033
- Table 10: Global Disk Brakes Revenue undefined Forecast, by Application 2020 & 2033
- Table 11: Global Disk Brakes Revenue undefined Forecast, by Type 2020 & 2033
- Table 12: Global Disk Brakes Revenue undefined Forecast, by Country 2020 & 2033
- Table 13: Brazil Disk Brakes Revenue (undefined) Forecast, by Application 2020 & 2033
- Table 14: Argentina Disk Brakes Revenue (undefined) Forecast, by Application 2020 & 2033
- Table 15: Rest of South America Disk Brakes Revenue (undefined) Forecast, by Application 2020 & 2033
- Table 16: Global Disk Brakes Revenue undefined Forecast, by Application 2020 & 2033
- Table 17: Global Disk Brakes Revenue undefined Forecast, by Type 2020 & 2033
- Table 18: Global Disk Brakes Revenue undefined Forecast, by Country 2020 & 2033
- Table 19: United Kingdom Disk Brakes Revenue (undefined) Forecast, by Application 2020 & 2033
- Table 20: Germany Disk Brakes Revenue (undefined) Forecast, by Application 2020 & 2033
- Table 21: France Disk Brakes Revenue (undefined) Forecast, by Application 2020 & 2033
- Table 22: Italy Disk Brakes Revenue (undefined) Forecast, by Application 2020 & 2033
- Table 23: Spain Disk Brakes Revenue (undefined) Forecast, by Application 2020 & 2033
- Table 24: Russia Disk Brakes Revenue (undefined) Forecast, by Application 2020 & 2033
- Table 25: Benelux Disk Brakes Revenue (undefined) Forecast, by Application 2020 & 2033
- Table 26: Nordics Disk Brakes Revenue (undefined) Forecast, by Application 2020 & 2033
- Table 27: Rest of Europe Disk Brakes Revenue (undefined) Forecast, by Application 2020 & 2033
- Table 28: Global Disk Brakes Revenue undefined Forecast, by Application 2020 & 2033
- Table 29: Global Disk Brakes Revenue undefined Forecast, by Type 2020 & 2033
- Table 30: Global Disk Brakes Revenue undefined Forecast, by Country 2020 & 2033
- Table 31: Turkey Disk Brakes Revenue (undefined) Forecast, by Application 2020 & 2033
- Table 32: Israel Disk Brakes Revenue (undefined) Forecast, by Application 2020 & 2033
- Table 33: GCC Disk Brakes Revenue (undefined) Forecast, by Application 2020 & 2033
- Table 34: North Africa Disk Brakes Revenue (undefined) Forecast, by Application 2020 & 2033
- Table 35: South Africa Disk Brakes Revenue (undefined) Forecast, by Application 2020 & 2033
- Table 36: Rest of Middle East & Africa Disk Brakes Revenue (undefined) Forecast, by Application 2020 & 2033
- Table 37: Global Disk Brakes Revenue undefined Forecast, by Application 2020 & 2033
- Table 38: Global Disk Brakes Revenue undefined Forecast, by Type 2020 & 2033
- Table 39: Global Disk Brakes Revenue undefined Forecast, by Country 2020 & 2033
- Table 40: China Disk Brakes Revenue (undefined) Forecast, by Application 2020 & 2033
- Table 41: India Disk Brakes Revenue (undefined) Forecast, by Application 2020 & 2033
- Table 42: Japan Disk Brakes Revenue (undefined) Forecast, by Application 2020 & 2033
- Table 43: South Korea Disk Brakes Revenue (undefined) Forecast, by Application 2020 & 2033
- Table 44: ASEAN Disk Brakes Revenue (undefined) Forecast, by Application 2020 & 2033
- Table 45: Oceania Disk Brakes Revenue (undefined) Forecast, by Application 2020 & 2033
- Table 46: Rest of Asia Pacific Disk Brakes Revenue (undefined) Forecast, by Application 2020 & 2033
Frequently Asked Questions
1. What is the projected Compound Annual Growth Rate (CAGR) of the Disk Brakes?
The projected CAGR is approximately 5.51%.
2. Which companies are prominent players in the Disk Brakes?
Key companies in the market include ZF TRW, Aisin Seiki, Akebono Brake, CBI, Brembo, Continental, APG, Mando, Knorr-Bremse, Nissin Kogyo, Wabco, Haldex, Shandong Aoyou, Hayes Disc Brake, Knott Brake, SRAM, Sheldon Brown, EBC Brakes, SilverBack HD, Ausco Products, Eaton, PJ Trailers, AL-KO, Meritor.
3. What are the main segments of the Disk Brakes?
The market segments include Application, Type.
4. Can you provide details about the market size?
The market size is estimated to be USD XXX N/A as of 2022.
5. What are some drivers contributing to market growth?
N/A
6. What are the notable trends driving market growth?
N/A
7. Are there any restraints impacting market growth?
N/A
8. Can you provide examples of recent developments in the market?
N/A
9. What pricing options are available for accessing the report?
Pricing options include single-user, multi-user, and enterprise licenses priced at USD 2900.00, USD 4350.00, and USD 5800.00 respectively.
10. Is the market size provided in terms of value or volume?
The market size is provided in terms of value, measured in N/A.
11. Are there any specific market keywords associated with the report?
Yes, the market keyword associated with the report is "Disk Brakes," which aids in identifying and referencing the specific market segment covered.
12. How do I determine which pricing option suits my needs best?
The pricing options vary based on user requirements and access needs. Individual users may opt for single-user licenses, while businesses requiring broader access may choose multi-user or enterprise licenses for cost-effective access to the report.
13. Are there any additional resources or data provided in the Disk Brakes report?
While the report offers comprehensive insights, it's advisable to review the specific contents or supplementary materials provided to ascertain if additional resources or data are available.
14. How can I stay updated on further developments or reports in the Disk Brakes?
To stay informed about further developments, trends, and reports in the Disk Brakes, consider subscribing to industry newsletters, following relevant companies and organizations, or regularly checking reputable industry news sources and publications.
Methodology
Step 1 - Identification of Relevant Samples Size from Population Database


Step 2 - Approaches for Defining Global Market Size (Value, Volume* & Price*)

Note*: In applicable scenarios
Step 3 - Data Sources
Primary Research
- Web Analytics
- Survey Reports
- Research Institute
- Latest Research Reports
- Opinion Leaders
Secondary Research
- Annual Reports
- White Paper
- Latest Press Release
- Industry Association
- Paid Database
- Investor Presentations

Step 4 - Data Triangulation
Involves using different sources of information in order to increase the validity of a study
These sources are likely to be stakeholders in a program - participants, other researchers, program staff, other community members, and so on.
Then we put all data in single framework & apply various statistical tools to find out the dynamic on the market.
During the analysis stage, feedback from the stakeholder groups would be compared to determine areas of agreement as well as areas of divergence