


Key Insights
The Direct-to-Consumer (DTC) Genetic Sequencing market is experiencing substantial expansion, propelled by heightened consumer interest in proactive healthcare, personalized medicine, and ancestral insights. Technological innovations have significantly lowered sequencing costs and enhanced result clarity, further accelerating market growth. This dynamic market features established leaders such as 23andMe and Ancestry.com, alongside emerging competitors, all offering a broad spectrum of tests including ancestry, health predispositions, carrier screening, and pharmacogenomics. Key market drivers include growing consumer demand for personalized health management and advancements in genetic analysis. The market is projected to reach a size of $4.5 billion by 2025, exhibiting a Compound Annual Growth Rate (CAGR) of 12.4%. Segmentation is primarily by test type, with the health segment demonstrating accelerated growth due to its focus on proactive health strategies.

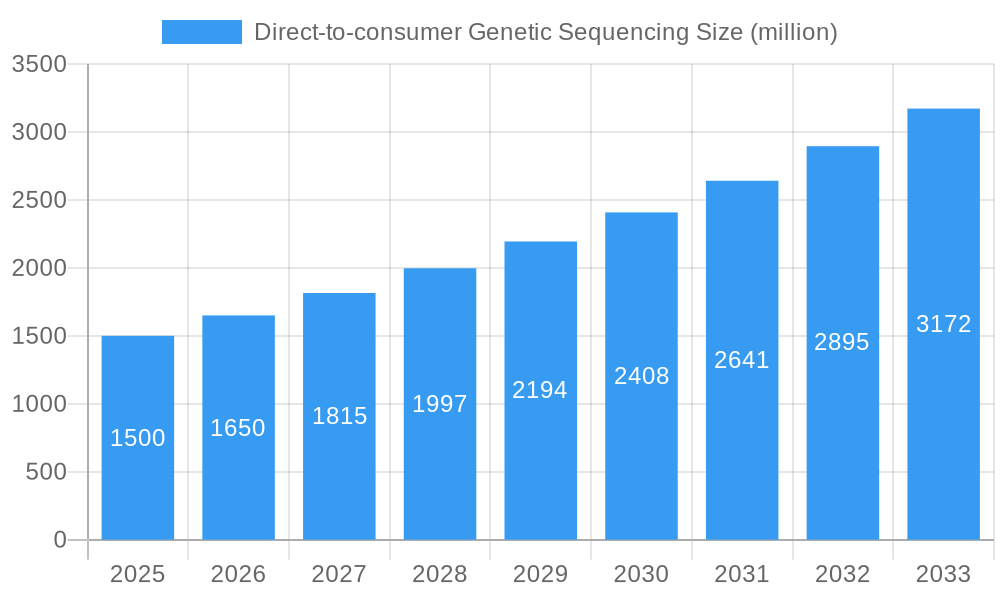
Direct-to-consumer Genetic Sequencing Market Size (In Billion)

Sustained market expansion is anticipated, supported by the integration of DTC genetic testing with telehealth services and the advancement of AI-driven analytical tools. Building and maintaining consumer trust, alongside robust data security and responsible genetic information usage, are paramount for long-term growth. North America and Europe are expected to lead market adoption due to mature healthcare infrastructures. However, Asia and Latin America present significant growth opportunities as awareness and affordability increase. Strategic collaborations between DTC providers and healthcare institutions will likely foster a more integrated approach to personalized healthcare delivery.
Direct-to-consumer Genetic Sequencing Company Market Share
Direct-to-Consumer Genetic Sequencing Market Report: 2019-2033
This comprehensive report provides an in-depth analysis of the direct-to-consumer (DTC) genetic sequencing market, encompassing market dynamics, growth trends, regional insights, product landscapes, and key player strategies. The study period covers 2019-2033, with a base year of 2025 and a forecast period of 2025-2033. This report is invaluable for industry professionals, investors, and anyone seeking a detailed understanding of this rapidly evolving sector. The parent market is the broader personal genomics market, while the child market focuses specifically on DTC services.
Direct-to-consumer Genetic Sequencing Market Dynamics & Structure
The DTC genetic sequencing market is characterized by a dynamic interplay of factors impacting its structure and growth. Market concentration is moderate, with key players like 23andMe and Ancestry.com holding significant shares, while numerous smaller companies compete in niche segments. Technological innovation, particularly in next-generation sequencing (NGS) and bioinformatics, is a primary driver, enabling faster, cheaper, and more comprehensive testing. Regulatory frameworks, varying across jurisdictions, pose both opportunities and challenges, affecting market access and data privacy. Competitive product substitutes, such as traditional medical genetic testing, exert pressure. The end-user demographic is broadening, encompassing individuals interested in ancestry, health risks, and personalized wellness. M&A activity is moderate, with larger companies acquiring smaller players to expand their product portfolios and technological capabilities.
- Market Concentration: Moderately concentrated, with a few dominant players and numerous smaller competitors. Estimated market share for top 3 players in 2025: xx%.
- Technological Innovation: Rapid advancements in NGS and bioinformatics are driving cost reduction and increased accuracy.
- Regulatory Framework: Differing regulations across countries affect market access and data privacy.
- Competitive Substitutes: Traditional medical genetic testing and other health assessment methods.
- End-User Demographics: Expanding beyond ancestry to include health-conscious individuals seeking personalized wellness information.
- M&A Trends: Moderate activity, with larger firms acquiring smaller players to broaden product offerings. Estimated M&A deal volume in 2024: xx deals.
Direct-to-consumer Genetic Sequencing Growth Trends & Insights
The DTC genetic sequencing market has experienced significant growth in recent years, driven by increasing consumer awareness, affordability of testing, and the growing interest in personalized medicine. The market size expanded from xx million units in 2019 to an estimated xx million units in 2025, exhibiting a CAGR of xx% during the historical period (2019-2024). Technological advancements, such as the development of more accurate and affordable sequencing technologies, have further propelled market growth. Consumer behavior is shifting toward proactive health management, with individuals increasingly opting for DTC genetic testing to understand their predispositions to various health conditions. Adoption rates are rising, particularly among younger demographics. The forecast period (2025-2033) is expected to witness sustained growth, driven by the expansion of applications beyond ancestry tracing to include personalized medicine, pharmacogenomics, and carrier screening. Market penetration is expected to reach xx% by 2033.
Dominant Regions, Countries, or Segments in Direct-to-consumer Genetic Sequencing
North America currently dominates the DTC genetic sequencing market, driven by high consumer adoption rates, advanced healthcare infrastructure, and the presence of major players. This dominance is fueled by factors such as favorable regulatory environments and high disposable incomes. Europe is a significant market, although regulatory variations across countries impact growth rates. Asia-Pacific presents a high-growth potential, fueled by increasing awareness and a burgeoning middle class.
- North America: High market share (xx%), driven by strong consumer adoption and established players. Key drivers include high disposable incomes and advanced healthcare infrastructure.
- Europe: Significant market with growth potential, but regulatory variations across countries pose challenges.
- Asia-Pacific: High-growth potential due to increasing consumer awareness and a rising middle class.
Direct-to-consumer Genetic Sequencing Product Landscape
DTC genetic sequencing products range from ancestry tests focusing on ethnicity and family history to health-related tests assessing risks for various diseases, carrier status, and pharmacogenomic traits. Innovations include at-home sample collection kits, faster turnaround times, and more comprehensive reports incorporating personalized recommendations. Unique selling propositions often emphasize ease of use, affordability, and direct access to results without needing a doctor's prescription. Technological advancements include improved sequencing accuracy, data analysis algorithms, and enhanced report interpretation.
Key Drivers, Barriers & Challenges in Direct-to-consumer Genetic Sequencing
Key Drivers:
- Increasing consumer awareness of genetic information and personalized medicine.
- Decreasing cost of genetic sequencing technologies.
- Growing availability of direct-to-consumer genetic tests.
- Expansion of applications beyond ancestry to include health-related information.
Key Challenges & Restraints:
- Regulatory hurdles and data privacy concerns, particularly regarding the handling and interpretation of sensitive genetic information.
- Concerns about the accuracy and clinical validity of some DTC genetic tests.
- Potential for psychological distress among consumers receiving unexpected or difficult-to-interpret results.
- The need for accurate genetic counseling and appropriate follow-up care. Estimated impact of regulatory hurdles on market growth in 2025: xx%.
Emerging Opportunities in Direct-to-consumer Genetic Sequencing
- Expansion into underserved markets with high growth potential.
- Development of novel applications, such as personalized nutrition and fitness plans.
- Integration of genetic information with other health data sources to provide a more comprehensive view of individual health.
- Increasing focus on providing consumers with accessible and easy-to-understand genetic information.
Growth Accelerators in the Direct-to-consumer Genetic Sequencing Industry
Technological breakthroughs, specifically in CRISPR technology and advanced bioinformatics, will continue to drive down costs and improve accuracy, broadening market access. Strategic partnerships between DTC companies and healthcare providers will enhance clinical validity and integration of genetic information into healthcare practices. Expansion into new geographic markets and the development of novel applications, such as pharmacogenomics and microbiome analysis, will fuel long-term growth.
Key Players Shaping the Direct-to-consumer Genetic Sequencing Market
- 23andMe
- MyHeritage
- LabCorp
- Myriad Genetics
- Ancestry.com
- Quest Diagnostics
- Gene By Gene
- DNA Diagnostics Center
- Invitae
- IntelliGenetics
- Ambry Genetics
- Living DNA
- EasyDNA
- Pathway Genomics
- Centrillion Technology
- Xcode
- Color Genomics
- Anglia DNA Services
- African Ancestry
- Canadian DNA Services
- DNA Family Check
- Alpha Biolaboratories
- Test Me DNA
- 23 Mofang
- Genetic Health
- DNA Services of America
- Shuwen Health Sciences
- Mapmygenome
- Full Genomes
Notable Milestones in Direct-to-consumer Genetic Sequencing Sector
- 2020-Q4: 23andMe launches a new health and ancestry service.
- 2021-Q2: Ancestry.com expands its health reporting capabilities.
- 2022-Q3: A major merger occurs between two significant players in the European market. (xx & xx)
- 2023-Q1: A new regulatory framework is introduced in a major global market.
- 2024-Q2: Several DTC companies introduce new, lower-priced testing options.
(Further milestones to be added based on actual data)
In-Depth Direct-to-consumer Genetic Sequencing Market Outlook
The DTC genetic sequencing market is poised for continued growth, driven by technological advancements, increasing consumer demand, and expansion into new applications. Strategic partnerships, regulatory clarity, and continued innovation will be crucial for sustained success. The market presents significant opportunities for players that can effectively navigate regulatory challenges, ensure data privacy, and provide accurate, accessible, and ethically sound genetic information to consumers. Future growth will depend heavily on the development and acceptance of new applications that demonstrate tangible clinical utility and improve consumer health outcomes. The market is projected to reach xx million units by 2033.
Direct-to-consumer Genetic Sequencing Segmentation
-
1. Application
- 1.1. Online
- 1.2. Offline
-
2. Types
- 2.1. Diagnostic Screening
- 2.2. PGD Relationship Testing
Direct-to-consumer Genetic Sequencing Segmentation By Geography
-
1. North America
- 1.1. United States
- 1.2. Canada
- 1.3. Mexico
-
2. South America
- 2.1. Brazil
- 2.2. Argentina
- 2.3. Rest of South America
-
3. Europe
- 3.1. United Kingdom
- 3.2. Germany
- 3.3. France
- 3.4. Italy
- 3.5. Spain
- 3.6. Russia
- 3.7. Benelux
- 3.8. Nordics
- 3.9. Rest of Europe
-
4. Middle East & Africa
- 4.1. Turkey
- 4.2. Israel
- 4.3. GCC
- 4.4. North Africa
- 4.5. South Africa
- 4.6. Rest of Middle East & Africa
-
5. Asia Pacific
- 5.1. China
- 5.2. India
- 5.3. Japan
- 5.4. South Korea
- 5.5. ASEAN
- 5.6. Oceania
- 5.7. Rest of Asia Pacific

Direct-to-consumer Genetic Sequencing Regional Market Share
Geographic Coverage of Direct-to-consumer Genetic Sequencing
Direct-to-consumer Genetic Sequencing REPORT HIGHLIGHTS
| Aspects | Details |
|---|---|
| Study Period | 2020-2034 |
| Base Year | 2025 |
| Estimated Year | 2026 |
| Forecast Period | 2026-2034 |
| Historical Period | 2020-2025 |
| Growth Rate | CAGR of 12.4% from 2020-2034 |
| Segmentation |
|
Table of Contents
- 1. Introduction
- 1.1. Research Scope
- 1.2. Market Segmentation
- 1.3. Research Methodology
- 1.4. Definitions and Assumptions
- 2. Executive Summary
- 2.1. Introduction
- 3. Market Dynamics
- 3.1. Introduction
- 3.2. Market Drivers
- 3.3. Market Restrains
- 3.4. Market Trends
- 4. Market Factor Analysis
- 4.1. Porters Five Forces
- 4.2. Supply/Value Chain
- 4.3. PESTEL analysis
- 4.4. Market Entropy
- 4.5. Patent/Trademark Analysis
- 5. Global Direct-to-consumer Genetic Sequencing Analysis, Insights and Forecast, 2020-2032
- 5.1. Market Analysis, Insights and Forecast - by Application
- 5.1.1. Online
- 5.1.2. Offline
- 5.2. Market Analysis, Insights and Forecast - by Types
- 5.2.1. Diagnostic Screening
- 5.2.2. PGD Relationship Testing
- 5.3. Market Analysis, Insights and Forecast - by Region
- 5.3.1. North America
- 5.3.2. South America
- 5.3.3. Europe
- 5.3.4. Middle East & Africa
- 5.3.5. Asia Pacific
- 5.1. Market Analysis, Insights and Forecast - by Application
- 6. North America Direct-to-consumer Genetic Sequencing Analysis, Insights and Forecast, 2020-2032
- 6.1. Market Analysis, Insights and Forecast - by Application
- 6.1.1. Online
- 6.1.2. Offline
- 6.2. Market Analysis, Insights and Forecast - by Types
- 6.2.1. Diagnostic Screening
- 6.2.2. PGD Relationship Testing
- 6.1. Market Analysis, Insights and Forecast - by Application
- 7. South America Direct-to-consumer Genetic Sequencing Analysis, Insights and Forecast, 2020-2032
- 7.1. Market Analysis, Insights and Forecast - by Application
- 7.1.1. Online
- 7.1.2. Offline
- 7.2. Market Analysis, Insights and Forecast - by Types
- 7.2.1. Diagnostic Screening
- 7.2.2. PGD Relationship Testing
- 7.1. Market Analysis, Insights and Forecast - by Application
- 8. Europe Direct-to-consumer Genetic Sequencing Analysis, Insights and Forecast, 2020-2032
- 8.1. Market Analysis, Insights and Forecast - by Application
- 8.1.1. Online
- 8.1.2. Offline
- 8.2. Market Analysis, Insights and Forecast - by Types
- 8.2.1. Diagnostic Screening
- 8.2.2. PGD Relationship Testing
- 8.1. Market Analysis, Insights and Forecast - by Application
- 9. Middle East & Africa Direct-to-consumer Genetic Sequencing Analysis, Insights and Forecast, 2020-2032
- 9.1. Market Analysis, Insights and Forecast - by Application
- 9.1.1. Online
- 9.1.2. Offline
- 9.2. Market Analysis, Insights and Forecast - by Types
- 9.2.1. Diagnostic Screening
- 9.2.2. PGD Relationship Testing
- 9.1. Market Analysis, Insights and Forecast - by Application
- 10. Asia Pacific Direct-to-consumer Genetic Sequencing Analysis, Insights and Forecast, 2020-2032
- 10.1. Market Analysis, Insights and Forecast - by Application
- 10.1.1. Online
- 10.1.2. Offline
- 10.2. Market Analysis, Insights and Forecast - by Types
- 10.2.1. Diagnostic Screening
- 10.2.2. PGD Relationship Testing
- 10.1. Market Analysis, Insights and Forecast - by Application
- 11. Competitive Analysis
- 11.1. Global Market Share Analysis 2025
- 11.2. Company Profiles
- 11.2.1 23andMe
- 11.2.1.1. Overview
- 11.2.1.2. Products
- 11.2.1.3. SWOT Analysis
- 11.2.1.4. Recent Developments
- 11.2.1.5. Financials (Based on Availability)
- 11.2.2 MyHeritage
- 11.2.2.1. Overview
- 11.2.2.2. Products
- 11.2.2.3. SWOT Analysis
- 11.2.2.4. Recent Developments
- 11.2.2.5. Financials (Based on Availability)
- 11.2.3 LabCorp
- 11.2.3.1. Overview
- 11.2.3.2. Products
- 11.2.3.3. SWOT Analysis
- 11.2.3.4. Recent Developments
- 11.2.3.5. Financials (Based on Availability)
- 11.2.4 Myriad Genetics
- 11.2.4.1. Overview
- 11.2.4.2. Products
- 11.2.4.3. SWOT Analysis
- 11.2.4.4. Recent Developments
- 11.2.4.5. Financials (Based on Availability)
- 11.2.5 Ancestry.com
- 11.2.5.1. Overview
- 11.2.5.2. Products
- 11.2.5.3. SWOT Analysis
- 11.2.5.4. Recent Developments
- 11.2.5.5. Financials (Based on Availability)
- 11.2.6 Quest Diagnostics
- 11.2.6.1. Overview
- 11.2.6.2. Products
- 11.2.6.3. SWOT Analysis
- 11.2.6.4. Recent Developments
- 11.2.6.5. Financials (Based on Availability)
- 11.2.7 Gene By Gene
- 11.2.7.1. Overview
- 11.2.7.2. Products
- 11.2.7.3. SWOT Analysis
- 11.2.7.4. Recent Developments
- 11.2.7.5. Financials (Based on Availability)
- 11.2.8 DNA Diagnostics Center
- 11.2.8.1. Overview
- 11.2.8.2. Products
- 11.2.8.3. SWOT Analysis
- 11.2.8.4. Recent Developments
- 11.2.8.5. Financials (Based on Availability)
- 11.2.9 Invitae
- 11.2.9.1. Overview
- 11.2.9.2. Products
- 11.2.9.3. SWOT Analysis
- 11.2.9.4. Recent Developments
- 11.2.9.5. Financials (Based on Availability)
- 11.2.10 IntelliGenetics
- 11.2.10.1. Overview
- 11.2.10.2. Products
- 11.2.10.3. SWOT Analysis
- 11.2.10.4. Recent Developments
- 11.2.10.5. Financials (Based on Availability)
- 11.2.11 Ambry Genetics
- 11.2.11.1. Overview
- 11.2.11.2. Products
- 11.2.11.3. SWOT Analysis
- 11.2.11.4. Recent Developments
- 11.2.11.5. Financials (Based on Availability)
- 11.2.12 Living DNA
- 11.2.12.1. Overview
- 11.2.12.2. Products
- 11.2.12.3. SWOT Analysis
- 11.2.12.4. Recent Developments
- 11.2.12.5. Financials (Based on Availability)
- 11.2.13 EasyDNA
- 11.2.13.1. Overview
- 11.2.13.2. Products
- 11.2.13.3. SWOT Analysis
- 11.2.13.4. Recent Developments
- 11.2.13.5. Financials (Based on Availability)
- 11.2.14 Pathway Genomics
- 11.2.14.1. Overview
- 11.2.14.2. Products
- 11.2.14.3. SWOT Analysis
- 11.2.14.4. Recent Developments
- 11.2.14.5. Financials (Based on Availability)
- 11.2.15 Centrillion Technology
- 11.2.15.1. Overview
- 11.2.15.2. Products
- 11.2.15.3. SWOT Analysis
- 11.2.15.4. Recent Developments
- 11.2.15.5. Financials (Based on Availability)
- 11.2.16 Xcode
- 11.2.16.1. Overview
- 11.2.16.2. Products
- 11.2.16.3. SWOT Analysis
- 11.2.16.4. Recent Developments
- 11.2.16.5. Financials (Based on Availability)
- 11.2.17 Color Genomics
- 11.2.17.1. Overview
- 11.2.17.2. Products
- 11.2.17.3. SWOT Analysis
- 11.2.17.4. Recent Developments
- 11.2.17.5. Financials (Based on Availability)
- 11.2.18 Anglia DNA Services
- 11.2.18.1. Overview
- 11.2.18.2. Products
- 11.2.18.3. SWOT Analysis
- 11.2.18.4. Recent Developments
- 11.2.18.5. Financials (Based on Availability)
- 11.2.19 African Ancestry
- 11.2.19.1. Overview
- 11.2.19.2. Products
- 11.2.19.3. SWOT Analysis
- 11.2.19.4. Recent Developments
- 11.2.19.5. Financials (Based on Availability)
- 11.2.20 Canadian DNA Services
- 11.2.20.1. Overview
- 11.2.20.2. Products
- 11.2.20.3. SWOT Analysis
- 11.2.20.4. Recent Developments
- 11.2.20.5. Financials (Based on Availability)
- 11.2.21 DNA Family Check
- 11.2.21.1. Overview
- 11.2.21.2. Products
- 11.2.21.3. SWOT Analysis
- 11.2.21.4. Recent Developments
- 11.2.21.5. Financials (Based on Availability)
- 11.2.22 Alpha Biolaboratories
- 11.2.22.1. Overview
- 11.2.22.2. Products
- 11.2.22.3. SWOT Analysis
- 11.2.22.4. Recent Developments
- 11.2.22.5. Financials (Based on Availability)
- 11.2.23 Test Me DNA
- 11.2.23.1. Overview
- 11.2.23.2. Products
- 11.2.23.3. SWOT Analysis
- 11.2.23.4. Recent Developments
- 11.2.23.5. Financials (Based on Availability)
- 11.2.24 23 Mofang
- 11.2.24.1. Overview
- 11.2.24.2. Products
- 11.2.24.3. SWOT Analysis
- 11.2.24.4. Recent Developments
- 11.2.24.5. Financials (Based on Availability)
- 11.2.25 Genetic Health
- 11.2.25.1. Overview
- 11.2.25.2. Products
- 11.2.25.3. SWOT Analysis
- 11.2.25.4. Recent Developments
- 11.2.25.5. Financials (Based on Availability)
- 11.2.26 DNA Services of America
- 11.2.26.1. Overview
- 11.2.26.2. Products
- 11.2.26.3. SWOT Analysis
- 11.2.26.4. Recent Developments
- 11.2.26.5. Financials (Based on Availability)
- 11.2.27 Shuwen Health Sciences
- 11.2.27.1. Overview
- 11.2.27.2. Products
- 11.2.27.3. SWOT Analysis
- 11.2.27.4. Recent Developments
- 11.2.27.5. Financials (Based on Availability)
- 11.2.28 Mapmygenome
- 11.2.28.1. Overview
- 11.2.28.2. Products
- 11.2.28.3. SWOT Analysis
- 11.2.28.4. Recent Developments
- 11.2.28.5. Financials (Based on Availability)
- 11.2.29 Full Genomes
- 11.2.29.1. Overview
- 11.2.29.2. Products
- 11.2.29.3. SWOT Analysis
- 11.2.29.4. Recent Developments
- 11.2.29.5. Financials (Based on Availability)
- 11.2.1 23andMe
List of Figures
- Figure 1: Global Direct-to-consumer Genetic Sequencing Revenue Breakdown (billion, %) by Region 2025 & 2033
- Figure 2: North America Direct-to-consumer Genetic Sequencing Revenue (billion), by Application 2025 & 2033
- Figure 3: North America Direct-to-consumer Genetic Sequencing Revenue Share (%), by Application 2025 & 2033
- Figure 4: North America Direct-to-consumer Genetic Sequencing Revenue (billion), by Types 2025 & 2033
- Figure 5: North America Direct-to-consumer Genetic Sequencing Revenue Share (%), by Types 2025 & 2033
- Figure 6: North America Direct-to-consumer Genetic Sequencing Revenue (billion), by Country 2025 & 2033
- Figure 7: North America Direct-to-consumer Genetic Sequencing Revenue Share (%), by Country 2025 & 2033
- Figure 8: South America Direct-to-consumer Genetic Sequencing Revenue (billion), by Application 2025 & 2033
- Figure 9: South America Direct-to-consumer Genetic Sequencing Revenue Share (%), by Application 2025 & 2033
- Figure 10: South America Direct-to-consumer Genetic Sequencing Revenue (billion), by Types 2025 & 2033
- Figure 11: South America Direct-to-consumer Genetic Sequencing Revenue Share (%), by Types 2025 & 2033
- Figure 12: South America Direct-to-consumer Genetic Sequencing Revenue (billion), by Country 2025 & 2033
- Figure 13: South America Direct-to-consumer Genetic Sequencing Revenue Share (%), by Country 2025 & 2033
- Figure 14: Europe Direct-to-consumer Genetic Sequencing Revenue (billion), by Application 2025 & 2033
- Figure 15: Europe Direct-to-consumer Genetic Sequencing Revenue Share (%), by Application 2025 & 2033
- Figure 16: Europe Direct-to-consumer Genetic Sequencing Revenue (billion), by Types 2025 & 2033
- Figure 17: Europe Direct-to-consumer Genetic Sequencing Revenue Share (%), by Types 2025 & 2033
- Figure 18: Europe Direct-to-consumer Genetic Sequencing Revenue (billion), by Country 2025 & 2033
- Figure 19: Europe Direct-to-consumer Genetic Sequencing Revenue Share (%), by Country 2025 & 2033
- Figure 20: Middle East & Africa Direct-to-consumer Genetic Sequencing Revenue (billion), by Application 2025 & 2033
- Figure 21: Middle East & Africa Direct-to-consumer Genetic Sequencing Revenue Share (%), by Application 2025 & 2033
- Figure 22: Middle East & Africa Direct-to-consumer Genetic Sequencing Revenue (billion), by Types 2025 & 2033
- Figure 23: Middle East & Africa Direct-to-consumer Genetic Sequencing Revenue Share (%), by Types 2025 & 2033
- Figure 24: Middle East & Africa Direct-to-consumer Genetic Sequencing Revenue (billion), by Country 2025 & 2033
- Figure 25: Middle East & Africa Direct-to-consumer Genetic Sequencing Revenue Share (%), by Country 2025 & 2033
- Figure 26: Asia Pacific Direct-to-consumer Genetic Sequencing Revenue (billion), by Application 2025 & 2033
- Figure 27: Asia Pacific Direct-to-consumer Genetic Sequencing Revenue Share (%), by Application 2025 & 2033
- Figure 28: Asia Pacific Direct-to-consumer Genetic Sequencing Revenue (billion), by Types 2025 & 2033
- Figure 29: Asia Pacific Direct-to-consumer Genetic Sequencing Revenue Share (%), by Types 2025 & 2033
- Figure 30: Asia Pacific Direct-to-consumer Genetic Sequencing Revenue (billion), by Country 2025 & 2033
- Figure 31: Asia Pacific Direct-to-consumer Genetic Sequencing Revenue Share (%), by Country 2025 & 2033
List of Tables
- Table 1: Global Direct-to-consumer Genetic Sequencing Revenue billion Forecast, by Application 2020 & 2033
- Table 2: Global Direct-to-consumer Genetic Sequencing Revenue billion Forecast, by Types 2020 & 2033
- Table 3: Global Direct-to-consumer Genetic Sequencing Revenue billion Forecast, by Region 2020 & 2033
- Table 4: Global Direct-to-consumer Genetic Sequencing Revenue billion Forecast, by Application 2020 & 2033
- Table 5: Global Direct-to-consumer Genetic Sequencing Revenue billion Forecast, by Types 2020 & 2033
- Table 6: Global Direct-to-consumer Genetic Sequencing Revenue billion Forecast, by Country 2020 & 2033
- Table 7: United States Direct-to-consumer Genetic Sequencing Revenue (billion) Forecast, by Application 2020 & 2033
- Table 8: Canada Direct-to-consumer Genetic Sequencing Revenue (billion) Forecast, by Application 2020 & 2033
- Table 9: Mexico Direct-to-consumer Genetic Sequencing Revenue (billion) Forecast, by Application 2020 & 2033
- Table 10: Global Direct-to-consumer Genetic Sequencing Revenue billion Forecast, by Application 2020 & 2033
- Table 11: Global Direct-to-consumer Genetic Sequencing Revenue billion Forecast, by Types 2020 & 2033
- Table 12: Global Direct-to-consumer Genetic Sequencing Revenue billion Forecast, by Country 2020 & 2033
- Table 13: Brazil Direct-to-consumer Genetic Sequencing Revenue (billion) Forecast, by Application 2020 & 2033
- Table 14: Argentina Direct-to-consumer Genetic Sequencing Revenue (billion) Forecast, by Application 2020 & 2033
- Table 15: Rest of South America Direct-to-consumer Genetic Sequencing Revenue (billion) Forecast, by Application 2020 & 2033
- Table 16: Global Direct-to-consumer Genetic Sequencing Revenue billion Forecast, by Application 2020 & 2033
- Table 17: Global Direct-to-consumer Genetic Sequencing Revenue billion Forecast, by Types 2020 & 2033
- Table 18: Global Direct-to-consumer Genetic Sequencing Revenue billion Forecast, by Country 2020 & 2033
- Table 19: United Kingdom Direct-to-consumer Genetic Sequencing Revenue (billion) Forecast, by Application 2020 & 2033
- Table 20: Germany Direct-to-consumer Genetic Sequencing Revenue (billion) Forecast, by Application 2020 & 2033
- Table 21: France Direct-to-consumer Genetic Sequencing Revenue (billion) Forecast, by Application 2020 & 2033
- Table 22: Italy Direct-to-consumer Genetic Sequencing Revenue (billion) Forecast, by Application 2020 & 2033
- Table 23: Spain Direct-to-consumer Genetic Sequencing Revenue (billion) Forecast, by Application 2020 & 2033
- Table 24: Russia Direct-to-consumer Genetic Sequencing Revenue (billion) Forecast, by Application 2020 & 2033
- Table 25: Benelux Direct-to-consumer Genetic Sequencing Revenue (billion) Forecast, by Application 2020 & 2033
- Table 26: Nordics Direct-to-consumer Genetic Sequencing Revenue (billion) Forecast, by Application 2020 & 2033
- Table 27: Rest of Europe Direct-to-consumer Genetic Sequencing Revenue (billion) Forecast, by Application 2020 & 2033
- Table 28: Global Direct-to-consumer Genetic Sequencing Revenue billion Forecast, by Application 2020 & 2033
- Table 29: Global Direct-to-consumer Genetic Sequencing Revenue billion Forecast, by Types 2020 & 2033
- Table 30: Global Direct-to-consumer Genetic Sequencing Revenue billion Forecast, by Country 2020 & 2033
- Table 31: Turkey Direct-to-consumer Genetic Sequencing Revenue (billion) Forecast, by Application 2020 & 2033
- Table 32: Israel Direct-to-consumer Genetic Sequencing Revenue (billion) Forecast, by Application 2020 & 2033
- Table 33: GCC Direct-to-consumer Genetic Sequencing Revenue (billion) Forecast, by Application 2020 & 2033
- Table 34: North Africa Direct-to-consumer Genetic Sequencing Revenue (billion) Forecast, by Application 2020 & 2033
- Table 35: South Africa Direct-to-consumer Genetic Sequencing Revenue (billion) Forecast, by Application 2020 & 2033
- Table 36: Rest of Middle East & Africa Direct-to-consumer Genetic Sequencing Revenue (billion) Forecast, by Application 2020 & 2033
- Table 37: Global Direct-to-consumer Genetic Sequencing Revenue billion Forecast, by Application 2020 & 2033
- Table 38: Global Direct-to-consumer Genetic Sequencing Revenue billion Forecast, by Types 2020 & 2033
- Table 39: Global Direct-to-consumer Genetic Sequencing Revenue billion Forecast, by Country 2020 & 2033
- Table 40: China Direct-to-consumer Genetic Sequencing Revenue (billion) Forecast, by Application 2020 & 2033
- Table 41: India Direct-to-consumer Genetic Sequencing Revenue (billion) Forecast, by Application 2020 & 2033
- Table 42: Japan Direct-to-consumer Genetic Sequencing Revenue (billion) Forecast, by Application 2020 & 2033
- Table 43: South Korea Direct-to-consumer Genetic Sequencing Revenue (billion) Forecast, by Application 2020 & 2033
- Table 44: ASEAN Direct-to-consumer Genetic Sequencing Revenue (billion) Forecast, by Application 2020 & 2033
- Table 45: Oceania Direct-to-consumer Genetic Sequencing Revenue (billion) Forecast, by Application 2020 & 2033
- Table 46: Rest of Asia Pacific Direct-to-consumer Genetic Sequencing Revenue (billion) Forecast, by Application 2020 & 2033
Frequently Asked Questions
1. What is the projected Compound Annual Growth Rate (CAGR) of the Direct-to-consumer Genetic Sequencing?
The projected CAGR is approximately 12.4%.
2. Which companies are prominent players in the Direct-to-consumer Genetic Sequencing?
Key companies in the market include 23andMe, MyHeritage, LabCorp, Myriad Genetics, Ancestry.com, Quest Diagnostics, Gene By Gene, DNA Diagnostics Center, Invitae, IntelliGenetics, Ambry Genetics, Living DNA, EasyDNA, Pathway Genomics, Centrillion Technology, Xcode, Color Genomics, Anglia DNA Services, African Ancestry, Canadian DNA Services, DNA Family Check, Alpha Biolaboratories, Test Me DNA, 23 Mofang, Genetic Health, DNA Services of America, Shuwen Health Sciences, Mapmygenome, Full Genomes.
3. What are the main segments of the Direct-to-consumer Genetic Sequencing?
The market segments include Application, Types.
4. Can you provide details about the market size?
The market size is estimated to be USD 4.5 billion as of 2022.
5. What are some drivers contributing to market growth?
N/A
6. What are the notable trends driving market growth?
N/A
7. Are there any restraints impacting market growth?
N/A
8. Can you provide examples of recent developments in the market?
N/A
9. What pricing options are available for accessing the report?
Pricing options include single-user, multi-user, and enterprise licenses priced at USD 3350.00, USD 5025.00, and USD 6700.00 respectively.
10. Is the market size provided in terms of value or volume?
The market size is provided in terms of value, measured in billion.
11. Are there any specific market keywords associated with the report?
Yes, the market keyword associated with the report is "Direct-to-consumer Genetic Sequencing," which aids in identifying and referencing the specific market segment covered.
12. How do I determine which pricing option suits my needs best?
The pricing options vary based on user requirements and access needs. Individual users may opt for single-user licenses, while businesses requiring broader access may choose multi-user or enterprise licenses for cost-effective access to the report.
13. Are there any additional resources or data provided in the Direct-to-consumer Genetic Sequencing report?
While the report offers comprehensive insights, it's advisable to review the specific contents or supplementary materials provided to ascertain if additional resources or data are available.
14. How can I stay updated on further developments or reports in the Direct-to-consumer Genetic Sequencing?
To stay informed about further developments, trends, and reports in the Direct-to-consumer Genetic Sequencing, consider subscribing to industry newsletters, following relevant companies and organizations, or regularly checking reputable industry news sources and publications.
Methodology
Step 1 - Identification of Relevant Samples Size from Population Database


Step 2 - Approaches for Defining Global Market Size (Value, Volume* & Price*)

Note*: In applicable scenarios
Step 3 - Data Sources
Primary Research
- Web Analytics
- Survey Reports
- Research Institute
- Latest Research Reports
- Opinion Leaders
Secondary Research
- Annual Reports
- White Paper
- Latest Press Release
- Industry Association
- Paid Database
- Investor Presentations

Step 4 - Data Triangulation
Involves using different sources of information in order to increase the validity of a study
These sources are likely to be stakeholders in a program - participants, other researchers, program staff, other community members, and so on.
Then we put all data in single framework & apply various statistical tools to find out the dynamic on the market.
During the analysis stage, feedback from the stakeholder groups would be compared to determine areas of agreement as well as areas of divergence