
Key Insights
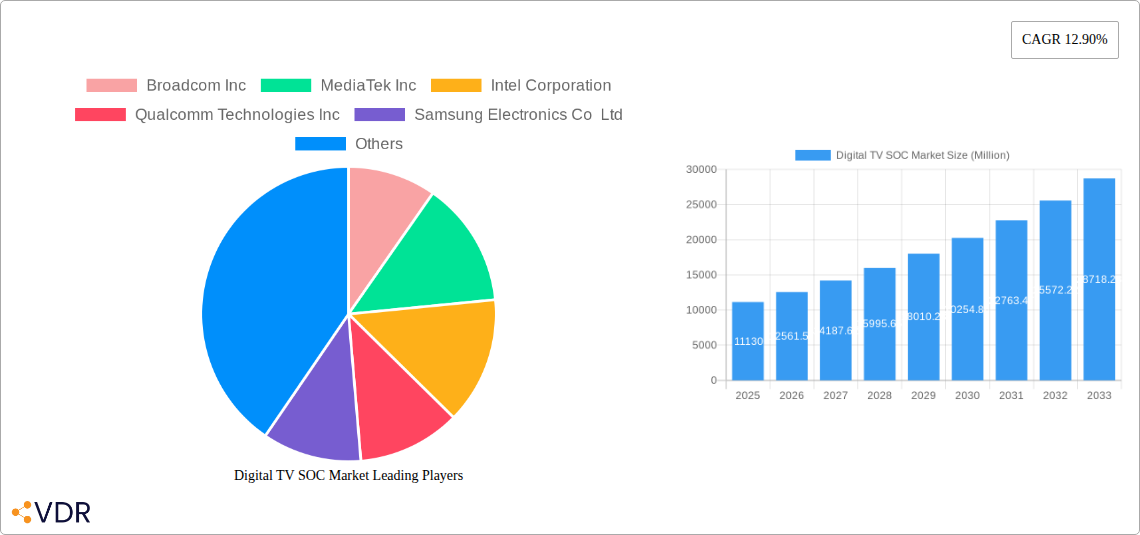
The Digital TV SOC market is experiencing robust growth, projected to reach \$11.13 billion in 2025 and maintain a Compound Annual Growth Rate (CAGR) of 12.90% from 2025 to 2033. This expansion is driven by several key factors. Firstly, the increasing adoption of smart TVs and the rise of streaming services are fueling demand for advanced SOCs with enhanced processing power and multimedia capabilities. Consumers are increasingly demanding higher resolutions (4K, 8K), HDR support, and improved connectivity features such as Wi-Fi 6 and Bluetooth 5.0, all of which necessitate more sophisticated SOCs. Furthermore, the integration of artificial intelligence (AI) and machine learning (ML) features in digital TVs, enabling functionalities like voice control and personalized content recommendations, is a significant growth driver. The proliferation of affordable high-definition televisions in emerging markets also contributes to the expanding market size. Competition among leading manufacturers such as Broadcom, MediaTek, Qualcomm, and Samsung, continuously pushing innovation in terms of performance, power efficiency, and cost-effectiveness, further accelerates market growth.
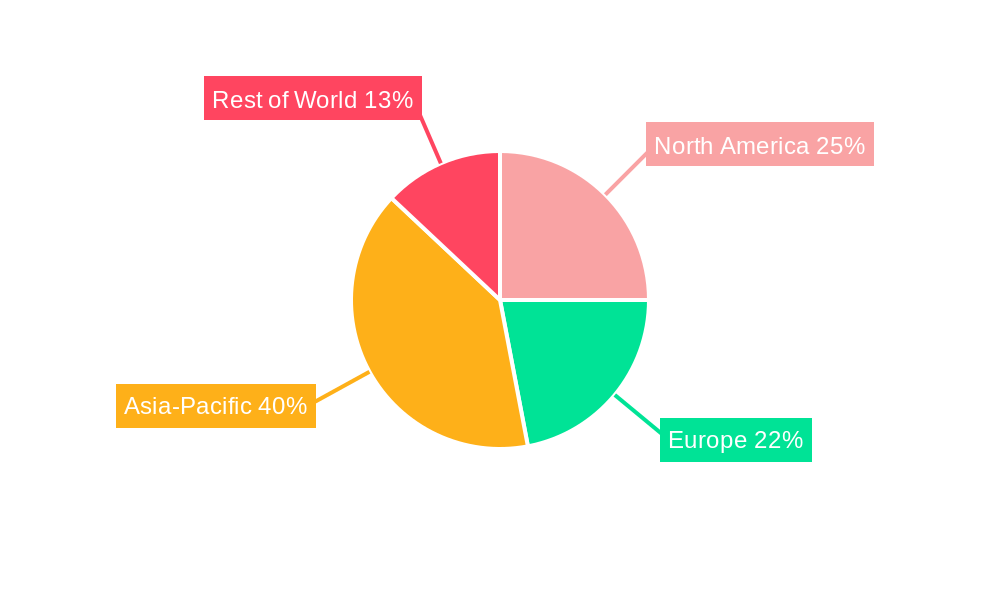
However, potential restraints include the cyclical nature of the consumer electronics industry, fluctuations in raw material costs, and potential disruptions in global supply chains. While the market is highly competitive, opportunities exist for companies focusing on energy-efficient designs to cater to environmentally conscious consumers and developing cutting-edge technologies like 8K resolution processing and advanced AI integration to meet evolving consumer preferences. Furthermore, partnerships and collaborations between SOC manufacturers and TV brands are vital for sustained growth, as this allows for tailored solutions to optimize performance and consumer experience. The regional distribution of market share will likely see continued growth in Asia-Pacific driven by increasing purchasing power and high TV penetration, while North America and Europe maintain substantial market presence due to high per capita consumption of advanced electronics.
Digital TV SOC Market: A Comprehensive Report (2019-2033)
This comprehensive report offers an in-depth analysis of the Digital TV SOC market, encompassing market dynamics, growth trends, regional dominance, product landscape, key players, and future outlook. The report covers the period from 2019 to 2033, with a focus on the base year 2025. The parent market is the broader semiconductor market, while the child market is specifically the digital television segment within this. This report provides crucial insights for industry professionals, investors, and strategic decision-makers seeking to navigate this dynamic landscape. The market size is projected at xx Million units in 2025.
Digital TV SOC Market Dynamics & Structure
The Digital TV SOC market is characterized by moderate concentration, with key players holding significant market shares. Technological innovation, driven by advancements in video processing, power efficiency, and connectivity, is a major growth driver. Stringent regulatory frameworks related to broadcasting standards and energy consumption influence product development and adoption. Competitive substitutes, such as alternative display technologies, pose a challenge, although the dominance of digital TV remains strong. End-user demographics, particularly the rising adoption of smart TVs and streaming services, are shaping market demand. M&A activity within the semiconductor industry, while not extraordinarily high in this specific niche, has consolidated some players and is expected to continue.
- Market Concentration: Moderately concentrated, with top 5 players holding approximately xx% market share (2025).
- Technological Innovation: Focus on 4K/8K resolution, HDR support, AI-powered features, and improved energy efficiency.
- Regulatory Frameworks: Compliance with broadcast standards (e.g., ATSC 3.0) influences SoC design.
- Competitive Substitutes: Competition from streaming devices and alternative display technologies.
- End-User Demographics: Shift towards smart TVs and increased streaming consumption fuels market growth.
- M&A Trends: Consolidation through strategic acquisitions to expand product portfolios and market reach, with xx major deals in the last 5 years.
Digital TV SOC Market Growth Trends & Insights
The Digital TV SOC market experienced significant growth during the historical period (2019-2024), driven by factors such as increasing adoption of smart TVs, rising demand for high-definition video content, and the expansion of streaming services. The market size is projected to grow at a CAGR of xx% during the forecast period (2025-2033), reaching xx Million units by 2033. Technological disruptions, including the introduction of 8K resolution and advanced features like AI-based image processing, are further stimulating growth. Consumer behavior shifts toward personalized content and on-demand viewing continue to propel market expansion. Market penetration of smart TVs is expected to reach xx% by 2033 in major markets.
Dominant Regions, Countries, or Segments in Digital TV SOC Market
Asia-Pacific is expected to be the dominant region in the Digital TV SOC market throughout the forecast period, driven by strong demand from countries such as China, India, and South Korea. This dominance is fueled by factors such as high population density, rising disposable incomes, and increased penetration of digital television. North America and Europe are also significant markets, although growth rates may be slightly slower due to higher market maturity. The set-top box segment is projected to hold the largest market share due to the large installed base of traditional cable and satellite TV systems that are slowly but surely moving to digital.
- Asia-Pacific: High growth due to expanding middle class, increasing urbanization, and government initiatives promoting digital TV adoption.
- North America: Mature market with steady growth driven by technological upgrades and premium TV adoption.
- Europe: Moderate growth fueled by ongoing digitalization of broadcasting and smart TV adoption.
- Set-top Box Segment: Largest market segment due to widespread use in cable and satellite TV systems.
Digital TV SOC Market Product Landscape
Digital TV SOCs are constantly evolving to meet the demands for higher resolutions (4K, 8K), improved picture quality (HDR, HLG), and enhanced processing capabilities (AI-powered features, voice control). These SOCs integrate various components such as video decoders, video encoders, processors, and memory controllers. Key features include high-performance video processing capabilities, efficient power management, and advanced connectivity options like Wi-Fi and Ethernet. Unique selling propositions often emphasize low power consumption, superior image quality, and enhanced user experience.
Key Drivers, Barriers & Challenges in Digital TV SOC Market
Key Drivers: The increasing demand for high-definition and ultra-high-definition television, the expansion of streaming services, and the growing adoption of smart TVs are major drivers of market growth. Government initiatives promoting digital TV transition and technological advancements like 8K resolution also contribute.
Key Challenges: Competition from established players and new entrants, rising manufacturing costs, supply chain disruptions, and the development of new technologies can pose significant challenges. Regulatory hurdles and compliance requirements in different regions also add complexity. The market is impacted by cyclical economic fluctuations and price competition.
Emerging Opportunities in Digital TV SOC Market
Emerging opportunities include the expansion into new markets such as Africa and Latin America, the integration of 5G connectivity and the development of enhanced features like AI-based image upscaling and advanced gaming capabilities. The integration of advanced features will drive market growth while the shift towards environmentally friendly solutions also poses an opportunity.
Growth Accelerators in the Digital TV SOC Market Industry
Technological advancements are significant growth drivers, especially in areas such as 8K resolution, HDR processing, and AI-powered features. Strategic partnerships between SoC manufacturers and TV brands accelerate product development and market penetration. Expanding into untapped markets presents significant opportunities for growth.
Key Players Shaping the Digital TV SOC Market Market
- Broadcom Inc
- MediaTek Inc
- Intel Corporation
- Qualcomm Technologies Inc
- Samsung Electronics Co Ltd
- STMicroelectronics NV
- Novatek Microelectronics Corp
- MStar Semiconductor Inc
- LG Electronics Inc
- HiSilicon
- NXP Semiconductors
Notable Milestones in Digital TV SOC Market Sector
- May 2024: MediaTek announced its Dimensity 9300+ SoC, featuring 18 MB of L3 cache and LPDDR5T memory support, enhancing performance for premium mobile applications. This signals a potential upward trend in performance capabilities for TV SoCs as well.
- January 2024: Videocon d2h partnered with MStar Semiconductor for HEVC H.265 SoCs in their HD set-top boxes, improving bandwidth efficiency and picture quality, indicating a focus on cost-effectiveness and enhanced viewing experiences.
In-Depth Digital TV SOC Market Market Outlook
The Digital TV SOC market is poised for continued growth, driven by technological innovation, the expansion of streaming services, and the ongoing shift towards smart TVs. Strategic partnerships and expansion into emerging markets will further fuel market expansion. The focus on higher resolution, enhanced features, and efficient power management will shape the future of this market. The market is expected to see sustained growth, particularly in the Asia-Pacific region, creating substantial opportunities for key players.
Digital TV SOC Market Segmentation
-
1. Application
- 1.1. LCD
- 1.2. LED
- 1.3. OLED
- 1.4. QLED
-
2. End User
- 2.1. Residential
- 2.2. Commercial
- 2.3. Other End Users
Digital TV SOC Market Segmentation By Geography
- 1. North America
- 2. Europe
- 3. Asia
- 4. Australia and New Zealand
- 5. Latin America
- 6. Middle East and Africa
Digital TV SOC Market REPORT HIGHLIGHTS
| Aspects | Details |
|---|---|
| Study Period | 2019-2033 |
| Base Year | 2024 |
| Estimated Year | 2025 |
| Forecast Period | 2025-2033 |
| Historical Period | 2019-2024 |
| Growth Rate | CAGR of 12.90% from 2019-2033 |
| Segmentation |
|
Table of Contents
- 1. Introduction
- 1.1. Research Scope
- 1.2. Market Segmentation
- 1.3. Research Methodology
- 1.4. Definitions and Assumptions
- 2. Executive Summary
- 2.1. Introduction
- 3. Market Dynamics
- 3.1. Introduction
- 3.2. Market Drivers
- 3.2.1. Increasing Demand for Smart TVs Will Drive the Market Growth; Rising Consumer Demand for High-definition and Ultra-high-definition (UHD) Content
- 3.3. Market Restrains
- 3.3.1. Increasing Demand for Smart TVs Will Drive the Market Growth; Rising Consumer Demand for High-definition and Ultra-high-definition (UHD) Content
- 3.4. Market Trends
- 3.4.1. The Commercial Segment is Expected to Hold a Significant Market Share
- 4. Market Factor Analysis
- 4.1. Porters Five Forces
- 4.2. Supply/Value Chain
- 4.3. PESTEL analysis
- 4.4. Market Entropy
- 4.5. Patent/Trademark Analysis
- 5. Global Digital TV SOC Market Analysis, Insights and Forecast, 2019-2031
- 5.1. Market Analysis, Insights and Forecast - by Application
- 5.1.1. LCD
- 5.1.2. LED
- 5.1.3. OLED
- 5.1.4. QLED
- 5.2. Market Analysis, Insights and Forecast - by End User
- 5.2.1. Residential
- 5.2.2. Commercial
- 5.2.3. Other End Users
- 5.3. Market Analysis, Insights and Forecast - by Region
- 5.3.1. North America
- 5.3.2. Europe
- 5.3.3. Asia
- 5.3.4. Australia and New Zealand
- 5.3.5. Latin America
- 5.3.6. Middle East and Africa
- 5.1. Market Analysis, Insights and Forecast - by Application
- 6. North America Digital TV SOC Market Analysis, Insights and Forecast, 2019-2031
- 6.1. Market Analysis, Insights and Forecast - by Application
- 6.1.1. LCD
- 6.1.2. LED
- 6.1.3. OLED
- 6.1.4. QLED
- 6.2. Market Analysis, Insights and Forecast - by End User
- 6.2.1. Residential
- 6.2.2. Commercial
- 6.2.3. Other End Users
- 6.1. Market Analysis, Insights and Forecast - by Application
- 7. Europe Digital TV SOC Market Analysis, Insights and Forecast, 2019-2031
- 7.1. Market Analysis, Insights and Forecast - by Application
- 7.1.1. LCD
- 7.1.2. LED
- 7.1.3. OLED
- 7.1.4. QLED
- 7.2. Market Analysis, Insights and Forecast - by End User
- 7.2.1. Residential
- 7.2.2. Commercial
- 7.2.3. Other End Users
- 7.1. Market Analysis, Insights and Forecast - by Application
- 8. Asia Digital TV SOC Market Analysis, Insights and Forecast, 2019-2031
- 8.1. Market Analysis, Insights and Forecast - by Application
- 8.1.1. LCD
- 8.1.2. LED
- 8.1.3. OLED
- 8.1.4. QLED
- 8.2. Market Analysis, Insights and Forecast - by End User
- 8.2.1. Residential
- 8.2.2. Commercial
- 8.2.3. Other End Users
- 8.1. Market Analysis, Insights and Forecast - by Application
- 9. Australia and New Zealand Digital TV SOC Market Analysis, Insights and Forecast, 2019-2031
- 9.1. Market Analysis, Insights and Forecast - by Application
- 9.1.1. LCD
- 9.1.2. LED
- 9.1.3. OLED
- 9.1.4. QLED
- 9.2. Market Analysis, Insights and Forecast - by End User
- 9.2.1. Residential
- 9.2.2. Commercial
- 9.2.3. Other End Users
- 9.1. Market Analysis, Insights and Forecast - by Application
- 10. Latin America Digital TV SOC Market Analysis, Insights and Forecast, 2019-2031
- 10.1. Market Analysis, Insights and Forecast - by Application
- 10.1.1. LCD
- 10.1.2. LED
- 10.1.3. OLED
- 10.1.4. QLED
- 10.2. Market Analysis, Insights and Forecast - by End User
- 10.2.1. Residential
- 10.2.2. Commercial
- 10.2.3. Other End Users
- 10.1. Market Analysis, Insights and Forecast - by Application
- 11. Middle East and Africa Digital TV SOC Market Analysis, Insights and Forecast, 2019-2031
- 11.1. Market Analysis, Insights and Forecast - by Application
- 11.1.1. LCD
- 11.1.2. LED
- 11.1.3. OLED
- 11.1.4. QLED
- 11.2. Market Analysis, Insights and Forecast - by End User
- 11.2.1. Residential
- 11.2.2. Commercial
- 11.2.3. Other End Users
- 11.1. Market Analysis, Insights and Forecast - by Application
- 12. Competitive Analysis
- 12.1. Global Market Share Analysis 2024
- 12.2. Company Profiles
- 12.2.1 Broadcom Inc
- 12.2.1.1. Overview
- 12.2.1.2. Products
- 12.2.1.3. SWOT Analysis
- 12.2.1.4. Recent Developments
- 12.2.1.5. Financials (Based on Availability)
- 12.2.2 MediaTek Inc
- 12.2.2.1. Overview
- 12.2.2.2. Products
- 12.2.2.3. SWOT Analysis
- 12.2.2.4. Recent Developments
- 12.2.2.5. Financials (Based on Availability)
- 12.2.3 Intel Corporation
- 12.2.3.1. Overview
- 12.2.3.2. Products
- 12.2.3.3. SWOT Analysis
- 12.2.3.4. Recent Developments
- 12.2.3.5. Financials (Based on Availability)
- 12.2.4 Qualcomm Technologies Inc
- 12.2.4.1. Overview
- 12.2.4.2. Products
- 12.2.4.3. SWOT Analysis
- 12.2.4.4. Recent Developments
- 12.2.4.5. Financials (Based on Availability)
- 12.2.5 Samsung Electronics Co Ltd
- 12.2.5.1. Overview
- 12.2.5.2. Products
- 12.2.5.3. SWOT Analysis
- 12.2.5.4. Recent Developments
- 12.2.5.5. Financials (Based on Availability)
- 12.2.6 STMicroelectronics NV
- 12.2.6.1. Overview
- 12.2.6.2. Products
- 12.2.6.3. SWOT Analysis
- 12.2.6.4. Recent Developments
- 12.2.6.5. Financials (Based on Availability)
- 12.2.7 Novatek Microelectronics Corp
- 12.2.7.1. Overview
- 12.2.7.2. Products
- 12.2.7.3. SWOT Analysis
- 12.2.7.4. Recent Developments
- 12.2.7.5. Financials (Based on Availability)
- 12.2.8 MStar Semiconductor Inc
- 12.2.8.1. Overview
- 12.2.8.2. Products
- 12.2.8.3. SWOT Analysis
- 12.2.8.4. Recent Developments
- 12.2.8.5. Financials (Based on Availability)
- 12.2.9 LG Electronics Inc
- 12.2.9.1. Overview
- 12.2.9.2. Products
- 12.2.9.3. SWOT Analysis
- 12.2.9.4. Recent Developments
- 12.2.9.5. Financials (Based on Availability)
- 12.2.10 HiSilicon
- 12.2.10.1. Overview
- 12.2.10.2. Products
- 12.2.10.3. SWOT Analysis
- 12.2.10.4. Recent Developments
- 12.2.10.5. Financials (Based on Availability)
- 12.2.11 NXP Semiconductors*List Not Exhaustive
- 12.2.11.1. Overview
- 12.2.11.2. Products
- 12.2.11.3. SWOT Analysis
- 12.2.11.4. Recent Developments
- 12.2.11.5. Financials (Based on Availability)
- 12.2.1 Broadcom Inc
List of Figures
- Figure 1: Global Digital TV SOC Market Revenue Breakdown (Million, %) by Region 2024 & 2032
- Figure 2: Global Digital TV SOC Market Volume Breakdown (Billion, %) by Region 2024 & 2032
- Figure 3: North America Digital TV SOC Market Revenue (Million), by Application 2024 & 2032
- Figure 4: North America Digital TV SOC Market Volume (Billion), by Application 2024 & 2032
- Figure 5: North America Digital TV SOC Market Revenue Share (%), by Application 2024 & 2032
- Figure 6: North America Digital TV SOC Market Volume Share (%), by Application 2024 & 2032
- Figure 7: North America Digital TV SOC Market Revenue (Million), by End User 2024 & 2032
- Figure 8: North America Digital TV SOC Market Volume (Billion), by End User 2024 & 2032
- Figure 9: North America Digital TV SOC Market Revenue Share (%), by End User 2024 & 2032
- Figure 10: North America Digital TV SOC Market Volume Share (%), by End User 2024 & 2032
- Figure 11: North America Digital TV SOC Market Revenue (Million), by Country 2024 & 2032
- Figure 12: North America Digital TV SOC Market Volume (Billion), by Country 2024 & 2032
- Figure 13: North America Digital TV SOC Market Revenue Share (%), by Country 2024 & 2032
- Figure 14: North America Digital TV SOC Market Volume Share (%), by Country 2024 & 2032
- Figure 15: Europe Digital TV SOC Market Revenue (Million), by Application 2024 & 2032
- Figure 16: Europe Digital TV SOC Market Volume (Billion), by Application 2024 & 2032
- Figure 17: Europe Digital TV SOC Market Revenue Share (%), by Application 2024 & 2032
- Figure 18: Europe Digital TV SOC Market Volume Share (%), by Application 2024 & 2032
- Figure 19: Europe Digital TV SOC Market Revenue (Million), by End User 2024 & 2032
- Figure 20: Europe Digital TV SOC Market Volume (Billion), by End User 2024 & 2032
- Figure 21: Europe Digital TV SOC Market Revenue Share (%), by End User 2024 & 2032
- Figure 22: Europe Digital TV SOC Market Volume Share (%), by End User 2024 & 2032
- Figure 23: Europe Digital TV SOC Market Revenue (Million), by Country 2024 & 2032
- Figure 24: Europe Digital TV SOC Market Volume (Billion), by Country 2024 & 2032
- Figure 25: Europe Digital TV SOC Market Revenue Share (%), by Country 2024 & 2032
- Figure 26: Europe Digital TV SOC Market Volume Share (%), by Country 2024 & 2032
- Figure 27: Asia Digital TV SOC Market Revenue (Million), by Application 2024 & 2032
- Figure 28: Asia Digital TV SOC Market Volume (Billion), by Application 2024 & 2032
- Figure 29: Asia Digital TV SOC Market Revenue Share (%), by Application 2024 & 2032
- Figure 30: Asia Digital TV SOC Market Volume Share (%), by Application 2024 & 2032
- Figure 31: Asia Digital TV SOC Market Revenue (Million), by End User 2024 & 2032
- Figure 32: Asia Digital TV SOC Market Volume (Billion), by End User 2024 & 2032
- Figure 33: Asia Digital TV SOC Market Revenue Share (%), by End User 2024 & 2032
- Figure 34: Asia Digital TV SOC Market Volume Share (%), by End User 2024 & 2032
- Figure 35: Asia Digital TV SOC Market Revenue (Million), by Country 2024 & 2032
- Figure 36: Asia Digital TV SOC Market Volume (Billion), by Country 2024 & 2032
- Figure 37: Asia Digital TV SOC Market Revenue Share (%), by Country 2024 & 2032
- Figure 38: Asia Digital TV SOC Market Volume Share (%), by Country 2024 & 2032
- Figure 39: Australia and New Zealand Digital TV SOC Market Revenue (Million), by Application 2024 & 2032
- Figure 40: Australia and New Zealand Digital TV SOC Market Volume (Billion), by Application 2024 & 2032
- Figure 41: Australia and New Zealand Digital TV SOC Market Revenue Share (%), by Application 2024 & 2032
- Figure 42: Australia and New Zealand Digital TV SOC Market Volume Share (%), by Application 2024 & 2032
- Figure 43: Australia and New Zealand Digital TV SOC Market Revenue (Million), by End User 2024 & 2032
- Figure 44: Australia and New Zealand Digital TV SOC Market Volume (Billion), by End User 2024 & 2032
- Figure 45: Australia and New Zealand Digital TV SOC Market Revenue Share (%), by End User 2024 & 2032
- Figure 46: Australia and New Zealand Digital TV SOC Market Volume Share (%), by End User 2024 & 2032
- Figure 47: Australia and New Zealand Digital TV SOC Market Revenue (Million), by Country 2024 & 2032
- Figure 48: Australia and New Zealand Digital TV SOC Market Volume (Billion), by Country 2024 & 2032
- Figure 49: Australia and New Zealand Digital TV SOC Market Revenue Share (%), by Country 2024 & 2032
- Figure 50: Australia and New Zealand Digital TV SOC Market Volume Share (%), by Country 2024 & 2032
- Figure 51: Latin America Digital TV SOC Market Revenue (Million), by Application 2024 & 2032
- Figure 52: Latin America Digital TV SOC Market Volume (Billion), by Application 2024 & 2032
- Figure 53: Latin America Digital TV SOC Market Revenue Share (%), by Application 2024 & 2032
- Figure 54: Latin America Digital TV SOC Market Volume Share (%), by Application 2024 & 2032
- Figure 55: Latin America Digital TV SOC Market Revenue (Million), by End User 2024 & 2032
- Figure 56: Latin America Digital TV SOC Market Volume (Billion), by End User 2024 & 2032
- Figure 57: Latin America Digital TV SOC Market Revenue Share (%), by End User 2024 & 2032
- Figure 58: Latin America Digital TV SOC Market Volume Share (%), by End User 2024 & 2032
- Figure 59: Latin America Digital TV SOC Market Revenue (Million), by Country 2024 & 2032
- Figure 60: Latin America Digital TV SOC Market Volume (Billion), by Country 2024 & 2032
- Figure 61: Latin America Digital TV SOC Market Revenue Share (%), by Country 2024 & 2032
- Figure 62: Latin America Digital TV SOC Market Volume Share (%), by Country 2024 & 2032
- Figure 63: Middle East and Africa Digital TV SOC Market Revenue (Million), by Application 2024 & 2032
- Figure 64: Middle East and Africa Digital TV SOC Market Volume (Billion), by Application 2024 & 2032
- Figure 65: Middle East and Africa Digital TV SOC Market Revenue Share (%), by Application 2024 & 2032
- Figure 66: Middle East and Africa Digital TV SOC Market Volume Share (%), by Application 2024 & 2032
- Figure 67: Middle East and Africa Digital TV SOC Market Revenue (Million), by End User 2024 & 2032
- Figure 68: Middle East and Africa Digital TV SOC Market Volume (Billion), by End User 2024 & 2032
- Figure 69: Middle East and Africa Digital TV SOC Market Revenue Share (%), by End User 2024 & 2032
- Figure 70: Middle East and Africa Digital TV SOC Market Volume Share (%), by End User 2024 & 2032
- Figure 71: Middle East and Africa Digital TV SOC Market Revenue (Million), by Country 2024 & 2032
- Figure 72: Middle East and Africa Digital TV SOC Market Volume (Billion), by Country 2024 & 2032
- Figure 73: Middle East and Africa Digital TV SOC Market Revenue Share (%), by Country 2024 & 2032
- Figure 74: Middle East and Africa Digital TV SOC Market Volume Share (%), by Country 2024 & 2032
List of Tables
- Table 1: Global Digital TV SOC Market Revenue Million Forecast, by Region 2019 & 2032
- Table 2: Global Digital TV SOC Market Volume Billion Forecast, by Region 2019 & 2032
- Table 3: Global Digital TV SOC Market Revenue Million Forecast, by Application 2019 & 2032
- Table 4: Global Digital TV SOC Market Volume Billion Forecast, by Application 2019 & 2032
- Table 5: Global Digital TV SOC Market Revenue Million Forecast, by End User 2019 & 2032
- Table 6: Global Digital TV SOC Market Volume Billion Forecast, by End User 2019 & 2032
- Table 7: Global Digital TV SOC Market Revenue Million Forecast, by Region 2019 & 2032
- Table 8: Global Digital TV SOC Market Volume Billion Forecast, by Region 2019 & 2032
- Table 9: Global Digital TV SOC Market Revenue Million Forecast, by Application 2019 & 2032
- Table 10: Global Digital TV SOC Market Volume Billion Forecast, by Application 2019 & 2032
- Table 11: Global Digital TV SOC Market Revenue Million Forecast, by End User 2019 & 2032
- Table 12: Global Digital TV SOC Market Volume Billion Forecast, by End User 2019 & 2032
- Table 13: Global Digital TV SOC Market Revenue Million Forecast, by Country 2019 & 2032
- Table 14: Global Digital TV SOC Market Volume Billion Forecast, by Country 2019 & 2032
- Table 15: Global Digital TV SOC Market Revenue Million Forecast, by Application 2019 & 2032
- Table 16: Global Digital TV SOC Market Volume Billion Forecast, by Application 2019 & 2032
- Table 17: Global Digital TV SOC Market Revenue Million Forecast, by End User 2019 & 2032
- Table 18: Global Digital TV SOC Market Volume Billion Forecast, by End User 2019 & 2032
- Table 19: Global Digital TV SOC Market Revenue Million Forecast, by Country 2019 & 2032
- Table 20: Global Digital TV SOC Market Volume Billion Forecast, by Country 2019 & 2032
- Table 21: Global Digital TV SOC Market Revenue Million Forecast, by Application 2019 & 2032
- Table 22: Global Digital TV SOC Market Volume Billion Forecast, by Application 2019 & 2032
- Table 23: Global Digital TV SOC Market Revenue Million Forecast, by End User 2019 & 2032
- Table 24: Global Digital TV SOC Market Volume Billion Forecast, by End User 2019 & 2032
- Table 25: Global Digital TV SOC Market Revenue Million Forecast, by Country 2019 & 2032
- Table 26: Global Digital TV SOC Market Volume Billion Forecast, by Country 2019 & 2032
- Table 27: Global Digital TV SOC Market Revenue Million Forecast, by Application 2019 & 2032
- Table 28: Global Digital TV SOC Market Volume Billion Forecast, by Application 2019 & 2032
- Table 29: Global Digital TV SOC Market Revenue Million Forecast, by End User 2019 & 2032
- Table 30: Global Digital TV SOC Market Volume Billion Forecast, by End User 2019 & 2032
- Table 31: Global Digital TV SOC Market Revenue Million Forecast, by Country 2019 & 2032
- Table 32: Global Digital TV SOC Market Volume Billion Forecast, by Country 2019 & 2032
- Table 33: Global Digital TV SOC Market Revenue Million Forecast, by Application 2019 & 2032
- Table 34: Global Digital TV SOC Market Volume Billion Forecast, by Application 2019 & 2032
- Table 35: Global Digital TV SOC Market Revenue Million Forecast, by End User 2019 & 2032
- Table 36: Global Digital TV SOC Market Volume Billion Forecast, by End User 2019 & 2032
- Table 37: Global Digital TV SOC Market Revenue Million Forecast, by Country 2019 & 2032
- Table 38: Global Digital TV SOC Market Volume Billion Forecast, by Country 2019 & 2032
- Table 39: Global Digital TV SOC Market Revenue Million Forecast, by Application 2019 & 2032
- Table 40: Global Digital TV SOC Market Volume Billion Forecast, by Application 2019 & 2032
- Table 41: Global Digital TV SOC Market Revenue Million Forecast, by End User 2019 & 2032
- Table 42: Global Digital TV SOC Market Volume Billion Forecast, by End User 2019 & 2032
- Table 43: Global Digital TV SOC Market Revenue Million Forecast, by Country 2019 & 2032
- Table 44: Global Digital TV SOC Market Volume Billion Forecast, by Country 2019 & 2032
Frequently Asked Questions
1. What is the projected Compound Annual Growth Rate (CAGR) of the Digital TV SOC Market?
The projected CAGR is approximately 12.90%.
2. Which companies are prominent players in the Digital TV SOC Market?
Key companies in the market include Broadcom Inc, MediaTek Inc, Intel Corporation, Qualcomm Technologies Inc, Samsung Electronics Co Ltd, STMicroelectronics NV, Novatek Microelectronics Corp, MStar Semiconductor Inc, LG Electronics Inc, HiSilicon, NXP Semiconductors*List Not Exhaustive.
3. What are the main segments of the Digital TV SOC Market?
The market segments include Application, End User.
4. Can you provide details about the market size?
The market size is estimated to be USD 11.13 Million as of 2022.
5. What are some drivers contributing to market growth?
Increasing Demand for Smart TVs Will Drive the Market Growth; Rising Consumer Demand for High-definition and Ultra-high-definition (UHD) Content.
6. What are the notable trends driving market growth?
The Commercial Segment is Expected to Hold a Significant Market Share.
7. Are there any restraints impacting market growth?
Increasing Demand for Smart TVs Will Drive the Market Growth; Rising Consumer Demand for High-definition and Ultra-high-definition (UHD) Content.
8. Can you provide examples of recent developments in the market?
May 2024: MediaTek announced its Dimensity 9300+ system-on-chip (SoC), representing the company's newest advancement in processors designed for premium mobile applications. This chipset is equipped with 18 MB of L3 cache and system-level cache (SLC), and it is compatible with the latest LPDDR5T memory, achieving speeds of up to 9,600 Mbps, as well as UFS 4.0 storage. These capabilities enable the device to execute high-speed operations and multitask efficiently without sacrificing performance.January 2024: Videocon d2h, a direct-to-home (DTH) service provider, partnered with MStar Semiconductor. Under this collaboration, MStar Semiconductor is expected to supply its high-efficiency video codec (HEVC) H.265 system-on-chip (SoC) for Videocon's high-definition set-top boxes (STBs). MStar Semiconductor effectively integrated HEVC technology into its HD solutions, significantly optimizing bandwidth usage while delivering superior picture quality. This partnership enables operators and STB original equipment manufacturers (OEMs) to lower their development expenses and accelerate their time to market, thereby addressing the demands of the Indian market with the MStar HEVC-capable set-top box SoC solution.
9. What pricing options are available for accessing the report?
Pricing options include single-user, multi-user, and enterprise licenses priced at USD 4750, USD 5250, and USD 8750 respectively.
10. Is the market size provided in terms of value or volume?
The market size is provided in terms of value, measured in Million and volume, measured in Billion.
11. Are there any specific market keywords associated with the report?
Yes, the market keyword associated with the report is "Digital TV SOC Market," which aids in identifying and referencing the specific market segment covered.
12. How do I determine which pricing option suits my needs best?
The pricing options vary based on user requirements and access needs. Individual users may opt for single-user licenses, while businesses requiring broader access may choose multi-user or enterprise licenses for cost-effective access to the report.
13. Are there any additional resources or data provided in the Digital TV SOC Market report?
While the report offers comprehensive insights, it's advisable to review the specific contents or supplementary materials provided to ascertain if additional resources or data are available.
14. How can I stay updated on further developments or reports in the Digital TV SOC Market?
To stay informed about further developments, trends, and reports in the Digital TV SOC Market, consider subscribing to industry newsletters, following relevant companies and organizations, or regularly checking reputable industry news sources and publications.
Methodology
Step 1 - Identification of Relevant Samples Size from Population Database


Step 2 - Approaches for Defining Global Market Size (Value, Volume* & Price*)

Note*: In applicable scenarios
Step 3 - Data Sources
Primary Research
- Web Analytics
- Survey Reports
- Research Institute
- Latest Research Reports
- Opinion Leaders
Secondary Research
- Annual Reports
- White Paper
- Latest Press Release
- Industry Association
- Paid Database
- Investor Presentations

Step 4 - Data Triangulation
Involves using different sources of information in order to increase the validity of a study
These sources are likely to be stakeholders in a program - participants, other researchers, program staff, other community members, and so on.
Then we put all data in single framework & apply various statistical tools to find out the dynamic on the market.
During the analysis stage, feedback from the stakeholder groups would be compared to determine areas of agreement as well as areas of divergence


