
Key Insights
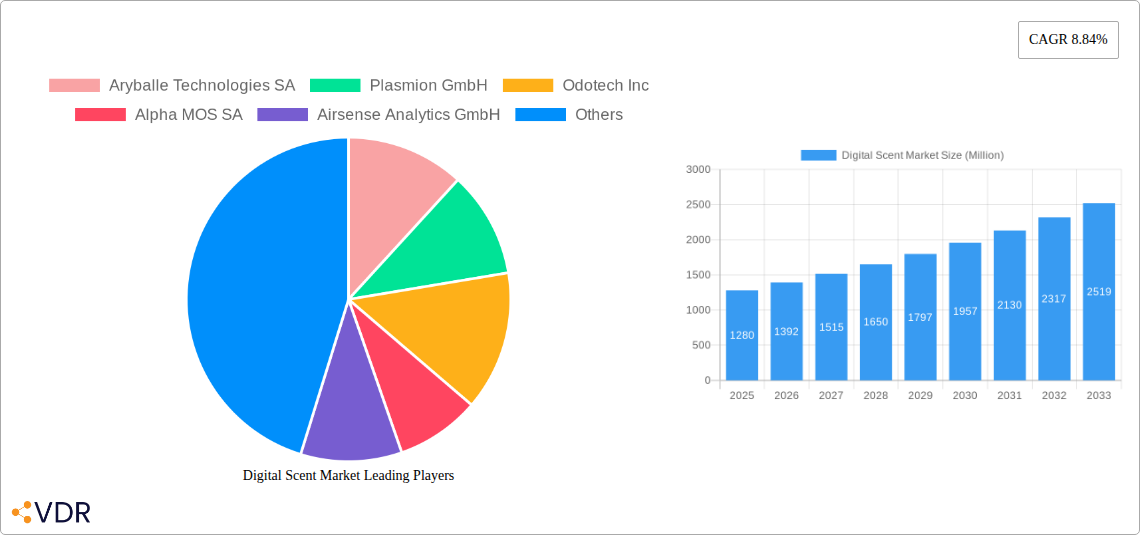
The digital scent market, valued at $1.28 billion in 2025, is projected to experience robust growth, driven by a compound annual growth rate (CAGR) of 8.84% from 2025 to 2033. This expansion is fueled by several key factors. The increasing adoption of e-noses in various sectors, including healthcare for disease diagnostics and food and beverage for quality control, is a major driver. Furthermore, advancements in scent synthesis technology are enabling the creation of more accurate and nuanced digital scents, expanding applications in areas such as virtual reality and personalized fragrance experiences. The military and defense sector is also contributing significantly to market growth, utilizing digital scent technology for explosive detection and environmental monitoring. However, high initial investment costs associated with the technology and the need for skilled personnel to operate and maintain the equipment pose challenges to wider market penetration. Despite these restraints, the ongoing miniaturization and cost reduction of scent sensors, coupled with rising consumer demand for personalized experiences, are expected to propel market growth throughout the forecast period.
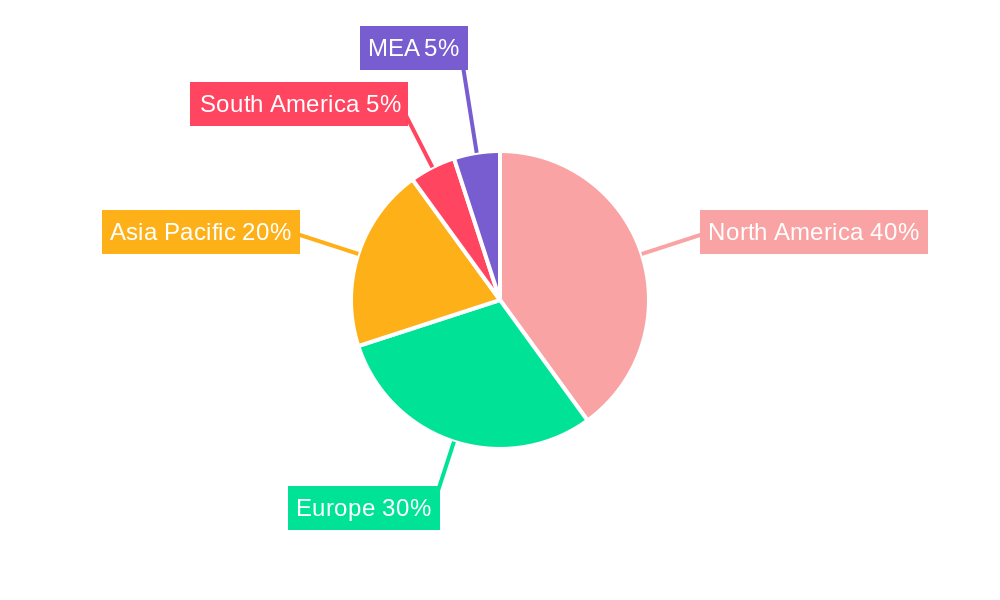
The market segmentation reveals a significant contribution from the e-nose hardware segment, which is expected to maintain its dominance due to ongoing technological innovations and cost optimization. North America currently holds a substantial market share due to advanced technological infrastructure and a higher adoption rate across diverse industries. However, the Asia-Pacific region, particularly China and India, is anticipated to witness rapid growth in the coming years driven by increasing disposable incomes and rising investments in research and development in this field. Europe also represents a sizable market, with Germany, the United Kingdom, and France leading in terms of technology adoption and market penetration. The competitive landscape is characterized by a mix of established players and emerging companies, fostering innovation and driving technological advancements within the digital scent market. This dynamic environment suggests a promising outlook for the continued expansion of this exciting and rapidly evolving sector.
Digital Scent Market: A Comprehensive Report (2019-2033)
This comprehensive report provides an in-depth analysis of the Digital Scent Market, encompassing market dynamics, growth trends, regional dominance, product landscape, key players, and future outlook. The study period covers 2019-2033, with 2025 as the base and estimated year. The report utilizes data from the historical period (2019-2024) to project market trends and opportunities until 2033. This report is essential for industry professionals, investors, and anyone seeking to understand and navigate this rapidly evolving market. The market is segmented by end-user industry (Military and Defense, Healthcare, Food and Beverage, Waste Management (Environmental Monitoring), Other End-user Industries) and hardware (Scent Synthesizer, E-Nose).
Digital Scent Market Dynamics & Structure
The Digital Scent Market is characterized by moderate concentration, with several key players vying for market share. Technological innovation, particularly in sensor technology and AI-driven scent analysis, is a primary growth driver. Regulatory frameworks concerning safety and data privacy are increasingly influential, while the lack of standardized testing protocols presents a challenge. The market also faces competition from traditional scent delivery methods. Mergers and acquisitions (M&A) activity is expected to increase as larger companies seek to consolidate their positions. The overall market size in 2025 is estimated at xx Million, with a projected CAGR of xx% during the forecast period.
- Market Concentration: Moderately concentrated, with top 5 players holding approximately xx% of the market share in 2025.
- Technological Innovation: Miniaturization of sensors, improved algorithms for scent recognition, and the integration of AI are key drivers.
- Regulatory Landscape: Evolving regulations related to data privacy and product safety are shaping market development.
- Competitive Substitutes: Traditional scent delivery methods (e.g., perfumes, air fresheners) pose a competitive threat.
- M&A Activity: An increasing number of M&A deals are anticipated, driving market consolidation.
- Innovation Barriers: High R&D costs, lack of standardization, and complexities in scent data analysis pose challenges.
Digital Scent Market Growth Trends & Insights
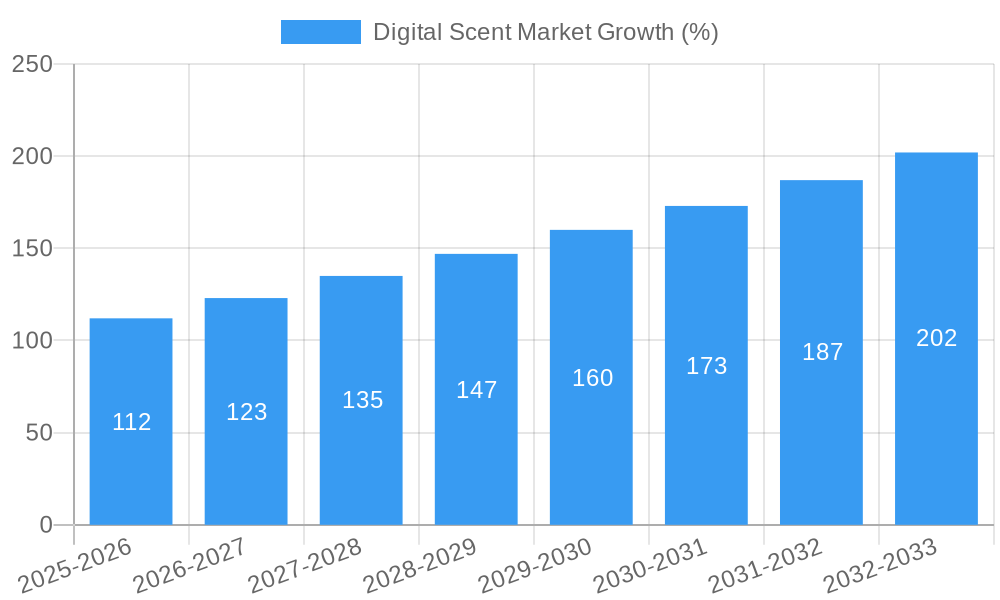
The Digital Scent Market exhibits robust growth, driven by increasing demand across diverse sectors. Adoption rates are rising rapidly, particularly in healthcare and environmental monitoring. Technological advancements such as the development of more sensitive and precise sensors are fueling market expansion. Consumer behavior shifts towards personalized experiences and health-conscious choices are also positively impacting market growth. The market size is projected to reach xx Million by 2033, exhibiting a robust CAGR.
Dominant Regions, Countries, or Segments in Digital Scent Market
The Healthcare segment is currently the leading end-user industry, driven by applications in diagnostics and therapeutic interventions. North America and Europe are expected to maintain their dominance in the coming years due to high technological advancements and significant R&D investment. The E-Nose segment, owing to its versatility and cost-effectiveness, holds a larger market share compared to Scent Synthesizers.
- Leading Region: North America, driven by early adoption, technological innovation, and robust healthcare infrastructure.
- Fastest-Growing Region: Asia-Pacific, fueled by increasing investments in healthcare, environmental monitoring, and rising consumer awareness.
- Dominant Segment (End-user): Healthcare, driven by applications in disease diagnosis, personalized medicine, and patient monitoring.
- Dominant Segment (Hardware): E-Nose, due to its cost-effectiveness and suitability for a wider range of applications.
- Key Drivers: Government funding for R&D, rising demand for advanced diagnostic tools, increasing environmental regulations.
Digital Scent Market Product Landscape
The digital scent market offers diverse product offerings, including sophisticated E-noses with enhanced sensitivity and accuracy, and advanced scent synthesizers capable of recreating complex aromas. These products are increasingly finding applications in various sectors, driving growth. Unique selling propositions (USPs) center around precision, reliability, and data-driven insights. Miniaturization and cost reduction efforts are ongoing, expanding the potential applications of these technologies.
Key Drivers, Barriers & Challenges in Digital Scent Market
Key Drivers: The rising demand for personalized experiences, increasing investments in R&D, and the growing awareness of the importance of scent in various applications are major growth drivers. Government support for technological advancements and the development of new applications, coupled with the need for improved environmental monitoring systems, further propel market growth.
Key Challenges: High initial investment costs, lack of standardization in scent analysis methods, and the need for robust data security measures are significant challenges. Competition from traditional scent technologies and supply chain disruptions also pose potential threats.
Emerging Opportunities in Digital Scent Market
Untapped markets in developing economies, the integration of digital scent technology with other sensory technologies (e.g., sight, sound), and the development of novel applications in areas like cosmetics and personalized fragrance design represent significant opportunities. The market is poised to see significant growth through expansion into new sectors and innovative product development.
Growth Accelerators in the Digital Scent Market Industry
Technological breakthroughs in sensor technology, strategic partnerships between technology developers and end-users (e.g., healthcare providers, food manufacturers), and successful market expansion strategies into emerging economies are likely to drive long-term market growth. The continued development of user-friendly interfaces and the creation of robust data analytics platforms further contribute to the market's expansion.
Key Players Shaping the Digital Scent Market Market
- Aryballe Technologies SA
- Plasmion GmbH
- Odotech Inc
- Alpha MOS SA
- Airsense Analytics GmbH
- Electronic Sensor Technology
- The eNose Company
- Comon Invent BV
Notable Milestones in Digital Scent Market Sector
- April 2022: Launch of the EU-funded SMELLODI project for body odor diagnostics, indicating significant R&D investment in the sector.
- January 2022: Inhalio's introduction of its Digital Scent 3.0 Platform, showcasing technological advancements in scent delivery and control.
In-Depth Digital Scent Market Market Outlook
The Digital Scent Market is poised for significant growth, driven by continuous technological advancements and increasing adoption across diverse sectors. Strategic partnerships, focused R&D efforts, and expansion into new markets present substantial opportunities for companies operating in this dynamic industry. The long-term outlook is positive, with the market expected to experience robust growth and expansion across a range of applications.
Digital Scent Market Segmentation
-
1. Hardware
- 1.1. Scent Synthesizer
- 1.2. E-Nose
-
2. End-user Industry
- 2.1. Military and Defense
- 2.2. Healthcare
- 2.3. Food and Beverage
- 2.4. Waste Management
- 2.5. Other End-user Industries
Digital Scent Market Segmentation By Geography
- 1. North America
- 2. Europe
- 3. Asia Pacific
- 4. Rest of the World
Digital Scent Market REPORT HIGHLIGHTS
| Aspects | Details |
|---|---|
| Study Period | 2019-2033 |
| Base Year | 2024 |
| Estimated Year | 2025 |
| Forecast Period | 2025-2033 |
| Historical Period | 2019-2024 |
| Growth Rate | CAGR of 8.84% from 2019-2033 |
| Segmentation |
|
Table of Contents
- 1. Introduction
- 1.1. Research Scope
- 1.2. Market Segmentation
- 1.3. Research Methodology
- 1.4. Definitions and Assumptions
- 2. Executive Summary
- 2.1. Introduction
- 3. Market Dynamics
- 3.1. Introduction
- 3.2. Market Drivers
- 3.2.1. Introduction of AI in Digital Scent Technology
- 3.3. Market Restrains
- 3.3.1. High Initial Cost of Electronic Noses
- 3.4. Market Trends
- 3.4.1. Introduction of AI in Digital Scent Technology
- 4. Market Factor Analysis
- 4.1. Porters Five Forces
- 4.2. Supply/Value Chain
- 4.3. PESTEL analysis
- 4.4. Market Entropy
- 4.5. Patent/Trademark Analysis
- 5. Global Digital Scent Market Analysis, Insights and Forecast, 2019-2031
- 5.1. Market Analysis, Insights and Forecast - by Hardware
- 5.1.1. Scent Synthesizer
- 5.1.2. E-Nose
- 5.2. Market Analysis, Insights and Forecast - by End-user Industry
- 5.2.1. Military and Defense
- 5.2.2. Healthcare
- 5.2.3. Food and Beverage
- 5.2.4. Waste Management
- 5.2.5. Other End-user Industries
- 5.3. Market Analysis, Insights and Forecast - by Region
- 5.3.1. North America
- 5.3.2. Europe
- 5.3.3. Asia Pacific
- 5.3.4. Rest of the World
- 5.1. Market Analysis, Insights and Forecast - by Hardware
- 6. North America Digital Scent Market Analysis, Insights and Forecast, 2019-2031
- 6.1. Market Analysis, Insights and Forecast - by Hardware
- 6.1.1. Scent Synthesizer
- 6.1.2. E-Nose
- 6.2. Market Analysis, Insights and Forecast - by End-user Industry
- 6.2.1. Military and Defense
- 6.2.2. Healthcare
- 6.2.3. Food and Beverage
- 6.2.4. Waste Management
- 6.2.5. Other End-user Industries
- 6.1. Market Analysis, Insights and Forecast - by Hardware
- 7. Europe Digital Scent Market Analysis, Insights and Forecast, 2019-2031
- 7.1. Market Analysis, Insights and Forecast - by Hardware
- 7.1.1. Scent Synthesizer
- 7.1.2. E-Nose
- 7.2. Market Analysis, Insights and Forecast - by End-user Industry
- 7.2.1. Military and Defense
- 7.2.2. Healthcare
- 7.2.3. Food and Beverage
- 7.2.4. Waste Management
- 7.2.5. Other End-user Industries
- 7.1. Market Analysis, Insights and Forecast - by Hardware
- 8. Asia Pacific Digital Scent Market Analysis, Insights and Forecast, 2019-2031
- 8.1. Market Analysis, Insights and Forecast - by Hardware
- 8.1.1. Scent Synthesizer
- 8.1.2. E-Nose
- 8.2. Market Analysis, Insights and Forecast - by End-user Industry
- 8.2.1. Military and Defense
- 8.2.2. Healthcare
- 8.2.3. Food and Beverage
- 8.2.4. Waste Management
- 8.2.5. Other End-user Industries
- 8.1. Market Analysis, Insights and Forecast - by Hardware
- 9. Rest of the World Digital Scent Market Analysis, Insights and Forecast, 2019-2031
- 9.1. Market Analysis, Insights and Forecast - by Hardware
- 9.1.1. Scent Synthesizer
- 9.1.2. E-Nose
- 9.2. Market Analysis, Insights and Forecast - by End-user Industry
- 9.2.1. Military and Defense
- 9.2.2. Healthcare
- 9.2.3. Food and Beverage
- 9.2.4. Waste Management
- 9.2.5. Other End-user Industries
- 9.1. Market Analysis, Insights and Forecast - by Hardware
- 10. North America Digital Scent Market Analysis, Insights and Forecast, 2019-2031
- 10.1. Market Analysis, Insights and Forecast - By Country/Sub-region
- 10.1.1 United States
- 10.1.2 Canada
- 10.1.3 Mexico
- 11. Europe Digital Scent Market Analysis, Insights and Forecast, 2019-2031
- 11.1. Market Analysis, Insights and Forecast - By Country/Sub-region
- 11.1.1 Germany
- 11.1.2 United Kingdom
- 11.1.3 France
- 11.1.4 Spain
- 11.1.5 Italy
- 11.1.6 Spain
- 11.1.7 Belgium
- 11.1.8 Netherland
- 11.1.9 Nordics
- 11.1.10 Rest of Europe
- 12. Asia Pacific Digital Scent Market Analysis, Insights and Forecast, 2019-2031
- 12.1. Market Analysis, Insights and Forecast - By Country/Sub-region
- 12.1.1 China
- 12.1.2 Japan
- 12.1.3 India
- 12.1.4 South Korea
- 12.1.5 Southeast Asia
- 12.1.6 Australia
- 12.1.7 Indonesia
- 12.1.8 Phillipes
- 12.1.9 Singapore
- 12.1.10 Thailandc
- 12.1.11 Rest of Asia Pacific
- 13. South America Digital Scent Market Analysis, Insights and Forecast, 2019-2031
- 13.1. Market Analysis, Insights and Forecast - By Country/Sub-region
- 13.1.1 Brazil
- 13.1.2 Argentina
- 13.1.3 Peru
- 13.1.4 Chile
- 13.1.5 Colombia
- 13.1.6 Ecuador
- 13.1.7 Venezuela
- 13.1.8 Rest of South America
- 14. North America Digital Scent Market Analysis, Insights and Forecast, 2019-2031
- 14.1. Market Analysis, Insights and Forecast - By Country/Sub-region
- 14.1.1 United States
- 14.1.2 Canada
- 14.1.3 Mexico
- 15. MEA Digital Scent Market Analysis, Insights and Forecast, 2019-2031
- 15.1. Market Analysis, Insights and Forecast - By Country/Sub-region
- 15.1.1 United Arab Emirates
- 15.1.2 Saudi Arabia
- 15.1.3 South Africa
- 15.1.4 Rest of Middle East and Africa
- 16. Competitive Analysis
- 16.1. Global Market Share Analysis 2024
- 16.2. Company Profiles
- 16.2.1 Aryballe Technologies SA
- 16.2.1.1. Overview
- 16.2.1.2. Products
- 16.2.1.3. SWOT Analysis
- 16.2.1.4. Recent Developments
- 16.2.1.5. Financials (Based on Availability)
- 16.2.2 Plasmion GmbH
- 16.2.2.1. Overview
- 16.2.2.2. Products
- 16.2.2.3. SWOT Analysis
- 16.2.2.4. Recent Developments
- 16.2.2.5. Financials (Based on Availability)
- 16.2.3 Odotech Inc
- 16.2.3.1. Overview
- 16.2.3.2. Products
- 16.2.3.3. SWOT Analysis
- 16.2.3.4. Recent Developments
- 16.2.3.5. Financials (Based on Availability)
- 16.2.4 Alpha MOS SA
- 16.2.4.1. Overview
- 16.2.4.2. Products
- 16.2.4.3. SWOT Analysis
- 16.2.4.4. Recent Developments
- 16.2.4.5. Financials (Based on Availability)
- 16.2.5 Airsense Analytics GmbH
- 16.2.5.1. Overview
- 16.2.5.2. Products
- 16.2.5.3. SWOT Analysis
- 16.2.5.4. Recent Developments
- 16.2.5.5. Financials (Based on Availability)
- 16.2.6 Electronic Sensor Technology
- 16.2.6.1. Overview
- 16.2.6.2. Products
- 16.2.6.3. SWOT Analysis
- 16.2.6.4. Recent Developments
- 16.2.6.5. Financials (Based on Availability)
- 16.2.7 The eNose Company
- 16.2.7.1. Overview
- 16.2.7.2. Products
- 16.2.7.3. SWOT Analysis
- 16.2.7.4. Recent Developments
- 16.2.7.5. Financials (Based on Availability)
- 16.2.8 Comon Invent BV
- 16.2.8.1. Overview
- 16.2.8.2. Products
- 16.2.8.3. SWOT Analysis
- 16.2.8.4. Recent Developments
- 16.2.8.5. Financials (Based on Availability)
- 16.2.1 Aryballe Technologies SA
List of Figures
- Figure 1: Global Digital Scent Market Revenue Breakdown (Million, %) by Region 2024 & 2032
- Figure 2: Global Digital Scent Market Volume Breakdown (K Unit, %) by Region 2024 & 2032
- Figure 3: North America Digital Scent Market Revenue (Million), by Country 2024 & 2032
- Figure 4: North America Digital Scent Market Volume (K Unit), by Country 2024 & 2032
- Figure 5: North America Digital Scent Market Revenue Share (%), by Country 2024 & 2032
- Figure 6: North America Digital Scent Market Volume Share (%), by Country 2024 & 2032
- Figure 7: Europe Digital Scent Market Revenue (Million), by Country 2024 & 2032
- Figure 8: Europe Digital Scent Market Volume (K Unit), by Country 2024 & 2032
- Figure 9: Europe Digital Scent Market Revenue Share (%), by Country 2024 & 2032
- Figure 10: Europe Digital Scent Market Volume Share (%), by Country 2024 & 2032
- Figure 11: Asia Pacific Digital Scent Market Revenue (Million), by Country 2024 & 2032
- Figure 12: Asia Pacific Digital Scent Market Volume (K Unit), by Country 2024 & 2032
- Figure 13: Asia Pacific Digital Scent Market Revenue Share (%), by Country 2024 & 2032
- Figure 14: Asia Pacific Digital Scent Market Volume Share (%), by Country 2024 & 2032
- Figure 15: South America Digital Scent Market Revenue (Million), by Country 2024 & 2032
- Figure 16: South America Digital Scent Market Volume (K Unit), by Country 2024 & 2032
- Figure 17: South America Digital Scent Market Revenue Share (%), by Country 2024 & 2032
- Figure 18: South America Digital Scent Market Volume Share (%), by Country 2024 & 2032
- Figure 19: North America Digital Scent Market Revenue (Million), by Country 2024 & 2032
- Figure 20: North America Digital Scent Market Volume (K Unit), by Country 2024 & 2032
- Figure 21: North America Digital Scent Market Revenue Share (%), by Country 2024 & 2032
- Figure 22: North America Digital Scent Market Volume Share (%), by Country 2024 & 2032
- Figure 23: MEA Digital Scent Market Revenue (Million), by Country 2024 & 2032
- Figure 24: MEA Digital Scent Market Volume (K Unit), by Country 2024 & 2032
- Figure 25: MEA Digital Scent Market Revenue Share (%), by Country 2024 & 2032
- Figure 26: MEA Digital Scent Market Volume Share (%), by Country 2024 & 2032
- Figure 27: North America Digital Scent Market Revenue (Million), by Hardware 2024 & 2032
- Figure 28: North America Digital Scent Market Volume (K Unit), by Hardware 2024 & 2032
- Figure 29: North America Digital Scent Market Revenue Share (%), by Hardware 2024 & 2032
- Figure 30: North America Digital Scent Market Volume Share (%), by Hardware 2024 & 2032
- Figure 31: North America Digital Scent Market Revenue (Million), by End-user Industry 2024 & 2032
- Figure 32: North America Digital Scent Market Volume (K Unit), by End-user Industry 2024 & 2032
- Figure 33: North America Digital Scent Market Revenue Share (%), by End-user Industry 2024 & 2032
- Figure 34: North America Digital Scent Market Volume Share (%), by End-user Industry 2024 & 2032
- Figure 35: North America Digital Scent Market Revenue (Million), by Country 2024 & 2032
- Figure 36: North America Digital Scent Market Volume (K Unit), by Country 2024 & 2032
- Figure 37: North America Digital Scent Market Revenue Share (%), by Country 2024 & 2032
- Figure 38: North America Digital Scent Market Volume Share (%), by Country 2024 & 2032
- Figure 39: Europe Digital Scent Market Revenue (Million), by Hardware 2024 & 2032
- Figure 40: Europe Digital Scent Market Volume (K Unit), by Hardware 2024 & 2032
- Figure 41: Europe Digital Scent Market Revenue Share (%), by Hardware 2024 & 2032
- Figure 42: Europe Digital Scent Market Volume Share (%), by Hardware 2024 & 2032
- Figure 43: Europe Digital Scent Market Revenue (Million), by End-user Industry 2024 & 2032
- Figure 44: Europe Digital Scent Market Volume (K Unit), by End-user Industry 2024 & 2032
- Figure 45: Europe Digital Scent Market Revenue Share (%), by End-user Industry 2024 & 2032
- Figure 46: Europe Digital Scent Market Volume Share (%), by End-user Industry 2024 & 2032
- Figure 47: Europe Digital Scent Market Revenue (Million), by Country 2024 & 2032
- Figure 48: Europe Digital Scent Market Volume (K Unit), by Country 2024 & 2032
- Figure 49: Europe Digital Scent Market Revenue Share (%), by Country 2024 & 2032
- Figure 50: Europe Digital Scent Market Volume Share (%), by Country 2024 & 2032
- Figure 51: Asia Pacific Digital Scent Market Revenue (Million), by Hardware 2024 & 2032
- Figure 52: Asia Pacific Digital Scent Market Volume (K Unit), by Hardware 2024 & 2032
- Figure 53: Asia Pacific Digital Scent Market Revenue Share (%), by Hardware 2024 & 2032
- Figure 54: Asia Pacific Digital Scent Market Volume Share (%), by Hardware 2024 & 2032
- Figure 55: Asia Pacific Digital Scent Market Revenue (Million), by End-user Industry 2024 & 2032
- Figure 56: Asia Pacific Digital Scent Market Volume (K Unit), by End-user Industry 2024 & 2032
- Figure 57: Asia Pacific Digital Scent Market Revenue Share (%), by End-user Industry 2024 & 2032
- Figure 58: Asia Pacific Digital Scent Market Volume Share (%), by End-user Industry 2024 & 2032
- Figure 59: Asia Pacific Digital Scent Market Revenue (Million), by Country 2024 & 2032
- Figure 60: Asia Pacific Digital Scent Market Volume (K Unit), by Country 2024 & 2032
- Figure 61: Asia Pacific Digital Scent Market Revenue Share (%), by Country 2024 & 2032
- Figure 62: Asia Pacific Digital Scent Market Volume Share (%), by Country 2024 & 2032
- Figure 63: Rest of the World Digital Scent Market Revenue (Million), by Hardware 2024 & 2032
- Figure 64: Rest of the World Digital Scent Market Volume (K Unit), by Hardware 2024 & 2032
- Figure 65: Rest of the World Digital Scent Market Revenue Share (%), by Hardware 2024 & 2032
- Figure 66: Rest of the World Digital Scent Market Volume Share (%), by Hardware 2024 & 2032
- Figure 67: Rest of the World Digital Scent Market Revenue (Million), by End-user Industry 2024 & 2032
- Figure 68: Rest of the World Digital Scent Market Volume (K Unit), by End-user Industry 2024 & 2032
- Figure 69: Rest of the World Digital Scent Market Revenue Share (%), by End-user Industry 2024 & 2032
- Figure 70: Rest of the World Digital Scent Market Volume Share (%), by End-user Industry 2024 & 2032
- Figure 71: Rest of the World Digital Scent Market Revenue (Million), by Country 2024 & 2032
- Figure 72: Rest of the World Digital Scent Market Volume (K Unit), by Country 2024 & 2032
- Figure 73: Rest of the World Digital Scent Market Revenue Share (%), by Country 2024 & 2032
- Figure 74: Rest of the World Digital Scent Market Volume Share (%), by Country 2024 & 2032
List of Tables
- Table 1: Global Digital Scent Market Revenue Million Forecast, by Region 2019 & 2032
- Table 2: Global Digital Scent Market Volume K Unit Forecast, by Region 2019 & 2032
- Table 3: Global Digital Scent Market Revenue Million Forecast, by Hardware 2019 & 2032
- Table 4: Global Digital Scent Market Volume K Unit Forecast, by Hardware 2019 & 2032
- Table 5: Global Digital Scent Market Revenue Million Forecast, by End-user Industry 2019 & 2032
- Table 6: Global Digital Scent Market Volume K Unit Forecast, by End-user Industry 2019 & 2032
- Table 7: Global Digital Scent Market Revenue Million Forecast, by Region 2019 & 2032
- Table 8: Global Digital Scent Market Volume K Unit Forecast, by Region 2019 & 2032
- Table 9: Global Digital Scent Market Revenue Million Forecast, by Country 2019 & 2032
- Table 10: Global Digital Scent Market Volume K Unit Forecast, by Country 2019 & 2032
- Table 11: United States Digital Scent Market Revenue (Million) Forecast, by Application 2019 & 2032
- Table 12: United States Digital Scent Market Volume (K Unit) Forecast, by Application 2019 & 2032
- Table 13: Canada Digital Scent Market Revenue (Million) Forecast, by Application 2019 & 2032
- Table 14: Canada Digital Scent Market Volume (K Unit) Forecast, by Application 2019 & 2032
- Table 15: Mexico Digital Scent Market Revenue (Million) Forecast, by Application 2019 & 2032
- Table 16: Mexico Digital Scent Market Volume (K Unit) Forecast, by Application 2019 & 2032
- Table 17: Global Digital Scent Market Revenue Million Forecast, by Country 2019 & 2032
- Table 18: Global Digital Scent Market Volume K Unit Forecast, by Country 2019 & 2032
- Table 19: Germany Digital Scent Market Revenue (Million) Forecast, by Application 2019 & 2032
- Table 20: Germany Digital Scent Market Volume (K Unit) Forecast, by Application 2019 & 2032
- Table 21: United Kingdom Digital Scent Market Revenue (Million) Forecast, by Application 2019 & 2032
- Table 22: United Kingdom Digital Scent Market Volume (K Unit) Forecast, by Application 2019 & 2032
- Table 23: France Digital Scent Market Revenue (Million) Forecast, by Application 2019 & 2032
- Table 24: France Digital Scent Market Volume (K Unit) Forecast, by Application 2019 & 2032
- Table 25: Spain Digital Scent Market Revenue (Million) Forecast, by Application 2019 & 2032
- Table 26: Spain Digital Scent Market Volume (K Unit) Forecast, by Application 2019 & 2032
- Table 27: Italy Digital Scent Market Revenue (Million) Forecast, by Application 2019 & 2032
- Table 28: Italy Digital Scent Market Volume (K Unit) Forecast, by Application 2019 & 2032
- Table 29: Spain Digital Scent Market Revenue (Million) Forecast, by Application 2019 & 2032
- Table 30: Spain Digital Scent Market Volume (K Unit) Forecast, by Application 2019 & 2032
- Table 31: Belgium Digital Scent Market Revenue (Million) Forecast, by Application 2019 & 2032
- Table 32: Belgium Digital Scent Market Volume (K Unit) Forecast, by Application 2019 & 2032
- Table 33: Netherland Digital Scent Market Revenue (Million) Forecast, by Application 2019 & 2032
- Table 34: Netherland Digital Scent Market Volume (K Unit) Forecast, by Application 2019 & 2032
- Table 35: Nordics Digital Scent Market Revenue (Million) Forecast, by Application 2019 & 2032
- Table 36: Nordics Digital Scent Market Volume (K Unit) Forecast, by Application 2019 & 2032
- Table 37: Rest of Europe Digital Scent Market Revenue (Million) Forecast, by Application 2019 & 2032
- Table 38: Rest of Europe Digital Scent Market Volume (K Unit) Forecast, by Application 2019 & 2032
- Table 39: Global Digital Scent Market Revenue Million Forecast, by Country 2019 & 2032
- Table 40: Global Digital Scent Market Volume K Unit Forecast, by Country 2019 & 2032
- Table 41: China Digital Scent Market Revenue (Million) Forecast, by Application 2019 & 2032
- Table 42: China Digital Scent Market Volume (K Unit) Forecast, by Application 2019 & 2032
- Table 43: Japan Digital Scent Market Revenue (Million) Forecast, by Application 2019 & 2032
- Table 44: Japan Digital Scent Market Volume (K Unit) Forecast, by Application 2019 & 2032
- Table 45: India Digital Scent Market Revenue (Million) Forecast, by Application 2019 & 2032
- Table 46: India Digital Scent Market Volume (K Unit) Forecast, by Application 2019 & 2032
- Table 47: South Korea Digital Scent Market Revenue (Million) Forecast, by Application 2019 & 2032
- Table 48: South Korea Digital Scent Market Volume (K Unit) Forecast, by Application 2019 & 2032
- Table 49: Southeast Asia Digital Scent Market Revenue (Million) Forecast, by Application 2019 & 2032
- Table 50: Southeast Asia Digital Scent Market Volume (K Unit) Forecast, by Application 2019 & 2032
- Table 51: Australia Digital Scent Market Revenue (Million) Forecast, by Application 2019 & 2032
- Table 52: Australia Digital Scent Market Volume (K Unit) Forecast, by Application 2019 & 2032
- Table 53: Indonesia Digital Scent Market Revenue (Million) Forecast, by Application 2019 & 2032
- Table 54: Indonesia Digital Scent Market Volume (K Unit) Forecast, by Application 2019 & 2032
- Table 55: Phillipes Digital Scent Market Revenue (Million) Forecast, by Application 2019 & 2032
- Table 56: Phillipes Digital Scent Market Volume (K Unit) Forecast, by Application 2019 & 2032
- Table 57: Singapore Digital Scent Market Revenue (Million) Forecast, by Application 2019 & 2032
- Table 58: Singapore Digital Scent Market Volume (K Unit) Forecast, by Application 2019 & 2032
- Table 59: Thailandc Digital Scent Market Revenue (Million) Forecast, by Application 2019 & 2032
- Table 60: Thailandc Digital Scent Market Volume (K Unit) Forecast, by Application 2019 & 2032
- Table 61: Rest of Asia Pacific Digital Scent Market Revenue (Million) Forecast, by Application 2019 & 2032
- Table 62: Rest of Asia Pacific Digital Scent Market Volume (K Unit) Forecast, by Application 2019 & 2032
- Table 63: Global Digital Scent Market Revenue Million Forecast, by Country 2019 & 2032
- Table 64: Global Digital Scent Market Volume K Unit Forecast, by Country 2019 & 2032
- Table 65: Brazil Digital Scent Market Revenue (Million) Forecast, by Application 2019 & 2032
- Table 66: Brazil Digital Scent Market Volume (K Unit) Forecast, by Application 2019 & 2032
- Table 67: Argentina Digital Scent Market Revenue (Million) Forecast, by Application 2019 & 2032
- Table 68: Argentina Digital Scent Market Volume (K Unit) Forecast, by Application 2019 & 2032
- Table 69: Peru Digital Scent Market Revenue (Million) Forecast, by Application 2019 & 2032
- Table 70: Peru Digital Scent Market Volume (K Unit) Forecast, by Application 2019 & 2032
- Table 71: Chile Digital Scent Market Revenue (Million) Forecast, by Application 2019 & 2032
- Table 72: Chile Digital Scent Market Volume (K Unit) Forecast, by Application 2019 & 2032
- Table 73: Colombia Digital Scent Market Revenue (Million) Forecast, by Application 2019 & 2032
- Table 74: Colombia Digital Scent Market Volume (K Unit) Forecast, by Application 2019 & 2032
- Table 75: Ecuador Digital Scent Market Revenue (Million) Forecast, by Application 2019 & 2032
- Table 76: Ecuador Digital Scent Market Volume (K Unit) Forecast, by Application 2019 & 2032
- Table 77: Venezuela Digital Scent Market Revenue (Million) Forecast, by Application 2019 & 2032
- Table 78: Venezuela Digital Scent Market Volume (K Unit) Forecast, by Application 2019 & 2032
- Table 79: Rest of South America Digital Scent Market Revenue (Million) Forecast, by Application 2019 & 2032
- Table 80: Rest of South America Digital Scent Market Volume (K Unit) Forecast, by Application 2019 & 2032
- Table 81: Global Digital Scent Market Revenue Million Forecast, by Country 2019 & 2032
- Table 82: Global Digital Scent Market Volume K Unit Forecast, by Country 2019 & 2032
- Table 83: United States Digital Scent Market Revenue (Million) Forecast, by Application 2019 & 2032
- Table 84: United States Digital Scent Market Volume (K Unit) Forecast, by Application 2019 & 2032
- Table 85: Canada Digital Scent Market Revenue (Million) Forecast, by Application 2019 & 2032
- Table 86: Canada Digital Scent Market Volume (K Unit) Forecast, by Application 2019 & 2032
- Table 87: Mexico Digital Scent Market Revenue (Million) Forecast, by Application 2019 & 2032
- Table 88: Mexico Digital Scent Market Volume (K Unit) Forecast, by Application 2019 & 2032
- Table 89: Global Digital Scent Market Revenue Million Forecast, by Country 2019 & 2032
- Table 90: Global Digital Scent Market Volume K Unit Forecast, by Country 2019 & 2032
- Table 91: United Arab Emirates Digital Scent Market Revenue (Million) Forecast, by Application 2019 & 2032
- Table 92: United Arab Emirates Digital Scent Market Volume (K Unit) Forecast, by Application 2019 & 2032
- Table 93: Saudi Arabia Digital Scent Market Revenue (Million) Forecast, by Application 2019 & 2032
- Table 94: Saudi Arabia Digital Scent Market Volume (K Unit) Forecast, by Application 2019 & 2032
- Table 95: South Africa Digital Scent Market Revenue (Million) Forecast, by Application 2019 & 2032
- Table 96: South Africa Digital Scent Market Volume (K Unit) Forecast, by Application 2019 & 2032
- Table 97: Rest of Middle East and Africa Digital Scent Market Revenue (Million) Forecast, by Application 2019 & 2032
- Table 98: Rest of Middle East and Africa Digital Scent Market Volume (K Unit) Forecast, by Application 2019 & 2032
- Table 99: Global Digital Scent Market Revenue Million Forecast, by Hardware 2019 & 2032
- Table 100: Global Digital Scent Market Volume K Unit Forecast, by Hardware 2019 & 2032
- Table 101: Global Digital Scent Market Revenue Million Forecast, by End-user Industry 2019 & 2032
- Table 102: Global Digital Scent Market Volume K Unit Forecast, by End-user Industry 2019 & 2032
- Table 103: Global Digital Scent Market Revenue Million Forecast, by Country 2019 & 2032
- Table 104: Global Digital Scent Market Volume K Unit Forecast, by Country 2019 & 2032
- Table 105: Global Digital Scent Market Revenue Million Forecast, by Hardware 2019 & 2032
- Table 106: Global Digital Scent Market Volume K Unit Forecast, by Hardware 2019 & 2032
- Table 107: Global Digital Scent Market Revenue Million Forecast, by End-user Industry 2019 & 2032
- Table 108: Global Digital Scent Market Volume K Unit Forecast, by End-user Industry 2019 & 2032
- Table 109: Global Digital Scent Market Revenue Million Forecast, by Country 2019 & 2032
- Table 110: Global Digital Scent Market Volume K Unit Forecast, by Country 2019 & 2032
- Table 111: Global Digital Scent Market Revenue Million Forecast, by Hardware 2019 & 2032
- Table 112: Global Digital Scent Market Volume K Unit Forecast, by Hardware 2019 & 2032
- Table 113: Global Digital Scent Market Revenue Million Forecast, by End-user Industry 2019 & 2032
- Table 114: Global Digital Scent Market Volume K Unit Forecast, by End-user Industry 2019 & 2032
- Table 115: Global Digital Scent Market Revenue Million Forecast, by Country 2019 & 2032
- Table 116: Global Digital Scent Market Volume K Unit Forecast, by Country 2019 & 2032
- Table 117: Global Digital Scent Market Revenue Million Forecast, by Hardware 2019 & 2032
- Table 118: Global Digital Scent Market Volume K Unit Forecast, by Hardware 2019 & 2032
- Table 119: Global Digital Scent Market Revenue Million Forecast, by End-user Industry 2019 & 2032
- Table 120: Global Digital Scent Market Volume K Unit Forecast, by End-user Industry 2019 & 2032
- Table 121: Global Digital Scent Market Revenue Million Forecast, by Country 2019 & 2032
- Table 122: Global Digital Scent Market Volume K Unit Forecast, by Country 2019 & 2032
Frequently Asked Questions
1. What is the projected Compound Annual Growth Rate (CAGR) of the Digital Scent Market?
The projected CAGR is approximately 8.84%.
2. Which companies are prominent players in the Digital Scent Market?
Key companies in the market include Aryballe Technologies SA, Plasmion GmbH, Odotech Inc, Alpha MOS SA, Airsense Analytics GmbH, Electronic Sensor Technology, The eNose Company, Comon Invent BV.
3. What are the main segments of the Digital Scent Market?
The market segments include Hardware, End-user Industry.
4. Can you provide details about the market size?
The market size is estimated to be USD 1.28 Million as of 2022.
5. What are some drivers contributing to market growth?
Introduction of AI in Digital Scent Technology.
6. What are the notable trends driving market growth?
Introduction of AI in Digital Scent Technology.
7. Are there any restraints impacting market growth?
High Initial Cost of Electronic Noses.
8. Can you provide examples of recent developments in the market?
April 2022: The EU-funded project "Smart Electronic Olfaction for Body Odor Diagnostics" - SMELLODI for short - started with a meeting. The seven partners aim to create intelligent electronic sensor systems that can discriminate between normal body scents and those affected by sickness and convey them digitally. The partners are from Germany, Israel, Finland, and Germany. The technology created over three years with roughly EUR 3 million in funding is intended to pave the way for the digitization of smell.
9. What pricing options are available for accessing the report?
Pricing options include single-user, multi-user, and enterprise licenses priced at USD 4750, USD 5250, and USD 8750 respectively.
10. Is the market size provided in terms of value or volume?
The market size is provided in terms of value, measured in Million and volume, measured in K Unit.
11. Are there any specific market keywords associated with the report?
Yes, the market keyword associated with the report is "Digital Scent Market," which aids in identifying and referencing the specific market segment covered.
12. How do I determine which pricing option suits my needs best?
The pricing options vary based on user requirements and access needs. Individual users may opt for single-user licenses, while businesses requiring broader access may choose multi-user or enterprise licenses for cost-effective access to the report.
13. Are there any additional resources or data provided in the Digital Scent Market report?
While the report offers comprehensive insights, it's advisable to review the specific contents or supplementary materials provided to ascertain if additional resources or data are available.
14. How can I stay updated on further developments or reports in the Digital Scent Market?
To stay informed about further developments, trends, and reports in the Digital Scent Market, consider subscribing to industry newsletters, following relevant companies and organizations, or regularly checking reputable industry news sources and publications.
Methodology
Step 1 - Identification of Relevant Samples Size from Population Database


Step 2 - Approaches for Defining Global Market Size (Value, Volume* & Price*)

Note*: In applicable scenarios
Step 3 - Data Sources
Primary Research
- Web Analytics
- Survey Reports
- Research Institute
- Latest Research Reports
- Opinion Leaders
Secondary Research
- Annual Reports
- White Paper
- Latest Press Release
- Industry Association
- Paid Database
- Investor Presentations

Step 4 - Data Triangulation
Involves using different sources of information in order to increase the validity of a study
These sources are likely to be stakeholders in a program - participants, other researchers, program staff, other community members, and so on.
Then we put all data in single framework & apply various statistical tools to find out the dynamic on the market.
During the analysis stage, feedback from the stakeholder groups would be compared to determine areas of agreement as well as areas of divergence


