


Key Insights
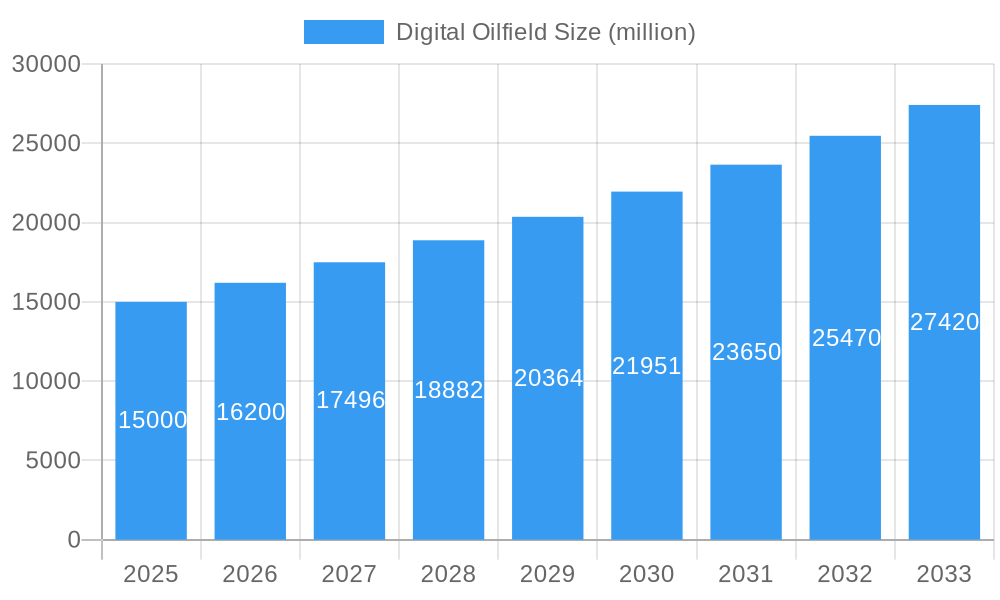
The digital oilfield market is experiencing robust growth, driven by the increasing need for enhanced operational efficiency, reduced costs, and improved safety within the oil and gas industry. The market's expansion is fueled by the adoption of advanced technologies such as IoT sensors, cloud computing, big data analytics, and artificial intelligence (AI) to optimize drilling, production, and reservoir management. This technological integration allows for real-time monitoring and control of operations, leading to improved decision-making and predictive maintenance, ultimately maximizing resource utilization and minimizing downtime. A conservative estimate suggests a current market size (2025) of approximately $15 billion, considering the presence of major players like Schlumberger, Halliburton, and Baker Hughes, and a reasonable CAGR of 8% over the forecast period (2025-2033) could result in a market valued at over $30 billion by 2033. This growth, however, faces some headwinds, including the high initial investment costs associated with implementing digital oilfield solutions and the need for skilled personnel to manage and interpret the vast amounts of data generated.
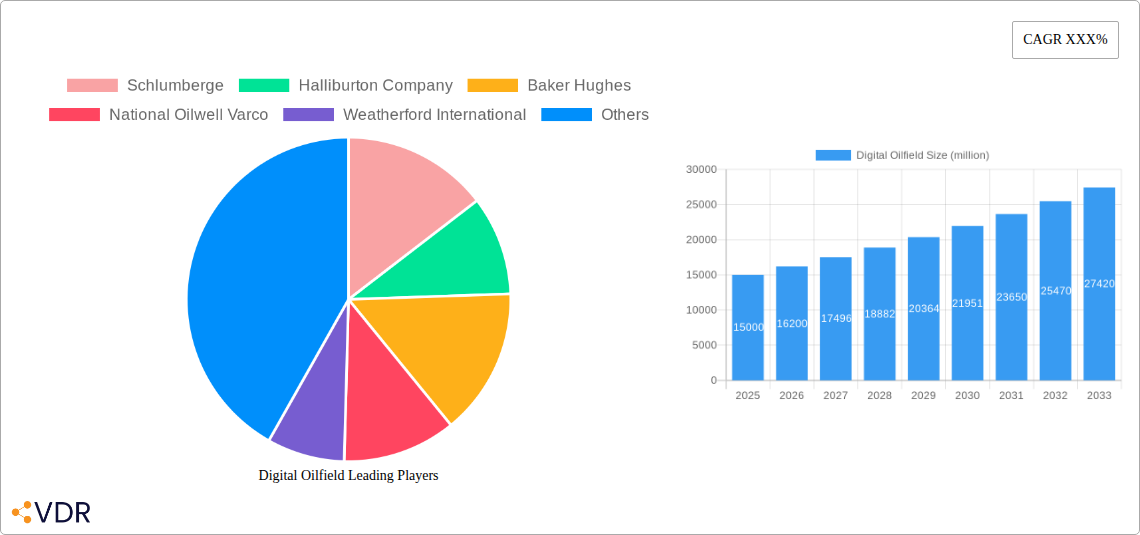
Digital Oilfield Market Size (In Billion)

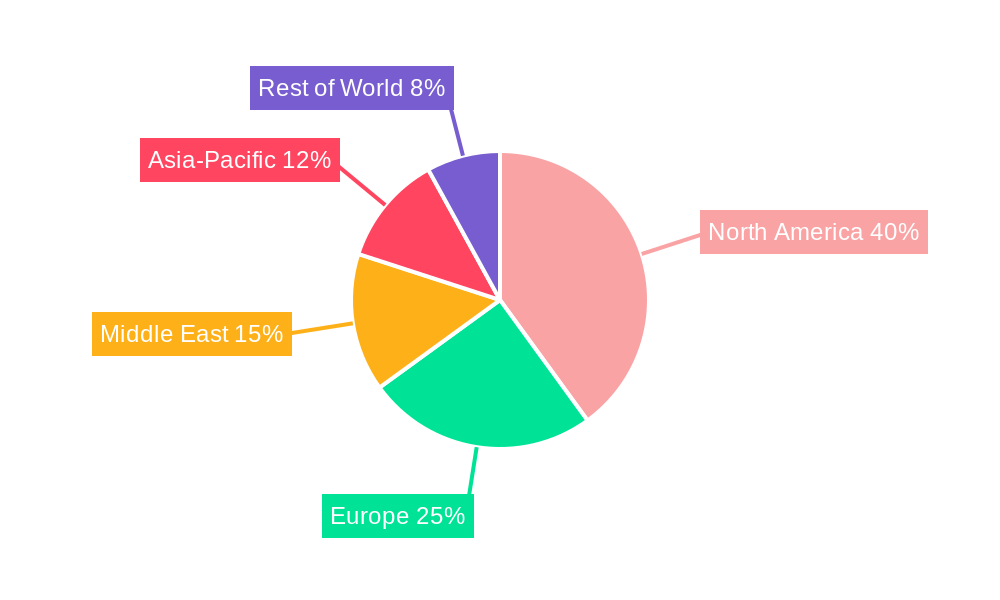
Despite these challenges, several trends are accelerating market growth. The increasing focus on sustainability and environmental regulations is driving the adoption of digital solutions that optimize energy consumption and reduce emissions. Furthermore, the growing adoption of automation and remote operations enhances safety by minimizing human intervention in hazardous environments. The segmentation of the market reflects this diversification, with various companies focusing on specific areas like drilling optimization, production enhancement, or reservoir management software. Regional growth varies, with North America and Europe currently dominating the market, but regions like the Middle East and Asia-Pacific are expected to witness significant growth in the coming years due to increased oil and gas exploration and production activities. The competitive landscape is characterized by intense competition among established players and emerging technology providers, fostering innovation and driving down costs.
Digital Oilfield Company Market Share
Digital Oilfield Market Report: 2019-2033 - Unlocking Efficiency and Innovation in Upstream Oil & Gas
This comprehensive report provides an in-depth analysis of the Digital Oilfield market, forecasting robust growth from $xx million in 2025 to $xx million by 2033, exhibiting a CAGR of xx%. Targeting upstream oil and gas operators and technology providers, this study offers critical insights into market dynamics, technological advancements, and strategic opportunities.
Digital Oilfield Market Dynamics & Structure
The Digital Oilfield market, valued at $xx million in 2025, is characterized by moderate concentration, with key players like Schlumberger, Halliburton Company, Baker Hughes, and National Oilwell Varco holding significant market share. Technological innovation, driven by the need for enhanced efficiency and reduced operational costs, is a primary growth driver. Stringent regulatory frameworks concerning environmental protection and safety standards significantly influence market operations. Competition from legacy systems and alternative solutions presents a challenge, although the shift towards data-driven decision-making is favoring digital solutions. The market is witnessing increased M&A activity, with xx deals recorded in the historical period (2019-2024), signaling consolidation and strategic expansion among players.
- Market Concentration: Moderate, with top 5 players holding approximately xx% market share in 2025.
- Innovation Drivers: Demand for improved efficiency, reduced operational expenditure, enhanced safety, and sustainable practices.
- Regulatory Landscape: Stringent environmental regulations and safety standards impacting technology adoption and deployment.
- Competitive Landscape: Intense competition from established players and emerging technology providers.
- M&A Activity: xx million in deal value during 2019-2024, indicating market consolidation.
- End-user Demographics: Primarily large and medium-sized oil and gas exploration and production companies.
Digital Oilfield Growth Trends & Insights
The Digital Oilfield market experienced significant growth during the historical period (2019-2024), fueled by the increasing adoption of digital technologies across the upstream value chain. The integration of IoT, AI, and cloud computing is revolutionizing operations, leading to improved asset performance, optimized production, and reduced downtime. This trend is further accelerated by a growing emphasis on data analytics for predictive maintenance and enhanced decision-making. Consumer behavior is shifting towards a preference for integrated solutions offering comprehensive data management and real-time insights. The market is expected to witness substantial growth in the forecast period (2025-2033), driven by technological advancements and increased investment in digital transformation initiatives.
Dominant Regions, Countries, or Segments in Digital Oilfield
North America currently dominates the Digital Oilfield market, driven by robust exploration and production activities and significant investments in digital technologies. Strong regulatory frameworks supporting innovation further contribute to the region’s leadership. The Middle East and Asia-Pacific regions are expected to witness substantial growth due to increasing oil and gas production and significant government initiatives supporting digitalization in the energy sector.
- Key Drivers in North America: Mature oil and gas industry, high levels of technological investment, supportive regulatory environment.
- Growth Potential in Middle East: Large oil and gas reserves, government initiatives promoting digital transformation, growing investment in infrastructure.
- Asia-Pacific Growth Factors: Rapid economic growth, increasing energy demand, investments in exploration and production.
Digital Oilfield Product Landscape
The Digital Oilfield market offers a diverse range of products, including advanced sensors, data analytics platforms, cloud-based solutions, and digital twin technologies. These technologies provide real-time insights into operational parameters, enabling predictive maintenance, optimized resource allocation, and improved safety. The unique selling proposition lies in their ability to enhance efficiency, reduce costs, and mitigate risks associated with traditional oil and gas operations. Recent advancements include the integration of AI and machine learning for enhanced predictive capabilities and improved decision-making.
Key Drivers, Barriers & Challenges in Digital Oilfield
Key Drivers:
- Increasing demand for enhanced operational efficiency and cost reduction.
- Advancements in sensor technologies, data analytics, and cloud computing.
- Growing focus on improving safety and environmental sustainability.
- Government initiatives promoting digitalization in the energy sector.
Challenges & Restraints:
- High upfront investment costs associated with digital transformation.
- Integration challenges between different systems and technologies.
- Cybersecurity concerns related to data security and privacy.
- Lack of skilled workforce to operate and maintain digital systems.
- Supply chain disruptions causing delays and increasing costs.
Emerging Opportunities in Digital Oilfield
- Expanding applications of AI and machine learning for predictive maintenance and optimized production.
- Integration of blockchain technology for improved supply chain transparency and security.
- Growth of the digital twin market for virtual simulation and testing.
- Development of new sensors and technologies for monitoring and managing subsurface assets.
- Unlocking the potential of data analytics to unlock insights from subsurface data.
Growth Accelerators in the Digital Oilfield Industry
Technological breakthroughs in AI, machine learning, and cloud computing are driving significant growth in the Digital Oilfield market. Strategic partnerships between technology providers and oil and gas operators are facilitating the rapid adoption of digital solutions. Expansion into untapped markets, such as unconventional oil and gas resources and offshore operations, offers substantial growth potential.
Key Players Shaping the Digital Oilfield Market
Notable Milestones in Digital Oilfield Sector
- 2020: Launch of Schlumberger’s DELFI cognitive E&P environment.
- 2021: Halliburton introduces its Landmark software suite with AI capabilities.
- 2022: Baker Hughes announces a strategic partnership for cloud-based digital solutions.
- 2023: Significant investments in digital twin technology by several major oil and gas companies.
In-Depth Digital Oilfield Market Outlook
The Digital Oilfield market is poised for continued growth, driven by the increasing adoption of advanced technologies and the growing need for improved operational efficiency and sustainability. Strategic partnerships, technological breakthroughs, and expansion into new markets will be crucial for success. The market offers significant opportunities for technology providers and oil and gas operators alike, promising enhanced productivity, reduced costs, and a more sustainable energy future.
Digital Oilfield Segmentation
-
1. Application
- 1.1. Onshore
- 1.2. Offshore
-
2. Type
- 2.1. Product Optimization
- 2.2. Reservoir Optimization
- 2.3. Drilling Optimization
- 2.4. Others
Digital Oilfield Segmentation By Geography
-
1. North America
- 1.1. United States
- 1.2. Canada
- 1.3. Mexico
-
2. South America
- 2.1. Brazil
- 2.2. Argentina
- 2.3. Rest of South America
-
3. Europe
- 3.1. United Kingdom
- 3.2. Germany
- 3.3. France
- 3.4. Italy
- 3.5. Spain
- 3.6. Russia
- 3.7. Benelux
- 3.8. Nordics
- 3.9. Rest of Europe
-
4. Middle East & Africa
- 4.1. Turkey
- 4.2. Israel
- 4.3. GCC
- 4.4. North Africa
- 4.5. South Africa
- 4.6. Rest of Middle East & Africa
-
5. Asia Pacific
- 5.1. China
- 5.2. India
- 5.3. Japan
- 5.4. South Korea
- 5.5. ASEAN
- 5.6. Oceania
- 5.7. Rest of Asia Pacific
Digital Oilfield Regional Market Share
Geographic Coverage of Digital Oilfield
Digital Oilfield REPORT HIGHLIGHTS
| Aspects | Details |
|---|---|
| Study Period | 2020-2034 |
| Base Year | 2025 |
| Estimated Year | 2026 |
| Forecast Period | 2026-2034 |
| Historical Period | 2020-2025 |
| Growth Rate | CAGR of 7.1% from 2020-2034 |
| Segmentation |
|
Table of Contents
- 1. Introduction
- 1.1. Research Scope
- 1.2. Market Segmentation
- 1.3. Research Methodology
- 1.4. Definitions and Assumptions
- 2. Executive Summary
- 2.1. Introduction
- 3. Market Dynamics
- 3.1. Introduction
- 3.2. Market Drivers
- 3.3. Market Restrains
- 3.4. Market Trends
- 4. Market Factor Analysis
- 4.1. Porters Five Forces
- 4.2. Supply/Value Chain
- 4.3. PESTEL analysis
- 4.4. Market Entropy
- 4.5. Patent/Trademark Analysis
- 5. Global Digital Oilfield Analysis, Insights and Forecast, 2020-2032
- 5.1. Market Analysis, Insights and Forecast - by Application
- 5.1.1. Onshore
- 5.1.2. Offshore
- 5.2. Market Analysis, Insights and Forecast - by Type
- 5.2.1. Product Optimization
- 5.2.2. Reservoir Optimization
- 5.2.3. Drilling Optimization
- 5.2.4. Others
- 5.3. Market Analysis, Insights and Forecast - by Region
- 5.3.1. North America
- 5.3.2. South America
- 5.3.3. Europe
- 5.3.4. Middle East & Africa
- 5.3.5. Asia Pacific
- 5.1. Market Analysis, Insights and Forecast - by Application
- 6. North America Digital Oilfield Analysis, Insights and Forecast, 2020-2032
- 6.1. Market Analysis, Insights and Forecast - by Application
- 6.1.1. Onshore
- 6.1.2. Offshore
- 6.2. Market Analysis, Insights and Forecast - by Type
- 6.2.1. Product Optimization
- 6.2.2. Reservoir Optimization
- 6.2.3. Drilling Optimization
- 6.2.4. Others
- 6.1. Market Analysis, Insights and Forecast - by Application
- 7. South America Digital Oilfield Analysis, Insights and Forecast, 2020-2032
- 7.1. Market Analysis, Insights and Forecast - by Application
- 7.1.1. Onshore
- 7.1.2. Offshore
- 7.2. Market Analysis, Insights and Forecast - by Type
- 7.2.1. Product Optimization
- 7.2.2. Reservoir Optimization
- 7.2.3. Drilling Optimization
- 7.2.4. Others
- 7.1. Market Analysis, Insights and Forecast - by Application
- 8. Europe Digital Oilfield Analysis, Insights and Forecast, 2020-2032
- 8.1. Market Analysis, Insights and Forecast - by Application
- 8.1.1. Onshore
- 8.1.2. Offshore
- 8.2. Market Analysis, Insights and Forecast - by Type
- 8.2.1. Product Optimization
- 8.2.2. Reservoir Optimization
- 8.2.3. Drilling Optimization
- 8.2.4. Others
- 8.1. Market Analysis, Insights and Forecast - by Application
- 9. Middle East & Africa Digital Oilfield Analysis, Insights and Forecast, 2020-2032
- 9.1. Market Analysis, Insights and Forecast - by Application
- 9.1.1. Onshore
- 9.1.2. Offshore
- 9.2. Market Analysis, Insights and Forecast - by Type
- 9.2.1. Product Optimization
- 9.2.2. Reservoir Optimization
- 9.2.3. Drilling Optimization
- 9.2.4. Others
- 9.1. Market Analysis, Insights and Forecast - by Application
- 10. Asia Pacific Digital Oilfield Analysis, Insights and Forecast, 2020-2032
- 10.1. Market Analysis, Insights and Forecast - by Application
- 10.1.1. Onshore
- 10.1.2. Offshore
- 10.2. Market Analysis, Insights and Forecast - by Type
- 10.2.1. Product Optimization
- 10.2.2. Reservoir Optimization
- 10.2.3. Drilling Optimization
- 10.2.4. Others
- 10.1. Market Analysis, Insights and Forecast - by Application
- 11. Competitive Analysis
- 11.1. Global Market Share Analysis 2025
- 11.2. Company Profiles
- 11.2.1 Schlumberge
- 11.2.1.1. Overview
- 11.2.1.2. Products
- 11.2.1.3. SWOT Analysis
- 11.2.1.4. Recent Developments
- 11.2.1.5. Financials (Based on Availability)
- 11.2.2 Halliburton Company
- 11.2.2.1. Overview
- 11.2.2.2. Products
- 11.2.2.3. SWOT Analysis
- 11.2.2.4. Recent Developments
- 11.2.2.5. Financials (Based on Availability)
- 11.2.3 Baker Hughes
- 11.2.3.1. Overview
- 11.2.3.2. Products
- 11.2.3.3. SWOT Analysis
- 11.2.3.4. Recent Developments
- 11.2.3.5. Financials (Based on Availability)
- 11.2.4 National Oilwell Varco
- 11.2.4.1. Overview
- 11.2.4.2. Products
- 11.2.4.3. SWOT Analysis
- 11.2.4.4. Recent Developments
- 11.2.4.5. Financials (Based on Availability)
- 11.2.5 Weatherford International
- 11.2.5.1. Overview
- 11.2.5.2. Products
- 11.2.5.3. SWOT Analysis
- 11.2.5.4. Recent Developments
- 11.2.5.5. Financials (Based on Availability)
- 11.2.6 Siemens
- 11.2.6.1. Overview
- 11.2.6.2. Products
- 11.2.6.3. SWOT Analysis
- 11.2.6.4. Recent Developments
- 11.2.6.5. Financials (Based on Availability)
- 11.2.7 Honeywell International
- 11.2.7.1. Overview
- 11.2.7.2. Products
- 11.2.7.3. SWOT Analysis
- 11.2.7.4. Recent Developments
- 11.2.7.5. Financials (Based on Availability)
- 11.2.8 Kongsberg Gruppen ASA
- 11.2.8.1. Overview
- 11.2.8.2. Products
- 11.2.8.3. SWOT Analysis
- 11.2.8.4. Recent Developments
- 11.2.8.5. Financials (Based on Availability)
- 11.2.1 Schlumberge
List of Figures
- Figure 1: Global Digital Oilfield Revenue Breakdown (undefined, %) by Region 2025 & 2033
- Figure 2: North America Digital Oilfield Revenue (undefined), by Application 2025 & 2033
- Figure 3: North America Digital Oilfield Revenue Share (%), by Application 2025 & 2033
- Figure 4: North America Digital Oilfield Revenue (undefined), by Type 2025 & 2033
- Figure 5: North America Digital Oilfield Revenue Share (%), by Type 2025 & 2033
- Figure 6: North America Digital Oilfield Revenue (undefined), by Country 2025 & 2033
- Figure 7: North America Digital Oilfield Revenue Share (%), by Country 2025 & 2033
- Figure 8: South America Digital Oilfield Revenue (undefined), by Application 2025 & 2033
- Figure 9: South America Digital Oilfield Revenue Share (%), by Application 2025 & 2033
- Figure 10: South America Digital Oilfield Revenue (undefined), by Type 2025 & 2033
- Figure 11: South America Digital Oilfield Revenue Share (%), by Type 2025 & 2033
- Figure 12: South America Digital Oilfield Revenue (undefined), by Country 2025 & 2033
- Figure 13: South America Digital Oilfield Revenue Share (%), by Country 2025 & 2033
- Figure 14: Europe Digital Oilfield Revenue (undefined), by Application 2025 & 2033
- Figure 15: Europe Digital Oilfield Revenue Share (%), by Application 2025 & 2033
- Figure 16: Europe Digital Oilfield Revenue (undefined), by Type 2025 & 2033
- Figure 17: Europe Digital Oilfield Revenue Share (%), by Type 2025 & 2033
- Figure 18: Europe Digital Oilfield Revenue (undefined), by Country 2025 & 2033
- Figure 19: Europe Digital Oilfield Revenue Share (%), by Country 2025 & 2033
- Figure 20: Middle East & Africa Digital Oilfield Revenue (undefined), by Application 2025 & 2033
- Figure 21: Middle East & Africa Digital Oilfield Revenue Share (%), by Application 2025 & 2033
- Figure 22: Middle East & Africa Digital Oilfield Revenue (undefined), by Type 2025 & 2033
- Figure 23: Middle East & Africa Digital Oilfield Revenue Share (%), by Type 2025 & 2033
- Figure 24: Middle East & Africa Digital Oilfield Revenue (undefined), by Country 2025 & 2033
- Figure 25: Middle East & Africa Digital Oilfield Revenue Share (%), by Country 2025 & 2033
- Figure 26: Asia Pacific Digital Oilfield Revenue (undefined), by Application 2025 & 2033
- Figure 27: Asia Pacific Digital Oilfield Revenue Share (%), by Application 2025 & 2033
- Figure 28: Asia Pacific Digital Oilfield Revenue (undefined), by Type 2025 & 2033
- Figure 29: Asia Pacific Digital Oilfield Revenue Share (%), by Type 2025 & 2033
- Figure 30: Asia Pacific Digital Oilfield Revenue (undefined), by Country 2025 & 2033
- Figure 31: Asia Pacific Digital Oilfield Revenue Share (%), by Country 2025 & 2033
List of Tables
- Table 1: Global Digital Oilfield Revenue undefined Forecast, by Application 2020 & 2033
- Table 2: Global Digital Oilfield Revenue undefined Forecast, by Type 2020 & 2033
- Table 3: Global Digital Oilfield Revenue undefined Forecast, by Region 2020 & 2033
- Table 4: Global Digital Oilfield Revenue undefined Forecast, by Application 2020 & 2033
- Table 5: Global Digital Oilfield Revenue undefined Forecast, by Type 2020 & 2033
- Table 6: Global Digital Oilfield Revenue undefined Forecast, by Country 2020 & 2033
- Table 7: United States Digital Oilfield Revenue (undefined) Forecast, by Application 2020 & 2033
- Table 8: Canada Digital Oilfield Revenue (undefined) Forecast, by Application 2020 & 2033
- Table 9: Mexico Digital Oilfield Revenue (undefined) Forecast, by Application 2020 & 2033
- Table 10: Global Digital Oilfield Revenue undefined Forecast, by Application 2020 & 2033
- Table 11: Global Digital Oilfield Revenue undefined Forecast, by Type 2020 & 2033
- Table 12: Global Digital Oilfield Revenue undefined Forecast, by Country 2020 & 2033
- Table 13: Brazil Digital Oilfield Revenue (undefined) Forecast, by Application 2020 & 2033
- Table 14: Argentina Digital Oilfield Revenue (undefined) Forecast, by Application 2020 & 2033
- Table 15: Rest of South America Digital Oilfield Revenue (undefined) Forecast, by Application 2020 & 2033
- Table 16: Global Digital Oilfield Revenue undefined Forecast, by Application 2020 & 2033
- Table 17: Global Digital Oilfield Revenue undefined Forecast, by Type 2020 & 2033
- Table 18: Global Digital Oilfield Revenue undefined Forecast, by Country 2020 & 2033
- Table 19: United Kingdom Digital Oilfield Revenue (undefined) Forecast, by Application 2020 & 2033
- Table 20: Germany Digital Oilfield Revenue (undefined) Forecast, by Application 2020 & 2033
- Table 21: France Digital Oilfield Revenue (undefined) Forecast, by Application 2020 & 2033
- Table 22: Italy Digital Oilfield Revenue (undefined) Forecast, by Application 2020 & 2033
- Table 23: Spain Digital Oilfield Revenue (undefined) Forecast, by Application 2020 & 2033
- Table 24: Russia Digital Oilfield Revenue (undefined) Forecast, by Application 2020 & 2033
- Table 25: Benelux Digital Oilfield Revenue (undefined) Forecast, by Application 2020 & 2033
- Table 26: Nordics Digital Oilfield Revenue (undefined) Forecast, by Application 2020 & 2033
- Table 27: Rest of Europe Digital Oilfield Revenue (undefined) Forecast, by Application 2020 & 2033
- Table 28: Global Digital Oilfield Revenue undefined Forecast, by Application 2020 & 2033
- Table 29: Global Digital Oilfield Revenue undefined Forecast, by Type 2020 & 2033
- Table 30: Global Digital Oilfield Revenue undefined Forecast, by Country 2020 & 2033
- Table 31: Turkey Digital Oilfield Revenue (undefined) Forecast, by Application 2020 & 2033
- Table 32: Israel Digital Oilfield Revenue (undefined) Forecast, by Application 2020 & 2033
- Table 33: GCC Digital Oilfield Revenue (undefined) Forecast, by Application 2020 & 2033
- Table 34: North Africa Digital Oilfield Revenue (undefined) Forecast, by Application 2020 & 2033
- Table 35: South Africa Digital Oilfield Revenue (undefined) Forecast, by Application 2020 & 2033
- Table 36: Rest of Middle East & Africa Digital Oilfield Revenue (undefined) Forecast, by Application 2020 & 2033
- Table 37: Global Digital Oilfield Revenue undefined Forecast, by Application 2020 & 2033
- Table 38: Global Digital Oilfield Revenue undefined Forecast, by Type 2020 & 2033
- Table 39: Global Digital Oilfield Revenue undefined Forecast, by Country 2020 & 2033
- Table 40: China Digital Oilfield Revenue (undefined) Forecast, by Application 2020 & 2033
- Table 41: India Digital Oilfield Revenue (undefined) Forecast, by Application 2020 & 2033
- Table 42: Japan Digital Oilfield Revenue (undefined) Forecast, by Application 2020 & 2033
- Table 43: South Korea Digital Oilfield Revenue (undefined) Forecast, by Application 2020 & 2033
- Table 44: ASEAN Digital Oilfield Revenue (undefined) Forecast, by Application 2020 & 2033
- Table 45: Oceania Digital Oilfield Revenue (undefined) Forecast, by Application 2020 & 2033
- Table 46: Rest of Asia Pacific Digital Oilfield Revenue (undefined) Forecast, by Application 2020 & 2033
Frequently Asked Questions
1. What is the projected Compound Annual Growth Rate (CAGR) of the Digital Oilfield?
The projected CAGR is approximately 7.1%.
2. Which companies are prominent players in the Digital Oilfield?
Key companies in the market include Schlumberge, Halliburton Company, Baker Hughes, National Oilwell Varco, Weatherford International, Siemens, Honeywell International, Kongsberg Gruppen ASA.
3. What are the main segments of the Digital Oilfield?
The market segments include Application, Type.
4. Can you provide details about the market size?
The market size is estimated to be USD XXX N/A as of 2022.
5. What are some drivers contributing to market growth?
N/A
6. What are the notable trends driving market growth?
N/A
7. Are there any restraints impacting market growth?
N/A
8. Can you provide examples of recent developments in the market?
N/A
9. What pricing options are available for accessing the report?
Pricing options include single-user, multi-user, and enterprise licenses priced at USD 2900.00, USD 4350.00, and USD 5800.00 respectively.
10. Is the market size provided in terms of value or volume?
The market size is provided in terms of value, measured in N/A.
11. Are there any specific market keywords associated with the report?
Yes, the market keyword associated with the report is "Digital Oilfield," which aids in identifying and referencing the specific market segment covered.
12. How do I determine which pricing option suits my needs best?
The pricing options vary based on user requirements and access needs. Individual users may opt for single-user licenses, while businesses requiring broader access may choose multi-user or enterprise licenses for cost-effective access to the report.
13. Are there any additional resources or data provided in the Digital Oilfield report?
While the report offers comprehensive insights, it's advisable to review the specific contents or supplementary materials provided to ascertain if additional resources or data are available.
14. How can I stay updated on further developments or reports in the Digital Oilfield?
To stay informed about further developments, trends, and reports in the Digital Oilfield, consider subscribing to industry newsletters, following relevant companies and organizations, or regularly checking reputable industry news sources and publications.
Methodology
Step 1 - Identification of Relevant Samples Size from Population Database


Step 2 - Approaches for Defining Global Market Size (Value, Volume* & Price*)

Note*: In applicable scenarios
Step 3 - Data Sources
Primary Research
- Web Analytics
- Survey Reports
- Research Institute
- Latest Research Reports
- Opinion Leaders
Secondary Research
- Annual Reports
- White Paper
- Latest Press Release
- Industry Association
- Paid Database
- Investor Presentations

Step 4 - Data Triangulation
Involves using different sources of information in order to increase the validity of a study
These sources are likely to be stakeholders in a program - participants, other researchers, program staff, other community members, and so on.
Then we put all data in single framework & apply various statistical tools to find out the dynamic on the market.
During the analysis stage, feedback from the stakeholder groups would be compared to determine areas of agreement as well as areas of divergence