
Key Insights
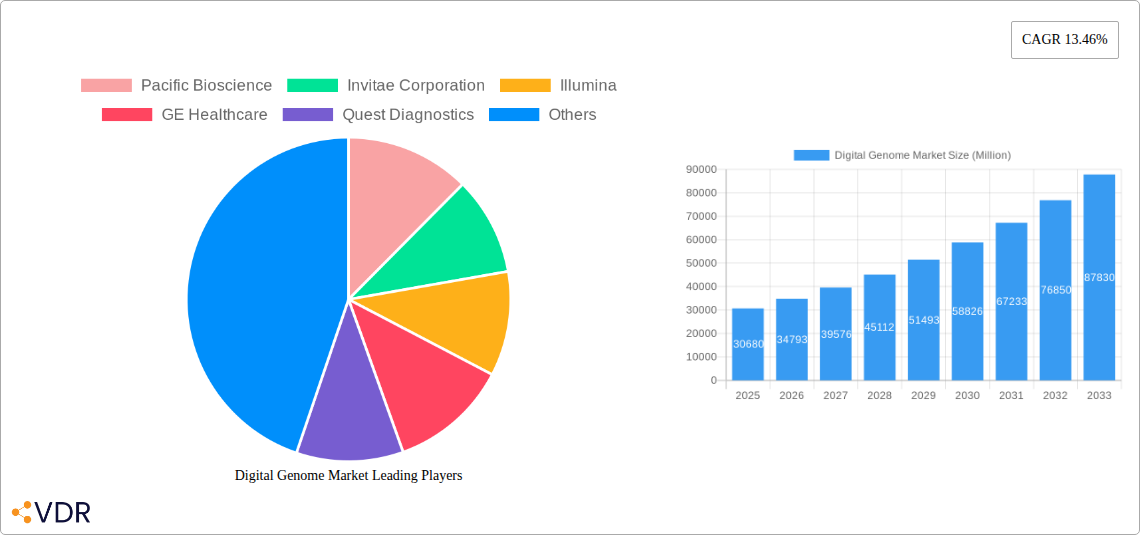
The global digital genome market, valued at $30.68 billion in 2025, is projected to experience robust growth, driven by several key factors. Advancements in sequencing technologies, particularly next-generation sequencing (NGS), are significantly reducing costs and increasing throughput, making genome sequencing more accessible for research and clinical applications. The rising prevalence of chronic diseases like cancer and inherited disorders is fueling demand for personalized medicine approaches that rely heavily on genomic data. Furthermore, increasing government initiatives supporting genomic research and the development of precision medicine strategies are bolstering market expansion. The clinical application segment currently dominates the market, driven by the increasing adoption of genomic tests for diagnosis, prognosis, and treatment selection. However, the forensics, drug discovery, and other research applications are also demonstrating significant growth potential, as the ability to analyze large genomic datasets enables faster and more efficient research processes. Major players like Illumina, Thermo Fisher Scientific, and Qiagen are actively investing in research and development, driving innovation and expanding the market's capabilities. The competitive landscape is characterized by both large established companies and emerging players offering innovative sequencing technologies and analytical tools. The North American market currently holds a significant share, driven by robust healthcare infrastructure and advanced research capabilities; however, the Asia-Pacific region is expected to witness substantial growth due to rising healthcare spending and increasing adoption of genomic technologies.
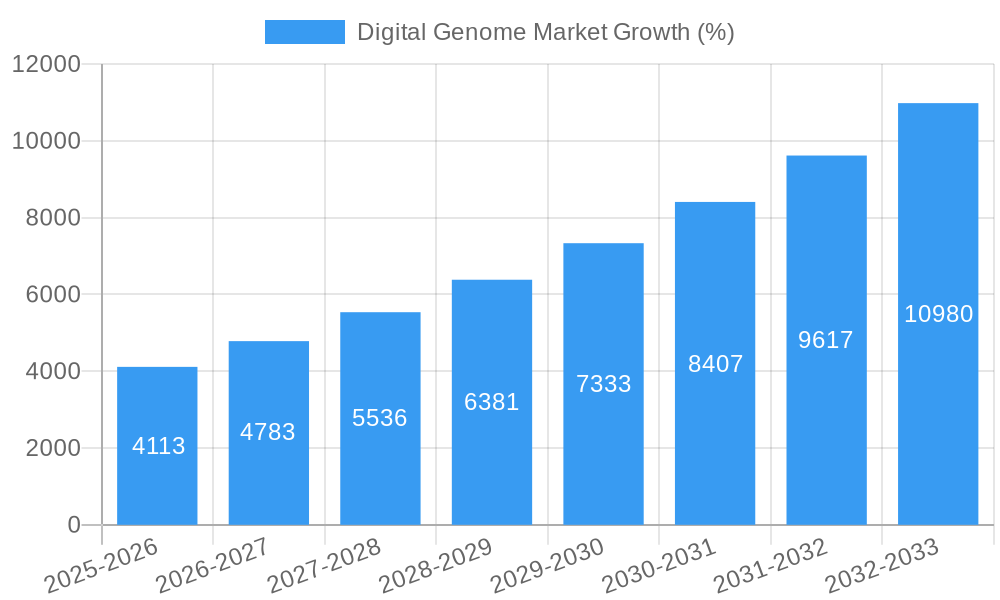
The market's growth trajectory over the forecast period (2025-2033) is anticipated to be influenced by several factors. Continued technological advancements, particularly in areas such as single-cell sequencing and long-read sequencing, will expand the applications and capabilities of digital genome analysis. The increasing integration of artificial intelligence (AI) and machine learning (ML) in genomic data analysis is expected to further enhance the speed and accuracy of diagnoses and treatment strategies. Regulatory approvals for new genomic tests and expanding reimbursement policies will play a crucial role in driving market penetration. However, challenges such as data privacy concerns, high costs associated with advanced sequencing technologies, and the need for skilled professionals to interpret genomic data could pose potential restraints to the market's growth. Despite these challenges, the long-term outlook for the digital genome market remains positive, with significant opportunities for growth and innovation.
Digital Genome Market: A Comprehensive Report (2019-2033)
This comprehensive report provides a detailed analysis of the Digital Genome Market, encompassing market dynamics, growth trends, regional dominance, product landscape, key players, and future outlook. With a study period spanning 2019-2033, a base year of 2025, and a forecast period of 2025-2033, this report offers invaluable insights for industry professionals, investors, and strategists. The market is segmented by Product (Sequencing and Analyzer Instruments, DNA/RNA Analysis Kits, Sequencing Chips, Sequencing and Analysis Software, Sample Preparation Instruments), Application (Clinical, Forensics, Drug Discovery and Development, Other Applications), and End User (Hospitals, Diagnostic Centers and Forensic Labs, Research Institutes, Other End Users). The total market size is projected to reach xx Million by 2033.
Digital Genome Market Dynamics & Structure
The Digital Genome Market is characterized by a moderately concentrated structure with key players holding significant market share. Technological innovation, particularly in next-generation sequencing (NGS) and bioinformatics, is a primary growth driver. Stringent regulatory frameworks governing data privacy and clinical diagnostics influence market dynamics, while advancements in other technologies pose potential competitive substitution. End-user demographics, particularly the increasing prevalence of chronic diseases and growing demand for personalized medicine, fuel market expansion. Furthermore, the market witnesses continuous mergers and acquisitions (M&A) activity, fostering consolidation and accelerating innovation.
- Market Concentration: Illumina and Thermo Fisher Scientific currently hold a combined market share of approximately xx%, indicating a moderately consolidated market.
- Technological Innovation: Advancements in NGS, CRISPR-Cas9 gene editing, and AI-driven data analysis are key innovation drivers.
- Regulatory Landscape: Compliance with HIPAA, GDPR, and other data privacy regulations significantly impacts market operations.
- M&A Activity: The past five years have seen an average of xx M&A deals annually, with a total deal value exceeding xx Million.
- Innovation Barriers: High R&D costs, stringent regulatory approvals, and the complexity of data analysis pose significant challenges.
Digital Genome Market Growth Trends & Insights
The Digital Genome Market has experienced substantial growth over the historical period (2019-2024), with a CAGR of xx%. This growth is attributed to several factors, including increasing adoption of genomic testing in clinical settings, rising investments in research and development, and the growing prevalence of chronic diseases necessitating personalized medicine approaches. Technological advancements, particularly in high-throughput sequencing and bioinformatics, are disrupting traditional methods, leading to improved accuracy, speed, and cost-effectiveness. Consumer behavior shifts, driven by increased health awareness and direct-to-consumer genetic testing options, further propel market expansion. Market penetration in developed regions is relatively high, while emerging economies present significant growth opportunities.
- Market Size Evolution: The market size grew from xx Million in 2019 to xx Million in 2024.
- Adoption Rates: Adoption of NGS technology is increasing at a CAGR of xx% in clinical settings.
- Technological Disruptions: The emergence of affordable and accurate NGS platforms is driving significant market disruption.
- Consumer Behavior Shifts: Direct-to-consumer genetic testing is gaining traction, influencing market demand.
Dominant Regions, Countries, or Segments in Digital Genome Market
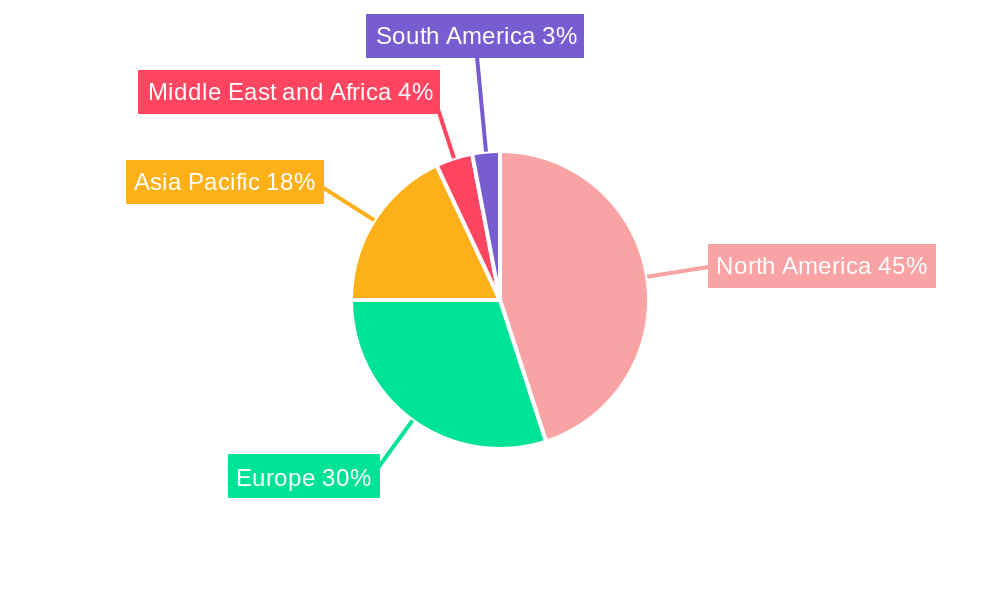
North America currently holds the largest market share in the Digital Genome Market, driven by robust healthcare infrastructure, high adoption rates of advanced technologies, and substantial investments in genomics research. Europe follows closely, with significant growth potential in Asia-Pacific due to expanding healthcare infrastructure and increasing awareness of genomic applications. Within segments, the Clinical application segment dominates, driven by the widespread adoption of genomic testing for diagnostics and personalized medicine. The Sequencing and Analyzer Instruments segment holds the largest share within the product category, owing to its crucial role in genomic research and clinical diagnostics.
- Key Drivers: Strong healthcare infrastructure, high R&D investments, favorable regulatory environments, and increasing disease prevalence.
- North America Dominance: High adoption rates of advanced sequencing technologies and established regulatory frameworks drive market leadership.
- Europe Growth: Growing investments in personalized medicine and precision oncology fuel market expansion.
- Asia-Pacific Potential: Rapidly developing healthcare infrastructure and rising disposable incomes offer significant growth opportunities.
- Clinical Applications Leadership: The clinical segment's dominance stems from its wide adoption in diagnostics and personalized treatment.
Digital Genome Market Product Landscape
The Digital Genome Market features a wide array of products, including sequencing and analyzer instruments, DNA/RNA analysis kits, sequencing chips, sequencing and analysis software, and sample preparation instruments. These products vary in terms of throughput, accuracy, cost-effectiveness, and ease of use. Recent innovations include advancements in portable sequencers, cloud-based data analysis platforms, and improved sample preparation techniques. Unique selling propositions (USPs) center around speed, accuracy, cost-effectiveness, and ease of integration with existing workflows. Continuous technological improvements focus on reducing sequencing time, improving data quality, and decreasing overall costs.
Key Drivers, Barriers & Challenges in Digital Genome Market
Key Drivers:
- Increasing prevalence of chronic diseases fueling demand for personalized medicine.
- Technological advancements leading to faster, cheaper, and more accurate sequencing.
- Rising investments in genomics research from both public and private sectors.
- Growing adoption of genomic testing in clinical settings.
Key Challenges & Restraints:
- High cost of sequencing and data analysis, limiting accessibility in some regions.
- Data privacy concerns and stringent regulatory compliance requirements.
- Interpretation of complex genomic data and the need for skilled professionals.
- Intense competition among established players and emerging companies. This results in a xx% reduction in average profit margins.
Emerging Opportunities in Digital Genome Market
- Expansion into untapped markets in developing economies with rising healthcare spending.
- Development of innovative applications, such as liquid biopsies for early cancer detection.
- Growing demand for direct-to-consumer genetic testing services.
- Integration of genomics with artificial intelligence (AI) for improved data analysis and disease prediction.
Growth Accelerators in the Digital Genome Market Industry
Technological breakthroughs, particularly in nanopore sequencing and single-cell genomics, promise to further accelerate market growth. Strategic partnerships between technology providers, healthcare providers, and pharmaceutical companies are fostering innovation and market expansion. The development of more affordable and accessible sequencing technologies is expected to broaden market reach, particularly in developing countries. Government initiatives supporting genomics research and clinical applications further contribute to long-term market expansion.
Key Players Shaping the Digital Genome Market Market
- Pacific Biosciences
- Invitae Corporation
- Illumina
- GE Healthcare
- Quest Diagnostics
- Qiagen
- Thermo Fisher Scientific
- Inscripta Inc
- PerkinElmer Inc
- Agilent Technologies
- NanoString Technologies Inc
- GenMark Diagnostics Inc
- bioMérieux
Notable Milestones in Digital Genome Market Sector
- May 2022: Gencove and NEOGEN Corporation launch InfiniSEEK, a cost-effective whole genome sequencing solution.
- March 2022: LetsGetChecked acquires Veritas Genetics, enhancing its genomic testing capabilities.
In-Depth Digital Genome Market Market Outlook
The Digital Genome Market is poised for continued robust growth driven by technological advancements, increasing healthcare spending, and a growing understanding of the clinical utility of genomics. Strategic partnerships and collaborations among key players are expected to further accelerate innovation and expand market reach. The focus on developing affordable and accessible sequencing technologies will broaden market penetration, particularly in underserved regions. The long-term outlook remains positive, with significant growth potential across various segments and geographic regions.
Digital Genome Market Segmentation
-
1. Product
- 1.1. Sequencing and Analyzer Instruments
- 1.2. DNA/RNA Analysis Kits
- 1.3. Sequencing Chips
- 1.4. Sequencing and Analysis Software
- 1.5. Sample Preparation Instruments
-
2. Application
-
2.1. Clinical
- 2.1.1. Reproductive Health
- 2.1.2. Oncology
- 2.1.3. Others
- 2.2. Forensics
- 2.3. Drug Discovery and Development
- 2.4. Other Applications
-
2.1. Clinical
-
3. End User
- 3.1. Hospitals
- 3.2. Diagnostic Centers and Forensic Labs
- 3.3. Research Institutes
- 3.4. Other End Users
Digital Genome Market Segmentation By Geography
-
1. North America
- 1.1. United States
- 1.2. Canada
- 1.3. Mexico
-
2. Europe
- 2.1. Germany
- 2.2. United Kingdom
- 2.3. France
- 2.4. Italy
- 2.5. Spain
- 2.6. Rest of Europe
-
3. Asia Pacific
- 3.1. China
- 3.2. Japan
- 3.3. India
- 3.4. Australia
- 3.5. South Korea
- 3.6. Rest of Asia Pacific
-
4. Middle East and Africa
- 4.1. GCC
- 4.2. South Africa
- 4.3. Rest of Middle East and Africa
-
5. South America
- 5.1. Brazil
- 5.2. Argentina
- 5.3. Rest of South America
Digital Genome Market REPORT HIGHLIGHTS
| Aspects | Details |
|---|---|
| Study Period | 2019-2033 |
| Base Year | 2024 |
| Estimated Year | 2025 |
| Forecast Period | 2025-2033 |
| Historical Period | 2019-2024 |
| Growth Rate | CAGR of 13.46% from 2019-2033 |
| Segmentation |
|
Table of Contents
- 1. Introduction
- 1.1. Research Scope
- 1.2. Market Segmentation
- 1.3. Research Methodology
- 1.4. Definitions and Assumptions
- 2. Executive Summary
- 2.1. Introduction
- 3. Market Dynamics
- 3.1. Introduction
- 3.2. Market Drivers
- 3.2.1 Increasing Technological Advancements
- 3.2.2 and Research and Development Pertaining to Digital Genome; Growing Adoption of Personalized Medicine; Constantly Evolving Disease Patterns
- 3.3. Market Restrains
- 3.3.1. High Capital Expenditure; Lack of Skilled Workforce
- 3.4. Market Trends
- 3.4.1. Sequencing and Analysis Software Segment is Expected to Hold a Major Market Share in the Digital Genome Market Over the Forecast Period
- 4. Market Factor Analysis
- 4.1. Porters Five Forces
- 4.2. Supply/Value Chain
- 4.3. PESTEL analysis
- 4.4. Market Entropy
- 4.5. Patent/Trademark Analysis
- 5. Global Digital Genome Market Analysis, Insights and Forecast, 2019-2031
- 5.1. Market Analysis, Insights and Forecast - by Product
- 5.1.1. Sequencing and Analyzer Instruments
- 5.1.2. DNA/RNA Analysis Kits
- 5.1.3. Sequencing Chips
- 5.1.4. Sequencing and Analysis Software
- 5.1.5. Sample Preparation Instruments
- 5.2. Market Analysis, Insights and Forecast - by Application
- 5.2.1. Clinical
- 5.2.1.1. Reproductive Health
- 5.2.1.2. Oncology
- 5.2.1.3. Others
- 5.2.2. Forensics
- 5.2.3. Drug Discovery and Development
- 5.2.4. Other Applications
- 5.2.1. Clinical
- 5.3. Market Analysis, Insights and Forecast - by End User
- 5.3.1. Hospitals
- 5.3.2. Diagnostic Centers and Forensic Labs
- 5.3.3. Research Institutes
- 5.3.4. Other End Users
- 5.4. Market Analysis, Insights and Forecast - by Region
- 5.4.1. North America
- 5.4.2. Europe
- 5.4.3. Asia Pacific
- 5.4.4. Middle East and Africa
- 5.4.5. South America
- 5.1. Market Analysis, Insights and Forecast - by Product
- 6. North America Digital Genome Market Analysis, Insights and Forecast, 2019-2031
- 6.1. Market Analysis, Insights and Forecast - by Product
- 6.1.1. Sequencing and Analyzer Instruments
- 6.1.2. DNA/RNA Analysis Kits
- 6.1.3. Sequencing Chips
- 6.1.4. Sequencing and Analysis Software
- 6.1.5. Sample Preparation Instruments
- 6.2. Market Analysis, Insights and Forecast - by Application
- 6.2.1. Clinical
- 6.2.1.1. Reproductive Health
- 6.2.1.2. Oncology
- 6.2.1.3. Others
- 6.2.2. Forensics
- 6.2.3. Drug Discovery and Development
- 6.2.4. Other Applications
- 6.2.1. Clinical
- 6.3. Market Analysis, Insights and Forecast - by End User
- 6.3.1. Hospitals
- 6.3.2. Diagnostic Centers and Forensic Labs
- 6.3.3. Research Institutes
- 6.3.4. Other End Users
- 6.1. Market Analysis, Insights and Forecast - by Product
- 7. Europe Digital Genome Market Analysis, Insights and Forecast, 2019-2031
- 7.1. Market Analysis, Insights and Forecast - by Product
- 7.1.1. Sequencing and Analyzer Instruments
- 7.1.2. DNA/RNA Analysis Kits
- 7.1.3. Sequencing Chips
- 7.1.4. Sequencing and Analysis Software
- 7.1.5. Sample Preparation Instruments
- 7.2. Market Analysis, Insights and Forecast - by Application
- 7.2.1. Clinical
- 7.2.1.1. Reproductive Health
- 7.2.1.2. Oncology
- 7.2.1.3. Others
- 7.2.2. Forensics
- 7.2.3. Drug Discovery and Development
- 7.2.4. Other Applications
- 7.2.1. Clinical
- 7.3. Market Analysis, Insights and Forecast - by End User
- 7.3.1. Hospitals
- 7.3.2. Diagnostic Centers and Forensic Labs
- 7.3.3. Research Institutes
- 7.3.4. Other End Users
- 7.1. Market Analysis, Insights and Forecast - by Product
- 8. Asia Pacific Digital Genome Market Analysis, Insights and Forecast, 2019-2031
- 8.1. Market Analysis, Insights and Forecast - by Product
- 8.1.1. Sequencing and Analyzer Instruments
- 8.1.2. DNA/RNA Analysis Kits
- 8.1.3. Sequencing Chips
- 8.1.4. Sequencing and Analysis Software
- 8.1.5. Sample Preparation Instruments
- 8.2. Market Analysis, Insights and Forecast - by Application
- 8.2.1. Clinical
- 8.2.1.1. Reproductive Health
- 8.2.1.2. Oncology
- 8.2.1.3. Others
- 8.2.2. Forensics
- 8.2.3. Drug Discovery and Development
- 8.2.4. Other Applications
- 8.2.1. Clinical
- 8.3. Market Analysis, Insights and Forecast - by End User
- 8.3.1. Hospitals
- 8.3.2. Diagnostic Centers and Forensic Labs
- 8.3.3. Research Institutes
- 8.3.4. Other End Users
- 8.1. Market Analysis, Insights and Forecast - by Product
- 9. Middle East and Africa Digital Genome Market Analysis, Insights and Forecast, 2019-2031
- 9.1. Market Analysis, Insights and Forecast - by Product
- 9.1.1. Sequencing and Analyzer Instruments
- 9.1.2. DNA/RNA Analysis Kits
- 9.1.3. Sequencing Chips
- 9.1.4. Sequencing and Analysis Software
- 9.1.5. Sample Preparation Instruments
- 9.2. Market Analysis, Insights and Forecast - by Application
- 9.2.1. Clinical
- 9.2.1.1. Reproductive Health
- 9.2.1.2. Oncology
- 9.2.1.3. Others
- 9.2.2. Forensics
- 9.2.3. Drug Discovery and Development
- 9.2.4. Other Applications
- 9.2.1. Clinical
- 9.3. Market Analysis, Insights and Forecast - by End User
- 9.3.1. Hospitals
- 9.3.2. Diagnostic Centers and Forensic Labs
- 9.3.3. Research Institutes
- 9.3.4. Other End Users
- 9.1. Market Analysis, Insights and Forecast - by Product
- 10. South America Digital Genome Market Analysis, Insights and Forecast, 2019-2031
- 10.1. Market Analysis, Insights and Forecast - by Product
- 10.1.1. Sequencing and Analyzer Instruments
- 10.1.2. DNA/RNA Analysis Kits
- 10.1.3. Sequencing Chips
- 10.1.4. Sequencing and Analysis Software
- 10.1.5. Sample Preparation Instruments
- 10.2. Market Analysis, Insights and Forecast - by Application
- 10.2.1. Clinical
- 10.2.1.1. Reproductive Health
- 10.2.1.2. Oncology
- 10.2.1.3. Others
- 10.2.2. Forensics
- 10.2.3. Drug Discovery and Development
- 10.2.4. Other Applications
- 10.2.1. Clinical
- 10.3. Market Analysis, Insights and Forecast - by End User
- 10.3.1. Hospitals
- 10.3.2. Diagnostic Centers and Forensic Labs
- 10.3.3. Research Institutes
- 10.3.4. Other End Users
- 10.1. Market Analysis, Insights and Forecast - by Product
- 11. North America Digital Genome Market Analysis, Insights and Forecast, 2019-2031
- 11.1. Market Analysis, Insights and Forecast - By Country/Sub-region
- 11.1.1 United States
- 11.1.2 Canada
- 11.1.3 Mexico
- 12. Europe Digital Genome Market Analysis, Insights and Forecast, 2019-2031
- 12.1. Market Analysis, Insights and Forecast - By Country/Sub-region
- 12.1.1 Germany
- 12.1.2 United Kingdom
- 12.1.3 France
- 12.1.4 Italy
- 12.1.5 Spain
- 12.1.6 Rest of Europe
- 13. Asia Pacific Digital Genome Market Analysis, Insights and Forecast, 2019-2031
- 13.1. Market Analysis, Insights and Forecast - By Country/Sub-region
- 13.1.1 China
- 13.1.2 Japan
- 13.1.3 India
- 13.1.4 Australia
- 13.1.5 South Korea
- 13.1.6 Rest of Asia Pacific
- 14. Middle East and Africa Digital Genome Market Analysis, Insights and Forecast, 2019-2031
- 14.1. Market Analysis, Insights and Forecast - By Country/Sub-region
- 14.1.1 GCC
- 14.1.2 South Africa
- 14.1.3 Rest of Middle East and Africa
- 15. South America Digital Genome Market Analysis, Insights and Forecast, 2019-2031
- 15.1. Market Analysis, Insights and Forecast - By Country/Sub-region
- 15.1.1 Brazil
- 15.1.2 Argentina
- 15.1.3 Rest of South America
- 16. Competitive Analysis
- 16.1. Global Market Share Analysis 2024
- 16.2. Company Profiles
- 16.2.1 Pacific Bioscience
- 16.2.1.1. Overview
- 16.2.1.2. Products
- 16.2.1.3. SWOT Analysis
- 16.2.1.4. Recent Developments
- 16.2.1.5. Financials (Based on Availability)
- 16.2.2 Invitae Corporation
- 16.2.2.1. Overview
- 16.2.2.2. Products
- 16.2.2.3. SWOT Analysis
- 16.2.2.4. Recent Developments
- 16.2.2.5. Financials (Based on Availability)
- 16.2.3 Illumina
- 16.2.3.1. Overview
- 16.2.3.2. Products
- 16.2.3.3. SWOT Analysis
- 16.2.3.4. Recent Developments
- 16.2.3.5. Financials (Based on Availability)
- 16.2.4 GE Healthcare
- 16.2.4.1. Overview
- 16.2.4.2. Products
- 16.2.4.3. SWOT Analysis
- 16.2.4.4. Recent Developments
- 16.2.4.5. Financials (Based on Availability)
- 16.2.5 Quest Diagnostics
- 16.2.5.1. Overview
- 16.2.5.2. Products
- 16.2.5.3. SWOT Analysis
- 16.2.5.4. Recent Developments
- 16.2.5.5. Financials (Based on Availability)
- 16.2.6 Qiagen
- 16.2.6.1. Overview
- 16.2.6.2. Products
- 16.2.6.3. SWOT Analysis
- 16.2.6.4. Recent Developments
- 16.2.6.5. Financials (Based on Availability)
- 16.2.7 Thermo Fisher Scientific
- 16.2.7.1. Overview
- 16.2.7.2. Products
- 16.2.7.3. SWOT Analysis
- 16.2.7.4. Recent Developments
- 16.2.7.5. Financials (Based on Availability)
- 16.2.8 Inscripta Inc
- 16.2.8.1. Overview
- 16.2.8.2. Products
- 16.2.8.3. SWOT Analysis
- 16.2.8.4. Recent Developments
- 16.2.8.5. Financials (Based on Availability)
- 16.2.9 PerkinElmer Inc
- 16.2.9.1. Overview
- 16.2.9.2. Products
- 16.2.9.3. SWOT Analysis
- 16.2.9.4. Recent Developments
- 16.2.9.5. Financials (Based on Availability)
- 16.2.10 Agilent Technologies
- 16.2.10.1. Overview
- 16.2.10.2. Products
- 16.2.10.3. SWOT Analysis
- 16.2.10.4. Recent Developments
- 16.2.10.5. Financials (Based on Availability)
- 16.2.11 NanoString Technologies Inc
- 16.2.11.1. Overview
- 16.2.11.2. Products
- 16.2.11.3. SWOT Analysis
- 16.2.11.4. Recent Developments
- 16.2.11.5. Financials (Based on Availability)
- 16.2.12 GenMark Diagnostics Inc
- 16.2.12.1. Overview
- 16.2.12.2. Products
- 16.2.12.3. SWOT Analysis
- 16.2.12.4. Recent Developments
- 16.2.12.5. Financials (Based on Availability)
- 16.2.13 bioMérieux
- 16.2.13.1. Overview
- 16.2.13.2. Products
- 16.2.13.3. SWOT Analysis
- 16.2.13.4. Recent Developments
- 16.2.13.5. Financials (Based on Availability)
- 16.2.1 Pacific Bioscience
List of Figures
- Figure 1: Global Digital Genome Market Revenue Breakdown (Million, %) by Region 2024 & 2032
- Figure 2: Global Digital Genome Market Volume Breakdown (K Unit, %) by Region 2024 & 2032
- Figure 3: North America Digital Genome Market Revenue (Million), by Country 2024 & 2032
- Figure 4: North America Digital Genome Market Volume (K Unit), by Country 2024 & 2032
- Figure 5: North America Digital Genome Market Revenue Share (%), by Country 2024 & 2032
- Figure 6: North America Digital Genome Market Volume Share (%), by Country 2024 & 2032
- Figure 7: Europe Digital Genome Market Revenue (Million), by Country 2024 & 2032
- Figure 8: Europe Digital Genome Market Volume (K Unit), by Country 2024 & 2032
- Figure 9: Europe Digital Genome Market Revenue Share (%), by Country 2024 & 2032
- Figure 10: Europe Digital Genome Market Volume Share (%), by Country 2024 & 2032
- Figure 11: Asia Pacific Digital Genome Market Revenue (Million), by Country 2024 & 2032
- Figure 12: Asia Pacific Digital Genome Market Volume (K Unit), by Country 2024 & 2032
- Figure 13: Asia Pacific Digital Genome Market Revenue Share (%), by Country 2024 & 2032
- Figure 14: Asia Pacific Digital Genome Market Volume Share (%), by Country 2024 & 2032
- Figure 15: Middle East and Africa Digital Genome Market Revenue (Million), by Country 2024 & 2032
- Figure 16: Middle East and Africa Digital Genome Market Volume (K Unit), by Country 2024 & 2032
- Figure 17: Middle East and Africa Digital Genome Market Revenue Share (%), by Country 2024 & 2032
- Figure 18: Middle East and Africa Digital Genome Market Volume Share (%), by Country 2024 & 2032
- Figure 19: South America Digital Genome Market Revenue (Million), by Country 2024 & 2032
- Figure 20: South America Digital Genome Market Volume (K Unit), by Country 2024 & 2032
- Figure 21: South America Digital Genome Market Revenue Share (%), by Country 2024 & 2032
- Figure 22: South America Digital Genome Market Volume Share (%), by Country 2024 & 2032
- Figure 23: North America Digital Genome Market Revenue (Million), by Product 2024 & 2032
- Figure 24: North America Digital Genome Market Volume (K Unit), by Product 2024 & 2032
- Figure 25: North America Digital Genome Market Revenue Share (%), by Product 2024 & 2032
- Figure 26: North America Digital Genome Market Volume Share (%), by Product 2024 & 2032
- Figure 27: North America Digital Genome Market Revenue (Million), by Application 2024 & 2032
- Figure 28: North America Digital Genome Market Volume (K Unit), by Application 2024 & 2032
- Figure 29: North America Digital Genome Market Revenue Share (%), by Application 2024 & 2032
- Figure 30: North America Digital Genome Market Volume Share (%), by Application 2024 & 2032
- Figure 31: North America Digital Genome Market Revenue (Million), by End User 2024 & 2032
- Figure 32: North America Digital Genome Market Volume (K Unit), by End User 2024 & 2032
- Figure 33: North America Digital Genome Market Revenue Share (%), by End User 2024 & 2032
- Figure 34: North America Digital Genome Market Volume Share (%), by End User 2024 & 2032
- Figure 35: North America Digital Genome Market Revenue (Million), by Country 2024 & 2032
- Figure 36: North America Digital Genome Market Volume (K Unit), by Country 2024 & 2032
- Figure 37: North America Digital Genome Market Revenue Share (%), by Country 2024 & 2032
- Figure 38: North America Digital Genome Market Volume Share (%), by Country 2024 & 2032
- Figure 39: Europe Digital Genome Market Revenue (Million), by Product 2024 & 2032
- Figure 40: Europe Digital Genome Market Volume (K Unit), by Product 2024 & 2032
- Figure 41: Europe Digital Genome Market Revenue Share (%), by Product 2024 & 2032
- Figure 42: Europe Digital Genome Market Volume Share (%), by Product 2024 & 2032
- Figure 43: Europe Digital Genome Market Revenue (Million), by Application 2024 & 2032
- Figure 44: Europe Digital Genome Market Volume (K Unit), by Application 2024 & 2032
- Figure 45: Europe Digital Genome Market Revenue Share (%), by Application 2024 & 2032
- Figure 46: Europe Digital Genome Market Volume Share (%), by Application 2024 & 2032
- Figure 47: Europe Digital Genome Market Revenue (Million), by End User 2024 & 2032
- Figure 48: Europe Digital Genome Market Volume (K Unit), by End User 2024 & 2032
- Figure 49: Europe Digital Genome Market Revenue Share (%), by End User 2024 & 2032
- Figure 50: Europe Digital Genome Market Volume Share (%), by End User 2024 & 2032
- Figure 51: Europe Digital Genome Market Revenue (Million), by Country 2024 & 2032
- Figure 52: Europe Digital Genome Market Volume (K Unit), by Country 2024 & 2032
- Figure 53: Europe Digital Genome Market Revenue Share (%), by Country 2024 & 2032
- Figure 54: Europe Digital Genome Market Volume Share (%), by Country 2024 & 2032
- Figure 55: Asia Pacific Digital Genome Market Revenue (Million), by Product 2024 & 2032
- Figure 56: Asia Pacific Digital Genome Market Volume (K Unit), by Product 2024 & 2032
- Figure 57: Asia Pacific Digital Genome Market Revenue Share (%), by Product 2024 & 2032
- Figure 58: Asia Pacific Digital Genome Market Volume Share (%), by Product 2024 & 2032
- Figure 59: Asia Pacific Digital Genome Market Revenue (Million), by Application 2024 & 2032
- Figure 60: Asia Pacific Digital Genome Market Volume (K Unit), by Application 2024 & 2032
- Figure 61: Asia Pacific Digital Genome Market Revenue Share (%), by Application 2024 & 2032
- Figure 62: Asia Pacific Digital Genome Market Volume Share (%), by Application 2024 & 2032
- Figure 63: Asia Pacific Digital Genome Market Revenue (Million), by End User 2024 & 2032
- Figure 64: Asia Pacific Digital Genome Market Volume (K Unit), by End User 2024 & 2032
- Figure 65: Asia Pacific Digital Genome Market Revenue Share (%), by End User 2024 & 2032
- Figure 66: Asia Pacific Digital Genome Market Volume Share (%), by End User 2024 & 2032
- Figure 67: Asia Pacific Digital Genome Market Revenue (Million), by Country 2024 & 2032
- Figure 68: Asia Pacific Digital Genome Market Volume (K Unit), by Country 2024 & 2032
- Figure 69: Asia Pacific Digital Genome Market Revenue Share (%), by Country 2024 & 2032
- Figure 70: Asia Pacific Digital Genome Market Volume Share (%), by Country 2024 & 2032
- Figure 71: Middle East and Africa Digital Genome Market Revenue (Million), by Product 2024 & 2032
- Figure 72: Middle East and Africa Digital Genome Market Volume (K Unit), by Product 2024 & 2032
- Figure 73: Middle East and Africa Digital Genome Market Revenue Share (%), by Product 2024 & 2032
- Figure 74: Middle East and Africa Digital Genome Market Volume Share (%), by Product 2024 & 2032
- Figure 75: Middle East and Africa Digital Genome Market Revenue (Million), by Application 2024 & 2032
- Figure 76: Middle East and Africa Digital Genome Market Volume (K Unit), by Application 2024 & 2032
- Figure 77: Middle East and Africa Digital Genome Market Revenue Share (%), by Application 2024 & 2032
- Figure 78: Middle East and Africa Digital Genome Market Volume Share (%), by Application 2024 & 2032
- Figure 79: Middle East and Africa Digital Genome Market Revenue (Million), by End User 2024 & 2032
- Figure 80: Middle East and Africa Digital Genome Market Volume (K Unit), by End User 2024 & 2032
- Figure 81: Middle East and Africa Digital Genome Market Revenue Share (%), by End User 2024 & 2032
- Figure 82: Middle East and Africa Digital Genome Market Volume Share (%), by End User 2024 & 2032
- Figure 83: Middle East and Africa Digital Genome Market Revenue (Million), by Country 2024 & 2032
- Figure 84: Middle East and Africa Digital Genome Market Volume (K Unit), by Country 2024 & 2032
- Figure 85: Middle East and Africa Digital Genome Market Revenue Share (%), by Country 2024 & 2032
- Figure 86: Middle East and Africa Digital Genome Market Volume Share (%), by Country 2024 & 2032
- Figure 87: South America Digital Genome Market Revenue (Million), by Product 2024 & 2032
- Figure 88: South America Digital Genome Market Volume (K Unit), by Product 2024 & 2032
- Figure 89: South America Digital Genome Market Revenue Share (%), by Product 2024 & 2032
- Figure 90: South America Digital Genome Market Volume Share (%), by Product 2024 & 2032
- Figure 91: South America Digital Genome Market Revenue (Million), by Application 2024 & 2032
- Figure 92: South America Digital Genome Market Volume (K Unit), by Application 2024 & 2032
- Figure 93: South America Digital Genome Market Revenue Share (%), by Application 2024 & 2032
- Figure 94: South America Digital Genome Market Volume Share (%), by Application 2024 & 2032
- Figure 95: South America Digital Genome Market Revenue (Million), by End User 2024 & 2032
- Figure 96: South America Digital Genome Market Volume (K Unit), by End User 2024 & 2032
- Figure 97: South America Digital Genome Market Revenue Share (%), by End User 2024 & 2032
- Figure 98: South America Digital Genome Market Volume Share (%), by End User 2024 & 2032
- Figure 99: South America Digital Genome Market Revenue (Million), by Country 2024 & 2032
- Figure 100: South America Digital Genome Market Volume (K Unit), by Country 2024 & 2032
- Figure 101: South America Digital Genome Market Revenue Share (%), by Country 2024 & 2032
- Figure 102: South America Digital Genome Market Volume Share (%), by Country 2024 & 2032
List of Tables
- Table 1: Global Digital Genome Market Revenue Million Forecast, by Region 2019 & 2032
- Table 2: Global Digital Genome Market Volume K Unit Forecast, by Region 2019 & 2032
- Table 3: Global Digital Genome Market Revenue Million Forecast, by Product 2019 & 2032
- Table 4: Global Digital Genome Market Volume K Unit Forecast, by Product 2019 & 2032
- Table 5: Global Digital Genome Market Revenue Million Forecast, by Application 2019 & 2032
- Table 6: Global Digital Genome Market Volume K Unit Forecast, by Application 2019 & 2032
- Table 7: Global Digital Genome Market Revenue Million Forecast, by End User 2019 & 2032
- Table 8: Global Digital Genome Market Volume K Unit Forecast, by End User 2019 & 2032
- Table 9: Global Digital Genome Market Revenue Million Forecast, by Region 2019 & 2032
- Table 10: Global Digital Genome Market Volume K Unit Forecast, by Region 2019 & 2032
- Table 11: Global Digital Genome Market Revenue Million Forecast, by Country 2019 & 2032
- Table 12: Global Digital Genome Market Volume K Unit Forecast, by Country 2019 & 2032
- Table 13: United States Digital Genome Market Revenue (Million) Forecast, by Application 2019 & 2032
- Table 14: United States Digital Genome Market Volume (K Unit) Forecast, by Application 2019 & 2032
- Table 15: Canada Digital Genome Market Revenue (Million) Forecast, by Application 2019 & 2032
- Table 16: Canada Digital Genome Market Volume (K Unit) Forecast, by Application 2019 & 2032
- Table 17: Mexico Digital Genome Market Revenue (Million) Forecast, by Application 2019 & 2032
- Table 18: Mexico Digital Genome Market Volume (K Unit) Forecast, by Application 2019 & 2032
- Table 19: Global Digital Genome Market Revenue Million Forecast, by Country 2019 & 2032
- Table 20: Global Digital Genome Market Volume K Unit Forecast, by Country 2019 & 2032
- Table 21: Germany Digital Genome Market Revenue (Million) Forecast, by Application 2019 & 2032
- Table 22: Germany Digital Genome Market Volume (K Unit) Forecast, by Application 2019 & 2032
- Table 23: United Kingdom Digital Genome Market Revenue (Million) Forecast, by Application 2019 & 2032
- Table 24: United Kingdom Digital Genome Market Volume (K Unit) Forecast, by Application 2019 & 2032
- Table 25: France Digital Genome Market Revenue (Million) Forecast, by Application 2019 & 2032
- Table 26: France Digital Genome Market Volume (K Unit) Forecast, by Application 2019 & 2032
- Table 27: Italy Digital Genome Market Revenue (Million) Forecast, by Application 2019 & 2032
- Table 28: Italy Digital Genome Market Volume (K Unit) Forecast, by Application 2019 & 2032
- Table 29: Spain Digital Genome Market Revenue (Million) Forecast, by Application 2019 & 2032
- Table 30: Spain Digital Genome Market Volume (K Unit) Forecast, by Application 2019 & 2032
- Table 31: Rest of Europe Digital Genome Market Revenue (Million) Forecast, by Application 2019 & 2032
- Table 32: Rest of Europe Digital Genome Market Volume (K Unit) Forecast, by Application 2019 & 2032
- Table 33: Global Digital Genome Market Revenue Million Forecast, by Country 2019 & 2032
- Table 34: Global Digital Genome Market Volume K Unit Forecast, by Country 2019 & 2032
- Table 35: China Digital Genome Market Revenue (Million) Forecast, by Application 2019 & 2032
- Table 36: China Digital Genome Market Volume (K Unit) Forecast, by Application 2019 & 2032
- Table 37: Japan Digital Genome Market Revenue (Million) Forecast, by Application 2019 & 2032
- Table 38: Japan Digital Genome Market Volume (K Unit) Forecast, by Application 2019 & 2032
- Table 39: India Digital Genome Market Revenue (Million) Forecast, by Application 2019 & 2032
- Table 40: India Digital Genome Market Volume (K Unit) Forecast, by Application 2019 & 2032
- Table 41: Australia Digital Genome Market Revenue (Million) Forecast, by Application 2019 & 2032
- Table 42: Australia Digital Genome Market Volume (K Unit) Forecast, by Application 2019 & 2032
- Table 43: South Korea Digital Genome Market Revenue (Million) Forecast, by Application 2019 & 2032
- Table 44: South Korea Digital Genome Market Volume (K Unit) Forecast, by Application 2019 & 2032
- Table 45: Rest of Asia Pacific Digital Genome Market Revenue (Million) Forecast, by Application 2019 & 2032
- Table 46: Rest of Asia Pacific Digital Genome Market Volume (K Unit) Forecast, by Application 2019 & 2032
- Table 47: Global Digital Genome Market Revenue Million Forecast, by Country 2019 & 2032
- Table 48: Global Digital Genome Market Volume K Unit Forecast, by Country 2019 & 2032
- Table 49: GCC Digital Genome Market Revenue (Million) Forecast, by Application 2019 & 2032
- Table 50: GCC Digital Genome Market Volume (K Unit) Forecast, by Application 2019 & 2032
- Table 51: South Africa Digital Genome Market Revenue (Million) Forecast, by Application 2019 & 2032
- Table 52: South Africa Digital Genome Market Volume (K Unit) Forecast, by Application 2019 & 2032
- Table 53: Rest of Middle East and Africa Digital Genome Market Revenue (Million) Forecast, by Application 2019 & 2032
- Table 54: Rest of Middle East and Africa Digital Genome Market Volume (K Unit) Forecast, by Application 2019 & 2032
- Table 55: Global Digital Genome Market Revenue Million Forecast, by Country 2019 & 2032
- Table 56: Global Digital Genome Market Volume K Unit Forecast, by Country 2019 & 2032
- Table 57: Brazil Digital Genome Market Revenue (Million) Forecast, by Application 2019 & 2032
- Table 58: Brazil Digital Genome Market Volume (K Unit) Forecast, by Application 2019 & 2032
- Table 59: Argentina Digital Genome Market Revenue (Million) Forecast, by Application 2019 & 2032
- Table 60: Argentina Digital Genome Market Volume (K Unit) Forecast, by Application 2019 & 2032
- Table 61: Rest of South America Digital Genome Market Revenue (Million) Forecast, by Application 2019 & 2032
- Table 62: Rest of South America Digital Genome Market Volume (K Unit) Forecast, by Application 2019 & 2032
- Table 63: Global Digital Genome Market Revenue Million Forecast, by Product 2019 & 2032
- Table 64: Global Digital Genome Market Volume K Unit Forecast, by Product 2019 & 2032
- Table 65: Global Digital Genome Market Revenue Million Forecast, by Application 2019 & 2032
- Table 66: Global Digital Genome Market Volume K Unit Forecast, by Application 2019 & 2032
- Table 67: Global Digital Genome Market Revenue Million Forecast, by End User 2019 & 2032
- Table 68: Global Digital Genome Market Volume K Unit Forecast, by End User 2019 & 2032
- Table 69: Global Digital Genome Market Revenue Million Forecast, by Country 2019 & 2032
- Table 70: Global Digital Genome Market Volume K Unit Forecast, by Country 2019 & 2032
- Table 71: United States Digital Genome Market Revenue (Million) Forecast, by Application 2019 & 2032
- Table 72: United States Digital Genome Market Volume (K Unit) Forecast, by Application 2019 & 2032
- Table 73: Canada Digital Genome Market Revenue (Million) Forecast, by Application 2019 & 2032
- Table 74: Canada Digital Genome Market Volume (K Unit) Forecast, by Application 2019 & 2032
- Table 75: Mexico Digital Genome Market Revenue (Million) Forecast, by Application 2019 & 2032
- Table 76: Mexico Digital Genome Market Volume (K Unit) Forecast, by Application 2019 & 2032
- Table 77: Global Digital Genome Market Revenue Million Forecast, by Product 2019 & 2032
- Table 78: Global Digital Genome Market Volume K Unit Forecast, by Product 2019 & 2032
- Table 79: Global Digital Genome Market Revenue Million Forecast, by Application 2019 & 2032
- Table 80: Global Digital Genome Market Volume K Unit Forecast, by Application 2019 & 2032
- Table 81: Global Digital Genome Market Revenue Million Forecast, by End User 2019 & 2032
- Table 82: Global Digital Genome Market Volume K Unit Forecast, by End User 2019 & 2032
- Table 83: Global Digital Genome Market Revenue Million Forecast, by Country 2019 & 2032
- Table 84: Global Digital Genome Market Volume K Unit Forecast, by Country 2019 & 2032
- Table 85: Germany Digital Genome Market Revenue (Million) Forecast, by Application 2019 & 2032
- Table 86: Germany Digital Genome Market Volume (K Unit) Forecast, by Application 2019 & 2032
- Table 87: United Kingdom Digital Genome Market Revenue (Million) Forecast, by Application 2019 & 2032
- Table 88: United Kingdom Digital Genome Market Volume (K Unit) Forecast, by Application 2019 & 2032
- Table 89: France Digital Genome Market Revenue (Million) Forecast, by Application 2019 & 2032
- Table 90: France Digital Genome Market Volume (K Unit) Forecast, by Application 2019 & 2032
- Table 91: Italy Digital Genome Market Revenue (Million) Forecast, by Application 2019 & 2032
- Table 92: Italy Digital Genome Market Volume (K Unit) Forecast, by Application 2019 & 2032
- Table 93: Spain Digital Genome Market Revenue (Million) Forecast, by Application 2019 & 2032
- Table 94: Spain Digital Genome Market Volume (K Unit) Forecast, by Application 2019 & 2032
- Table 95: Rest of Europe Digital Genome Market Revenue (Million) Forecast, by Application 2019 & 2032
- Table 96: Rest of Europe Digital Genome Market Volume (K Unit) Forecast, by Application 2019 & 2032
- Table 97: Global Digital Genome Market Revenue Million Forecast, by Product 2019 & 2032
- Table 98: Global Digital Genome Market Volume K Unit Forecast, by Product 2019 & 2032
- Table 99: Global Digital Genome Market Revenue Million Forecast, by Application 2019 & 2032
- Table 100: Global Digital Genome Market Volume K Unit Forecast, by Application 2019 & 2032
- Table 101: Global Digital Genome Market Revenue Million Forecast, by End User 2019 & 2032
- Table 102: Global Digital Genome Market Volume K Unit Forecast, by End User 2019 & 2032
- Table 103: Global Digital Genome Market Revenue Million Forecast, by Country 2019 & 2032
- Table 104: Global Digital Genome Market Volume K Unit Forecast, by Country 2019 & 2032
- Table 105: China Digital Genome Market Revenue (Million) Forecast, by Application 2019 & 2032
- Table 106: China Digital Genome Market Volume (K Unit) Forecast, by Application 2019 & 2032
- Table 107: Japan Digital Genome Market Revenue (Million) Forecast, by Application 2019 & 2032
- Table 108: Japan Digital Genome Market Volume (K Unit) Forecast, by Application 2019 & 2032
- Table 109: India Digital Genome Market Revenue (Million) Forecast, by Application 2019 & 2032
- Table 110: India Digital Genome Market Volume (K Unit) Forecast, by Application 2019 & 2032
- Table 111: Australia Digital Genome Market Revenue (Million) Forecast, by Application 2019 & 2032
- Table 112: Australia Digital Genome Market Volume (K Unit) Forecast, by Application 2019 & 2032
- Table 113: South Korea Digital Genome Market Revenue (Million) Forecast, by Application 2019 & 2032
- Table 114: South Korea Digital Genome Market Volume (K Unit) Forecast, by Application 2019 & 2032
- Table 115: Rest of Asia Pacific Digital Genome Market Revenue (Million) Forecast, by Application 2019 & 2032
- Table 116: Rest of Asia Pacific Digital Genome Market Volume (K Unit) Forecast, by Application 2019 & 2032
- Table 117: Global Digital Genome Market Revenue Million Forecast, by Product 2019 & 2032
- Table 118: Global Digital Genome Market Volume K Unit Forecast, by Product 2019 & 2032
- Table 119: Global Digital Genome Market Revenue Million Forecast, by Application 2019 & 2032
- Table 120: Global Digital Genome Market Volume K Unit Forecast, by Application 2019 & 2032
- Table 121: Global Digital Genome Market Revenue Million Forecast, by End User 2019 & 2032
- Table 122: Global Digital Genome Market Volume K Unit Forecast, by End User 2019 & 2032
- Table 123: Global Digital Genome Market Revenue Million Forecast, by Country 2019 & 2032
- Table 124: Global Digital Genome Market Volume K Unit Forecast, by Country 2019 & 2032
- Table 125: GCC Digital Genome Market Revenue (Million) Forecast, by Application 2019 & 2032
- Table 126: GCC Digital Genome Market Volume (K Unit) Forecast, by Application 2019 & 2032
- Table 127: South Africa Digital Genome Market Revenue (Million) Forecast, by Application 2019 & 2032
- Table 128: South Africa Digital Genome Market Volume (K Unit) Forecast, by Application 2019 & 2032
- Table 129: Rest of Middle East and Africa Digital Genome Market Revenue (Million) Forecast, by Application 2019 & 2032
- Table 130: Rest of Middle East and Africa Digital Genome Market Volume (K Unit) Forecast, by Application 2019 & 2032
- Table 131: Global Digital Genome Market Revenue Million Forecast, by Product 2019 & 2032
- Table 132: Global Digital Genome Market Volume K Unit Forecast, by Product 2019 & 2032
- Table 133: Global Digital Genome Market Revenue Million Forecast, by Application 2019 & 2032
- Table 134: Global Digital Genome Market Volume K Unit Forecast, by Application 2019 & 2032
- Table 135: Global Digital Genome Market Revenue Million Forecast, by End User 2019 & 2032
- Table 136: Global Digital Genome Market Volume K Unit Forecast, by End User 2019 & 2032
- Table 137: Global Digital Genome Market Revenue Million Forecast, by Country 2019 & 2032
- Table 138: Global Digital Genome Market Volume K Unit Forecast, by Country 2019 & 2032
- Table 139: Brazil Digital Genome Market Revenue (Million) Forecast, by Application 2019 & 2032
- Table 140: Brazil Digital Genome Market Volume (K Unit) Forecast, by Application 2019 & 2032
- Table 141: Argentina Digital Genome Market Revenue (Million) Forecast, by Application 2019 & 2032
- Table 142: Argentina Digital Genome Market Volume (K Unit) Forecast, by Application 2019 & 2032
- Table 143: Rest of South America Digital Genome Market Revenue (Million) Forecast, by Application 2019 & 2032
- Table 144: Rest of South America Digital Genome Market Volume (K Unit) Forecast, by Application 2019 & 2032
Frequently Asked Questions
1. What is the projected Compound Annual Growth Rate (CAGR) of the Digital Genome Market?
The projected CAGR is approximately 13.46%.
2. Which companies are prominent players in the Digital Genome Market?
Key companies in the market include Pacific Bioscience, Invitae Corporation, Illumina, GE Healthcare, Quest Diagnostics, Qiagen, Thermo Fisher Scientific, Inscripta Inc, PerkinElmer Inc, Agilent Technologies, NanoString Technologies Inc, GenMark Diagnostics Inc, bioMérieux.
3. What are the main segments of the Digital Genome Market?
The market segments include Product, Application, End User.
4. Can you provide details about the market size?
The market size is estimated to be USD 30.68 Million as of 2022.
5. What are some drivers contributing to market growth?
Increasing Technological Advancements. and Research and Development Pertaining to Digital Genome; Growing Adoption of Personalized Medicine; Constantly Evolving Disease Patterns.
6. What are the notable trends driving market growth?
Sequencing and Analysis Software Segment is Expected to Hold a Major Market Share in the Digital Genome Market Over the Forecast Period.
7. Are there any restraints impacting market growth?
High Capital Expenditure; Lack of Skilled Workforce.
8. Can you provide examples of recent developments in the market?
In May 2022, Gencove, one of the leading low-pass whole genome sequencing and analysis software companies, along with NEOGEN Corporation, launched the InfiniSEEK, a revolutionary, cost-effective solution for whole genome sequencing and targeted SNP analysis from two trusted leaders in genomics.
9. What pricing options are available for accessing the report?
Pricing options include single-user, multi-user, and enterprise licenses priced at USD 4750, USD 5250, and USD 8750 respectively.
10. Is the market size provided in terms of value or volume?
The market size is provided in terms of value, measured in Million and volume, measured in K Unit.
11. Are there any specific market keywords associated with the report?
Yes, the market keyword associated with the report is "Digital Genome Market," which aids in identifying and referencing the specific market segment covered.
12. How do I determine which pricing option suits my needs best?
The pricing options vary based on user requirements and access needs. Individual users may opt for single-user licenses, while businesses requiring broader access may choose multi-user or enterprise licenses for cost-effective access to the report.
13. Are there any additional resources or data provided in the Digital Genome Market report?
While the report offers comprehensive insights, it's advisable to review the specific contents or supplementary materials provided to ascertain if additional resources or data are available.
14. How can I stay updated on further developments or reports in the Digital Genome Market?
To stay informed about further developments, trends, and reports in the Digital Genome Market, consider subscribing to industry newsletters, following relevant companies and organizations, or regularly checking reputable industry news sources and publications.
Methodology
Step 1 - Identification of Relevant Samples Size from Population Database


Step 2 - Approaches for Defining Global Market Size (Value, Volume* & Price*)

Note*: In applicable scenarios
Step 3 - Data Sources
Primary Research
- Web Analytics
- Survey Reports
- Research Institute
- Latest Research Reports
- Opinion Leaders
Secondary Research
- Annual Reports
- White Paper
- Latest Press Release
- Industry Association
- Paid Database
- Investor Presentations

Step 4 - Data Triangulation
Involves using different sources of information in order to increase the validity of a study
These sources are likely to be stakeholders in a program - participants, other researchers, program staff, other community members, and so on.
Then we put all data in single framework & apply various statistical tools to find out the dynamic on the market.
During the analysis stage, feedback from the stakeholder groups would be compared to determine areas of agreement as well as areas of divergence


