
Key Insights
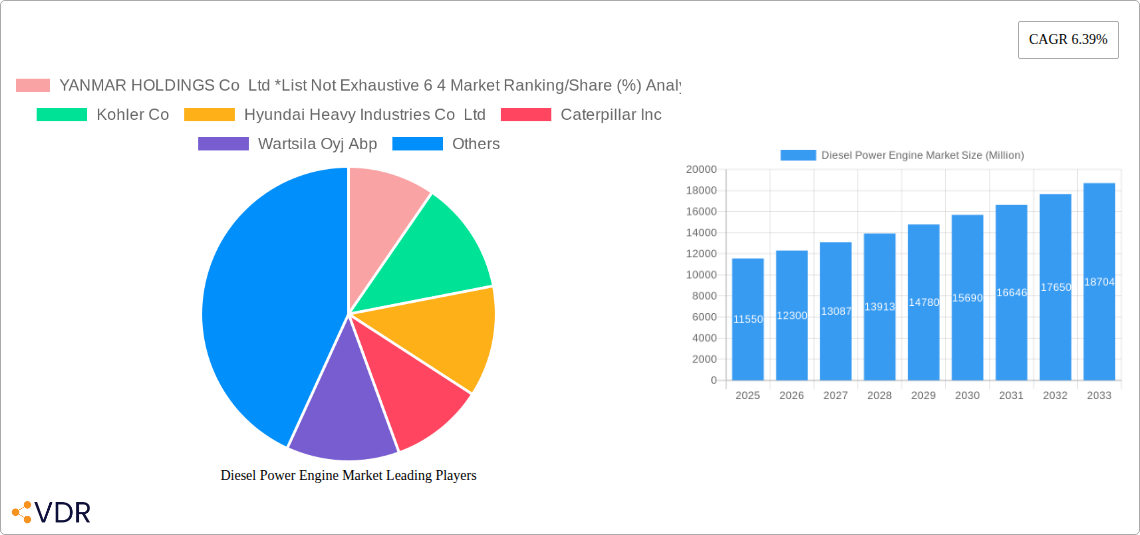
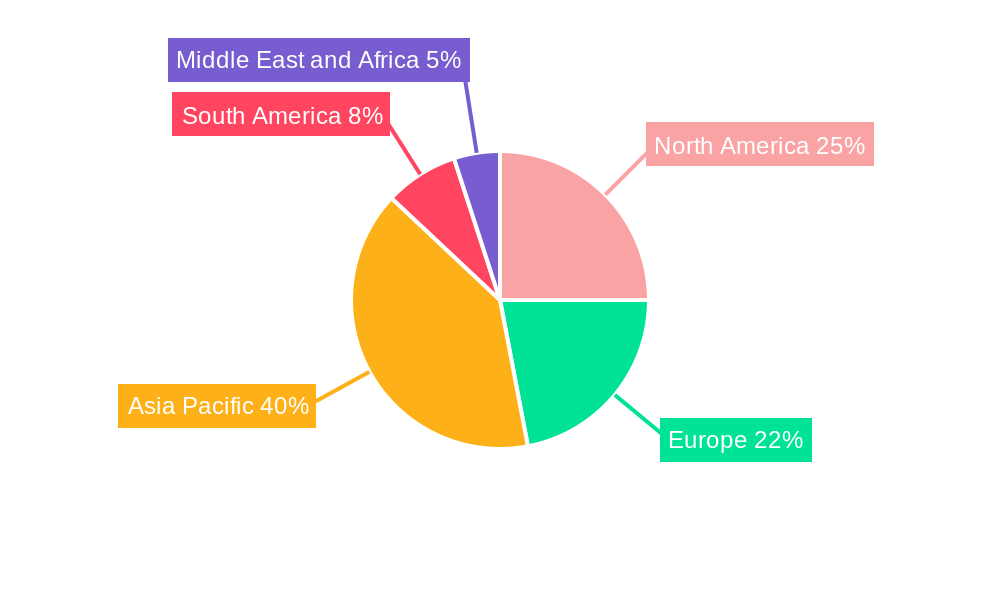
The global diesel power engine market, valued at $11.55 billion in 2025, is projected to experience robust growth, driven by increasing industrialization, particularly in developing economies, and the rising demand for reliable power solutions in remote areas lacking extensive grid infrastructure. The market's Compound Annual Growth Rate (CAGR) of 6.39% from 2025 to 2033 indicates a significant expansion over the forecast period. Key growth drivers include the ongoing need for backup power in commercial and residential sectors, coupled with the expanding adoption of diesel engines in peak-shaving applications to manage fluctuating energy demands. The industrial sector remains the largest end-user segment, fueled by robust demand from construction, mining, and agriculture, where diesel engines provide essential power for heavy machinery. However, stricter emission regulations and the increasing adoption of alternative power sources, such as natural gas and renewable energy, pose considerable restraints on market growth. This necessitates manufacturers to innovate and develop cleaner, more efficient diesel engines to maintain market competitiveness. The geographic distribution of the market reveals strong growth in Asia-Pacific, driven by rapid industrialization and infrastructure development in countries like China and India. North America and Europe also represent significant markets, though their growth rates are expected to be comparatively moderate due to the mature nature of their respective power generation infrastructure and stringent environmental regulations.
The segmentation analysis reveals that the industrial segment constitutes the largest share of the market due to its reliance on heavy-duty diesel engines. The standby application segment also contributes significantly to overall market growth, owing to its importance for emergency power needs across various sectors. The competitive landscape is dominated by established players like Yanmar Holdings, Kohler, Caterpillar, and Cummins, alongside other key players. These companies are strategically investing in research and development to improve engine efficiency, reduce emissions, and meet evolving customer demands. Future market growth will hinge on the success of these players in adapting to stricter environmental regulations and the emerging trend of electrification in certain applications while still offering robust and reliable power solutions in markets where diesel remains essential.
Diesel Power Engine Market: A Comprehensive Market Report (2019-2033)
This in-depth report provides a comprehensive analysis of the global Diesel Power Engine market, encompassing market dynamics, growth trends, regional dominance, product landscape, key challenges, emerging opportunities, and key players. The study period covers 2019-2033, with 2025 as the base year. The report segments the market by end-user (Industrial, Commercial, Residential) and application (Standby, Prime, Peak Shaving), offering granular insights into market size (in Million units) and growth trajectories.
Diesel Power Engine Market Dynamics & Structure
The diesel power engine market is characterized by moderate concentration, with key players holding significant market share. However, the landscape is dynamic, driven by technological innovations, stringent environmental regulations, and the emergence of competitive substitutes. Mergers and acquisitions (M&A) activity is also impacting market structure.
- Market Concentration: The top 10 players account for approximately xx% of the global market share in 2025. This indicates a moderately concentrated market.
- Technological Innovation: Advancements in fuel efficiency, emission control technologies (e.g., SCR, DPF), and alternative fuel compatibility are driving market growth. However, high R&D costs and regulatory uncertainty present innovation barriers.
- Regulatory Landscape: Stringent emission standards (e.g., EU Stage V, US EPA Tier 4 Final) are pushing manufacturers to develop cleaner engines, impacting both cost and design. This necessitates significant investment in compliance technologies.
- Competitive Substitutes: The rise of alternative power sources like natural gas engines and renewable energy solutions presents a challenge to diesel engine dominance, especially in certain applications.
- End-User Demographics: The industrial sector currently dominates the market, followed by commercial and residential segments. Growth in infrastructure development and industrialization fuels demand.
- M&A Activity: The past five years have witnessed xx M&A deals in the diesel power engine sector, primarily aimed at expanding product portfolios, geographical reach, and technological capabilities.
Diesel Power Engine Market Growth Trends & Insights
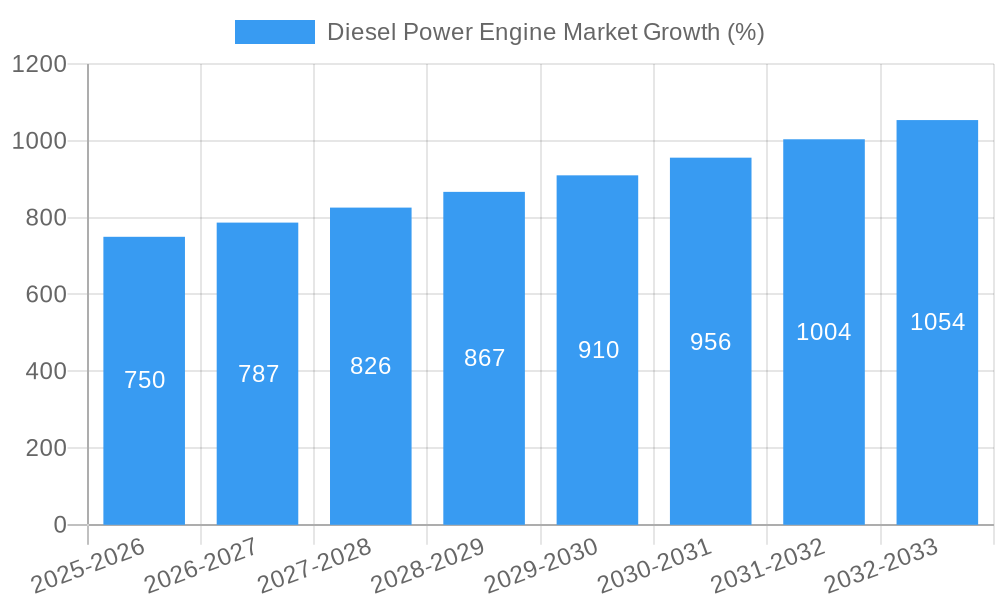
The global diesel power engine market witnessed a CAGR of xx% during the historical period (2019-2024) and is projected to maintain a CAGR of xx% during the forecast period (2025-2033). This growth is fueled by increasing industrialization, infrastructure development, and rising demand for reliable power solutions across various sectors. However, the transition towards greener energy alternatives and stricter emission regulations pose challenges to sustained growth. Market penetration in developing economies remains significant growth opportunity. Technological disruptions, such as the adoption of hydrogen injection kits and the use of alternative fuels like HVO, are reshaping the market dynamics.
Dominant Regions, Countries, or Segments in Diesel Power Engine Market
The Industrial segment currently holds the largest market share, driven by strong demand from construction, mining, and manufacturing industries. Geographically, the Asia-Pacific region is expected to be the dominant market, followed by North America and Europe.
- Key Drivers:
- Asia-Pacific: Rapid industrialization, expanding infrastructure projects, and increasing urbanization are major drivers.
- North America: Robust construction activities and replacement demand in existing power generation systems fuel market growth.
- Europe: Stringent emission regulations are pushing adoption of advanced diesel engines and alternative fuel technologies.
- Industrial Segment Dominance: This segment's larger market share stems from its diverse applications across various industries and higher power requirements compared to commercial and residential segments.
- Growth Potential: Developing countries in Asia and Africa offer considerable growth potential due to increasing energy demand and infrastructure development initiatives. The Prime application segment also shows strong growth projections due to its reliability and widespread applicability.
Diesel Power Engine Market Product Landscape
Modern diesel power engines are characterized by enhanced fuel efficiency, lower emissions, and improved durability. Technological advancements focus on integrating advanced emission control systems, optimizing combustion processes, and exploring alternative fuels like HVO and biodiesel blends. Key selling points include robust performance, reliability, and compliance with stringent environmental regulations. Manufacturers are also focusing on digitalization and data analytics to optimize engine performance and maintenance.
Key Drivers, Barriers & Challenges in Diesel Power Engine Market
Key Drivers:
- Infrastructure Development: Global infrastructure projects drive demand for reliable power generation.
- Industrialization: Growth in manufacturing and industrial sectors fuels demand for diesel engines.
- Technological Advancements: Innovations in fuel efficiency and emission reduction technologies enhance market appeal.
Key Challenges:
- Stringent Emission Regulations: Meeting stringent emission norms adds to manufacturing costs and complexity.
- Rising Fuel Prices: Fluctuations in diesel fuel prices impact operating costs and consumer affordability.
- Competition from Alternative Power Sources: Natural gas engines and renewable energy solutions pose competition. The shift towards electrification is also a significant challenge.
Emerging Opportunities in Diesel Power Engine Market
- Alternative Fuels: Growing adoption of HVO and biodiesel blends presents significant opportunities.
- Hybrid and Electric Power Systems: Integration of diesel engines with hybrid or electric components opens new avenues.
- Data Analytics and Digitalization: Remote monitoring and predictive maintenance services enhance operational efficiency.
Growth Accelerators in the Diesel Power Engine Market Industry
Technological breakthroughs in fuel efficiency and emission control, strategic partnerships to expand market access, and aggressive investments in R&D are critical factors accelerating long-term growth. Expansion into developing economies and diversifying applications (e.g., marine, off-highway) will also fuel future growth.
Key Players Shaping the Diesel Power Engine Market Market
- YANMAR HOLDINGS Co Ltd
- Kohler Co
- Hyundai Heavy Industries Co Ltd
- Caterpillar Inc
- Wartsila Oyj Abp
- Cummins Inc
- Volvo AB
- Man SE
- Mitsubishi Heavy Industries Ltd
- Rolls-Royce Holding PLC
Notable Milestones in Diesel Power Engine Market Sector
- October 2023: Mitsubishi Heavy Industries approved the use of HVO fuel in several engine series. This signifies a shift towards sustainable fuel options.
- August 2023: United H2 Limited launched hydrogen injection kits for diesel engines, offering a path to reduced emissions.
- May 2023: Caterpillar introduced new industrial diesel power units meeting stringent emission standards, reinforcing its commitment to regulatory compliance.
In-Depth Diesel Power Engine Market Market Outlook
The diesel power engine market is poised for continued growth, driven by ongoing infrastructure development, industrial expansion, and the adoption of cleaner technologies. Strategic partnerships, technological innovations (such as the integration of hydrogen technology), and expansion into new applications and markets will be crucial for sustaining long-term growth and profitability within this evolving sector. The market's ability to adapt to stricter environmental regulations and compete effectively with alternative power sources will shape its future trajectory.
Diesel Power Engine Market Segmentation
-
1. End User
- 1.1. Industrial
- 1.2. Commercial
- 1.3. Residential
-
2. Application
- 2.1. Standby
- 2.2. Prime
- 2.3. Peak Shaving
Diesel Power Engine Market Segmentation By Geography
-
1. North America
- 1.1. United States
- 1.2. Canada
- 1.3. Rest of North America
-
2. Europe
- 2.1. United Kingdom
- 2.2. France
- 2.3. Germany
- 2.4. Spain
- 2.5. Rest of Europe
-
3. Asia Pacific
- 3.1. China
- 3.2. India
- 3.3. ASEAN Countries
- 3.4. Australia
- 3.5. Rest of Asia Pacific
-
4. South America
- 4.1. Brazil
- 4.2. Argentina
- 4.3. Rest of South America
-
5. Middle East and Africa
- 5.1. Saudi Arabia
- 5.2. Nigeria
- 5.3. South Africa
- 5.4. Rest of Middle East and Africa
Diesel Power Engine Market REPORT HIGHLIGHTS
| Aspects | Details |
|---|---|
| Study Period | 2019-2033 |
| Base Year | 2024 |
| Estimated Year | 2025 |
| Forecast Period | 2025-2033 |
| Historical Period | 2019-2024 |
| Growth Rate | CAGR of 6.39% from 2019-2033 |
| Segmentation |
|
Table of Contents
- 1. Introduction
- 1.1. Research Scope
- 1.2. Market Segmentation
- 1.3. Research Methodology
- 1.4. Definitions and Assumptions
- 2. Executive Summary
- 2.1. Introduction
- 3. Market Dynamics
- 3.1. Introduction
- 3.2. Market Drivers
- 3.2.1. 4.; Increasing Demand From Industrial Sector4.; Rising Power Outages To Increase The Demand For Diesel Generators
- 3.3. Market Restrains
- 3.3.1. 4.; Increasing Shift Toward Cleaner Energy Resources
- 3.4. Market Trends
- 3.4.1. The Industrial Segment to Dominate the Market
- 4. Market Factor Analysis
- 4.1. Porters Five Forces
- 4.2. Supply/Value Chain
- 4.3. PESTEL analysis
- 4.4. Market Entropy
- 4.5. Patent/Trademark Analysis
- 5. Global Diesel Power Engine Market Analysis, Insights and Forecast, 2019-2031
- 5.1. Market Analysis, Insights and Forecast - by End User
- 5.1.1. Industrial
- 5.1.2. Commercial
- 5.1.3. Residential
- 5.2. Market Analysis, Insights and Forecast - by Application
- 5.2.1. Standby
- 5.2.2. Prime
- 5.2.3. Peak Shaving
- 5.3. Market Analysis, Insights and Forecast - by Region
- 5.3.1. North America
- 5.3.2. Europe
- 5.3.3. Asia Pacific
- 5.3.4. South America
- 5.3.5. Middle East and Africa
- 5.1. Market Analysis, Insights and Forecast - by End User
- 6. North America Diesel Power Engine Market Analysis, Insights and Forecast, 2019-2031
- 6.1. Market Analysis, Insights and Forecast - by End User
- 6.1.1. Industrial
- 6.1.2. Commercial
- 6.1.3. Residential
- 6.2. Market Analysis, Insights and Forecast - by Application
- 6.2.1. Standby
- 6.2.2. Prime
- 6.2.3. Peak Shaving
- 6.1. Market Analysis, Insights and Forecast - by End User
- 7. Europe Diesel Power Engine Market Analysis, Insights and Forecast, 2019-2031
- 7.1. Market Analysis, Insights and Forecast - by End User
- 7.1.1. Industrial
- 7.1.2. Commercial
- 7.1.3. Residential
- 7.2. Market Analysis, Insights and Forecast - by Application
- 7.2.1. Standby
- 7.2.2. Prime
- 7.2.3. Peak Shaving
- 7.1. Market Analysis, Insights and Forecast - by End User
- 8. Asia Pacific Diesel Power Engine Market Analysis, Insights and Forecast, 2019-2031
- 8.1. Market Analysis, Insights and Forecast - by End User
- 8.1.1. Industrial
- 8.1.2. Commercial
- 8.1.3. Residential
- 8.2. Market Analysis, Insights and Forecast - by Application
- 8.2.1. Standby
- 8.2.2. Prime
- 8.2.3. Peak Shaving
- 8.1. Market Analysis, Insights and Forecast - by End User
- 9. South America Diesel Power Engine Market Analysis, Insights and Forecast, 2019-2031
- 9.1. Market Analysis, Insights and Forecast - by End User
- 9.1.1. Industrial
- 9.1.2. Commercial
- 9.1.3. Residential
- 9.2. Market Analysis, Insights and Forecast - by Application
- 9.2.1. Standby
- 9.2.2. Prime
- 9.2.3. Peak Shaving
- 9.1. Market Analysis, Insights and Forecast - by End User
- 10. Middle East and Africa Diesel Power Engine Market Analysis, Insights and Forecast, 2019-2031
- 10.1. Market Analysis, Insights and Forecast - by End User
- 10.1.1. Industrial
- 10.1.2. Commercial
- 10.1.3. Residential
- 10.2. Market Analysis, Insights and Forecast - by Application
- 10.2.1. Standby
- 10.2.2. Prime
- 10.2.3. Peak Shaving
- 10.1. Market Analysis, Insights and Forecast - by End User
- 11. North America Diesel Power Engine Market Analysis, Insights and Forecast, 2019-2031
- 11.1. Market Analysis, Insights and Forecast - By Country/Sub-region
- 11.1.1 United States
- 11.1.2 Canada
- 11.1.3 Rest of North America
- 12. Europe Diesel Power Engine Market Analysis, Insights and Forecast, 2019-2031
- 12.1. Market Analysis, Insights and Forecast - By Country/Sub-region
- 12.1.1 United Kingdom
- 12.1.2 France
- 12.1.3 Germany
- 12.1.4 Spain
- 12.1.5 Rest of Europe
- 13. Asia Pacific Diesel Power Engine Market Analysis, Insights and Forecast, 2019-2031
- 13.1. Market Analysis, Insights and Forecast - By Country/Sub-region
- 13.1.1 China
- 13.1.2 India
- 13.1.3 ASEAN Countries
- 13.1.4 Australia
- 13.1.5 Rest of Asia Pacific
- 14. South America Diesel Power Engine Market Analysis, Insights and Forecast, 2019-2031
- 14.1. Market Analysis, Insights and Forecast - By Country/Sub-region
- 14.1.1 Brazil
- 14.1.2 Argentina
- 14.1.3 Rest of South America
- 15. Middle East and Africa Diesel Power Engine Market Analysis, Insights and Forecast, 2019-2031
- 15.1. Market Analysis, Insights and Forecast - By Country/Sub-region
- 15.1.1 Saudi Arabia
- 15.1.2 Nigeria
- 15.1.3 South Africa
- 15.1.4 Rest of Middle East and Africa
- 16. Competitive Analysis
- 16.1. Global Market Share Analysis 2024
- 16.2. Company Profiles
- 16.2.1 YANMAR HOLDINGS Co Ltd *List Not Exhaustive 6 4 Market Ranking/Share (%) Analysi
- 16.2.1.1. Overview
- 16.2.1.2. Products
- 16.2.1.3. SWOT Analysis
- 16.2.1.4. Recent Developments
- 16.2.1.5. Financials (Based on Availability)
- 16.2.2 Kohler Co
- 16.2.2.1. Overview
- 16.2.2.2. Products
- 16.2.2.3. SWOT Analysis
- 16.2.2.4. Recent Developments
- 16.2.2.5. Financials (Based on Availability)
- 16.2.3 Hyundai Heavy Industries Co Ltd
- 16.2.3.1. Overview
- 16.2.3.2. Products
- 16.2.3.3. SWOT Analysis
- 16.2.3.4. Recent Developments
- 16.2.3.5. Financials (Based on Availability)
- 16.2.4 Caterpillar Inc
- 16.2.4.1. Overview
- 16.2.4.2. Products
- 16.2.4.3. SWOT Analysis
- 16.2.4.4. Recent Developments
- 16.2.4.5. Financials (Based on Availability)
- 16.2.5 Wartsila Oyj Abp
- 16.2.5.1. Overview
- 16.2.5.2. Products
- 16.2.5.3. SWOT Analysis
- 16.2.5.4. Recent Developments
- 16.2.5.5. Financials (Based on Availability)
- 16.2.6 Cummins Inc
- 16.2.6.1. Overview
- 16.2.6.2. Products
- 16.2.6.3. SWOT Analysis
- 16.2.6.4. Recent Developments
- 16.2.6.5. Financials (Based on Availability)
- 16.2.7 Volvo AB
- 16.2.7.1. Overview
- 16.2.7.2. Products
- 16.2.7.3. SWOT Analysis
- 16.2.7.4. Recent Developments
- 16.2.7.5. Financials (Based on Availability)
- 16.2.8 Man SE
- 16.2.8.1. Overview
- 16.2.8.2. Products
- 16.2.8.3. SWOT Analysis
- 16.2.8.4. Recent Developments
- 16.2.8.5. Financials (Based on Availability)
- 16.2.9 Mitsubishi Heavy Industries Ltd
- 16.2.9.1. Overview
- 16.2.9.2. Products
- 16.2.9.3. SWOT Analysis
- 16.2.9.4. Recent Developments
- 16.2.9.5. Financials (Based on Availability)
- 16.2.10 Rolls-Royce Holding PLC
- 16.2.10.1. Overview
- 16.2.10.2. Products
- 16.2.10.3. SWOT Analysis
- 16.2.10.4. Recent Developments
- 16.2.10.5. Financials (Based on Availability)
- 16.2.1 YANMAR HOLDINGS Co Ltd *List Not Exhaustive 6 4 Market Ranking/Share (%) Analysi
List of Figures
- Figure 1: Global Diesel Power Engine Market Revenue Breakdown (Million, %) by Region 2024 & 2032
- Figure 2: Global Diesel Power Engine Market Volume Breakdown (K Unit, %) by Region 2024 & 2032
- Figure 3: North America Diesel Power Engine Market Revenue (Million), by Country 2024 & 2032
- Figure 4: North America Diesel Power Engine Market Volume (K Unit), by Country 2024 & 2032
- Figure 5: North America Diesel Power Engine Market Revenue Share (%), by Country 2024 & 2032
- Figure 6: North America Diesel Power Engine Market Volume Share (%), by Country 2024 & 2032
- Figure 7: Europe Diesel Power Engine Market Revenue (Million), by Country 2024 & 2032
- Figure 8: Europe Diesel Power Engine Market Volume (K Unit), by Country 2024 & 2032
- Figure 9: Europe Diesel Power Engine Market Revenue Share (%), by Country 2024 & 2032
- Figure 10: Europe Diesel Power Engine Market Volume Share (%), by Country 2024 & 2032
- Figure 11: Asia Pacific Diesel Power Engine Market Revenue (Million), by Country 2024 & 2032
- Figure 12: Asia Pacific Diesel Power Engine Market Volume (K Unit), by Country 2024 & 2032
- Figure 13: Asia Pacific Diesel Power Engine Market Revenue Share (%), by Country 2024 & 2032
- Figure 14: Asia Pacific Diesel Power Engine Market Volume Share (%), by Country 2024 & 2032
- Figure 15: South America Diesel Power Engine Market Revenue (Million), by Country 2024 & 2032
- Figure 16: South America Diesel Power Engine Market Volume (K Unit), by Country 2024 & 2032
- Figure 17: South America Diesel Power Engine Market Revenue Share (%), by Country 2024 & 2032
- Figure 18: South America Diesel Power Engine Market Volume Share (%), by Country 2024 & 2032
- Figure 19: Middle East and Africa Diesel Power Engine Market Revenue (Million), by Country 2024 & 2032
- Figure 20: Middle East and Africa Diesel Power Engine Market Volume (K Unit), by Country 2024 & 2032
- Figure 21: Middle East and Africa Diesel Power Engine Market Revenue Share (%), by Country 2024 & 2032
- Figure 22: Middle East and Africa Diesel Power Engine Market Volume Share (%), by Country 2024 & 2032
- Figure 23: North America Diesel Power Engine Market Revenue (Million), by End User 2024 & 2032
- Figure 24: North America Diesel Power Engine Market Volume (K Unit), by End User 2024 & 2032
- Figure 25: North America Diesel Power Engine Market Revenue Share (%), by End User 2024 & 2032
- Figure 26: North America Diesel Power Engine Market Volume Share (%), by End User 2024 & 2032
- Figure 27: North America Diesel Power Engine Market Revenue (Million), by Application 2024 & 2032
- Figure 28: North America Diesel Power Engine Market Volume (K Unit), by Application 2024 & 2032
- Figure 29: North America Diesel Power Engine Market Revenue Share (%), by Application 2024 & 2032
- Figure 30: North America Diesel Power Engine Market Volume Share (%), by Application 2024 & 2032
- Figure 31: North America Diesel Power Engine Market Revenue (Million), by Country 2024 & 2032
- Figure 32: North America Diesel Power Engine Market Volume (K Unit), by Country 2024 & 2032
- Figure 33: North America Diesel Power Engine Market Revenue Share (%), by Country 2024 & 2032
- Figure 34: North America Diesel Power Engine Market Volume Share (%), by Country 2024 & 2032
- Figure 35: Europe Diesel Power Engine Market Revenue (Million), by End User 2024 & 2032
- Figure 36: Europe Diesel Power Engine Market Volume (K Unit), by End User 2024 & 2032
- Figure 37: Europe Diesel Power Engine Market Revenue Share (%), by End User 2024 & 2032
- Figure 38: Europe Diesel Power Engine Market Volume Share (%), by End User 2024 & 2032
- Figure 39: Europe Diesel Power Engine Market Revenue (Million), by Application 2024 & 2032
- Figure 40: Europe Diesel Power Engine Market Volume (K Unit), by Application 2024 & 2032
- Figure 41: Europe Diesel Power Engine Market Revenue Share (%), by Application 2024 & 2032
- Figure 42: Europe Diesel Power Engine Market Volume Share (%), by Application 2024 & 2032
- Figure 43: Europe Diesel Power Engine Market Revenue (Million), by Country 2024 & 2032
- Figure 44: Europe Diesel Power Engine Market Volume (K Unit), by Country 2024 & 2032
- Figure 45: Europe Diesel Power Engine Market Revenue Share (%), by Country 2024 & 2032
- Figure 46: Europe Diesel Power Engine Market Volume Share (%), by Country 2024 & 2032
- Figure 47: Asia Pacific Diesel Power Engine Market Revenue (Million), by End User 2024 & 2032
- Figure 48: Asia Pacific Diesel Power Engine Market Volume (K Unit), by End User 2024 & 2032
- Figure 49: Asia Pacific Diesel Power Engine Market Revenue Share (%), by End User 2024 & 2032
- Figure 50: Asia Pacific Diesel Power Engine Market Volume Share (%), by End User 2024 & 2032
- Figure 51: Asia Pacific Diesel Power Engine Market Revenue (Million), by Application 2024 & 2032
- Figure 52: Asia Pacific Diesel Power Engine Market Volume (K Unit), by Application 2024 & 2032
- Figure 53: Asia Pacific Diesel Power Engine Market Revenue Share (%), by Application 2024 & 2032
- Figure 54: Asia Pacific Diesel Power Engine Market Volume Share (%), by Application 2024 & 2032
- Figure 55: Asia Pacific Diesel Power Engine Market Revenue (Million), by Country 2024 & 2032
- Figure 56: Asia Pacific Diesel Power Engine Market Volume (K Unit), by Country 2024 & 2032
- Figure 57: Asia Pacific Diesel Power Engine Market Revenue Share (%), by Country 2024 & 2032
- Figure 58: Asia Pacific Diesel Power Engine Market Volume Share (%), by Country 2024 & 2032
- Figure 59: South America Diesel Power Engine Market Revenue (Million), by End User 2024 & 2032
- Figure 60: South America Diesel Power Engine Market Volume (K Unit), by End User 2024 & 2032
- Figure 61: South America Diesel Power Engine Market Revenue Share (%), by End User 2024 & 2032
- Figure 62: South America Diesel Power Engine Market Volume Share (%), by End User 2024 & 2032
- Figure 63: South America Diesel Power Engine Market Revenue (Million), by Application 2024 & 2032
- Figure 64: South America Diesel Power Engine Market Volume (K Unit), by Application 2024 & 2032
- Figure 65: South America Diesel Power Engine Market Revenue Share (%), by Application 2024 & 2032
- Figure 66: South America Diesel Power Engine Market Volume Share (%), by Application 2024 & 2032
- Figure 67: South America Diesel Power Engine Market Revenue (Million), by Country 2024 & 2032
- Figure 68: South America Diesel Power Engine Market Volume (K Unit), by Country 2024 & 2032
- Figure 69: South America Diesel Power Engine Market Revenue Share (%), by Country 2024 & 2032
- Figure 70: South America Diesel Power Engine Market Volume Share (%), by Country 2024 & 2032
- Figure 71: Middle East and Africa Diesel Power Engine Market Revenue (Million), by End User 2024 & 2032
- Figure 72: Middle East and Africa Diesel Power Engine Market Volume (K Unit), by End User 2024 & 2032
- Figure 73: Middle East and Africa Diesel Power Engine Market Revenue Share (%), by End User 2024 & 2032
- Figure 74: Middle East and Africa Diesel Power Engine Market Volume Share (%), by End User 2024 & 2032
- Figure 75: Middle East and Africa Diesel Power Engine Market Revenue (Million), by Application 2024 & 2032
- Figure 76: Middle East and Africa Diesel Power Engine Market Volume (K Unit), by Application 2024 & 2032
- Figure 77: Middle East and Africa Diesel Power Engine Market Revenue Share (%), by Application 2024 & 2032
- Figure 78: Middle East and Africa Diesel Power Engine Market Volume Share (%), by Application 2024 & 2032
- Figure 79: Middle East and Africa Diesel Power Engine Market Revenue (Million), by Country 2024 & 2032
- Figure 80: Middle East and Africa Diesel Power Engine Market Volume (K Unit), by Country 2024 & 2032
- Figure 81: Middle East and Africa Diesel Power Engine Market Revenue Share (%), by Country 2024 & 2032
- Figure 82: Middle East and Africa Diesel Power Engine Market Volume Share (%), by Country 2024 & 2032
List of Tables
- Table 1: Global Diesel Power Engine Market Revenue Million Forecast, by Region 2019 & 2032
- Table 2: Global Diesel Power Engine Market Volume K Unit Forecast, by Region 2019 & 2032
- Table 3: Global Diesel Power Engine Market Revenue Million Forecast, by End User 2019 & 2032
- Table 4: Global Diesel Power Engine Market Volume K Unit Forecast, by End User 2019 & 2032
- Table 5: Global Diesel Power Engine Market Revenue Million Forecast, by Application 2019 & 2032
- Table 6: Global Diesel Power Engine Market Volume K Unit Forecast, by Application 2019 & 2032
- Table 7: Global Diesel Power Engine Market Revenue Million Forecast, by Region 2019 & 2032
- Table 8: Global Diesel Power Engine Market Volume K Unit Forecast, by Region 2019 & 2032
- Table 9: Global Diesel Power Engine Market Revenue Million Forecast, by Country 2019 & 2032
- Table 10: Global Diesel Power Engine Market Volume K Unit Forecast, by Country 2019 & 2032
- Table 11: United States Diesel Power Engine Market Revenue (Million) Forecast, by Application 2019 & 2032
- Table 12: United States Diesel Power Engine Market Volume (K Unit) Forecast, by Application 2019 & 2032
- Table 13: Canada Diesel Power Engine Market Revenue (Million) Forecast, by Application 2019 & 2032
- Table 14: Canada Diesel Power Engine Market Volume (K Unit) Forecast, by Application 2019 & 2032
- Table 15: Rest of North America Diesel Power Engine Market Revenue (Million) Forecast, by Application 2019 & 2032
- Table 16: Rest of North America Diesel Power Engine Market Volume (K Unit) Forecast, by Application 2019 & 2032
- Table 17: Global Diesel Power Engine Market Revenue Million Forecast, by Country 2019 & 2032
- Table 18: Global Diesel Power Engine Market Volume K Unit Forecast, by Country 2019 & 2032
- Table 19: United Kingdom Diesel Power Engine Market Revenue (Million) Forecast, by Application 2019 & 2032
- Table 20: United Kingdom Diesel Power Engine Market Volume (K Unit) Forecast, by Application 2019 & 2032
- Table 21: France Diesel Power Engine Market Revenue (Million) Forecast, by Application 2019 & 2032
- Table 22: France Diesel Power Engine Market Volume (K Unit) Forecast, by Application 2019 & 2032
- Table 23: Germany Diesel Power Engine Market Revenue (Million) Forecast, by Application 2019 & 2032
- Table 24: Germany Diesel Power Engine Market Volume (K Unit) Forecast, by Application 2019 & 2032
- Table 25: Spain Diesel Power Engine Market Revenue (Million) Forecast, by Application 2019 & 2032
- Table 26: Spain Diesel Power Engine Market Volume (K Unit) Forecast, by Application 2019 & 2032
- Table 27: Rest of Europe Diesel Power Engine Market Revenue (Million) Forecast, by Application 2019 & 2032
- Table 28: Rest of Europe Diesel Power Engine Market Volume (K Unit) Forecast, by Application 2019 & 2032
- Table 29: Global Diesel Power Engine Market Revenue Million Forecast, by Country 2019 & 2032
- Table 30: Global Diesel Power Engine Market Volume K Unit Forecast, by Country 2019 & 2032
- Table 31: China Diesel Power Engine Market Revenue (Million) Forecast, by Application 2019 & 2032
- Table 32: China Diesel Power Engine Market Volume (K Unit) Forecast, by Application 2019 & 2032
- Table 33: India Diesel Power Engine Market Revenue (Million) Forecast, by Application 2019 & 2032
- Table 34: India Diesel Power Engine Market Volume (K Unit) Forecast, by Application 2019 & 2032
- Table 35: ASEAN Countries Diesel Power Engine Market Revenue (Million) Forecast, by Application 2019 & 2032
- Table 36: ASEAN Countries Diesel Power Engine Market Volume (K Unit) Forecast, by Application 2019 & 2032
- Table 37: Australia Diesel Power Engine Market Revenue (Million) Forecast, by Application 2019 & 2032
- Table 38: Australia Diesel Power Engine Market Volume (K Unit) Forecast, by Application 2019 & 2032
- Table 39: Rest of Asia Pacific Diesel Power Engine Market Revenue (Million) Forecast, by Application 2019 & 2032
- Table 40: Rest of Asia Pacific Diesel Power Engine Market Volume (K Unit) Forecast, by Application 2019 & 2032
- Table 41: Global Diesel Power Engine Market Revenue Million Forecast, by Country 2019 & 2032
- Table 42: Global Diesel Power Engine Market Volume K Unit Forecast, by Country 2019 & 2032
- Table 43: Brazil Diesel Power Engine Market Revenue (Million) Forecast, by Application 2019 & 2032
- Table 44: Brazil Diesel Power Engine Market Volume (K Unit) Forecast, by Application 2019 & 2032
- Table 45: Argentina Diesel Power Engine Market Revenue (Million) Forecast, by Application 2019 & 2032
- Table 46: Argentina Diesel Power Engine Market Volume (K Unit) Forecast, by Application 2019 & 2032
- Table 47: Rest of South America Diesel Power Engine Market Revenue (Million) Forecast, by Application 2019 & 2032
- Table 48: Rest of South America Diesel Power Engine Market Volume (K Unit) Forecast, by Application 2019 & 2032
- Table 49: Global Diesel Power Engine Market Revenue Million Forecast, by Country 2019 & 2032
- Table 50: Global Diesel Power Engine Market Volume K Unit Forecast, by Country 2019 & 2032
- Table 51: Saudi Arabia Diesel Power Engine Market Revenue (Million) Forecast, by Application 2019 & 2032
- Table 52: Saudi Arabia Diesel Power Engine Market Volume (K Unit) Forecast, by Application 2019 & 2032
- Table 53: Nigeria Diesel Power Engine Market Revenue (Million) Forecast, by Application 2019 & 2032
- Table 54: Nigeria Diesel Power Engine Market Volume (K Unit) Forecast, by Application 2019 & 2032
- Table 55: South Africa Diesel Power Engine Market Revenue (Million) Forecast, by Application 2019 & 2032
- Table 56: South Africa Diesel Power Engine Market Volume (K Unit) Forecast, by Application 2019 & 2032
- Table 57: Rest of Middle East and Africa Diesel Power Engine Market Revenue (Million) Forecast, by Application 2019 & 2032
- Table 58: Rest of Middle East and Africa Diesel Power Engine Market Volume (K Unit) Forecast, by Application 2019 & 2032
- Table 59: Global Diesel Power Engine Market Revenue Million Forecast, by End User 2019 & 2032
- Table 60: Global Diesel Power Engine Market Volume K Unit Forecast, by End User 2019 & 2032
- Table 61: Global Diesel Power Engine Market Revenue Million Forecast, by Application 2019 & 2032
- Table 62: Global Diesel Power Engine Market Volume K Unit Forecast, by Application 2019 & 2032
- Table 63: Global Diesel Power Engine Market Revenue Million Forecast, by Country 2019 & 2032
- Table 64: Global Diesel Power Engine Market Volume K Unit Forecast, by Country 2019 & 2032
- Table 65: United States Diesel Power Engine Market Revenue (Million) Forecast, by Application 2019 & 2032
- Table 66: United States Diesel Power Engine Market Volume (K Unit) Forecast, by Application 2019 & 2032
- Table 67: Canada Diesel Power Engine Market Revenue (Million) Forecast, by Application 2019 & 2032
- Table 68: Canada Diesel Power Engine Market Volume (K Unit) Forecast, by Application 2019 & 2032
- Table 69: Rest of North America Diesel Power Engine Market Revenue (Million) Forecast, by Application 2019 & 2032
- Table 70: Rest of North America Diesel Power Engine Market Volume (K Unit) Forecast, by Application 2019 & 2032
- Table 71: Global Diesel Power Engine Market Revenue Million Forecast, by End User 2019 & 2032
- Table 72: Global Diesel Power Engine Market Volume K Unit Forecast, by End User 2019 & 2032
- Table 73: Global Diesel Power Engine Market Revenue Million Forecast, by Application 2019 & 2032
- Table 74: Global Diesel Power Engine Market Volume K Unit Forecast, by Application 2019 & 2032
- Table 75: Global Diesel Power Engine Market Revenue Million Forecast, by Country 2019 & 2032
- Table 76: Global Diesel Power Engine Market Volume K Unit Forecast, by Country 2019 & 2032
- Table 77: United Kingdom Diesel Power Engine Market Revenue (Million) Forecast, by Application 2019 & 2032
- Table 78: United Kingdom Diesel Power Engine Market Volume (K Unit) Forecast, by Application 2019 & 2032
- Table 79: France Diesel Power Engine Market Revenue (Million) Forecast, by Application 2019 & 2032
- Table 80: France Diesel Power Engine Market Volume (K Unit) Forecast, by Application 2019 & 2032
- Table 81: Germany Diesel Power Engine Market Revenue (Million) Forecast, by Application 2019 & 2032
- Table 82: Germany Diesel Power Engine Market Volume (K Unit) Forecast, by Application 2019 & 2032
- Table 83: Spain Diesel Power Engine Market Revenue (Million) Forecast, by Application 2019 & 2032
- Table 84: Spain Diesel Power Engine Market Volume (K Unit) Forecast, by Application 2019 & 2032
- Table 85: Rest of Europe Diesel Power Engine Market Revenue (Million) Forecast, by Application 2019 & 2032
- Table 86: Rest of Europe Diesel Power Engine Market Volume (K Unit) Forecast, by Application 2019 & 2032
- Table 87: Global Diesel Power Engine Market Revenue Million Forecast, by End User 2019 & 2032
- Table 88: Global Diesel Power Engine Market Volume K Unit Forecast, by End User 2019 & 2032
- Table 89: Global Diesel Power Engine Market Revenue Million Forecast, by Application 2019 & 2032
- Table 90: Global Diesel Power Engine Market Volume K Unit Forecast, by Application 2019 & 2032
- Table 91: Global Diesel Power Engine Market Revenue Million Forecast, by Country 2019 & 2032
- Table 92: Global Diesel Power Engine Market Volume K Unit Forecast, by Country 2019 & 2032
- Table 93: China Diesel Power Engine Market Revenue (Million) Forecast, by Application 2019 & 2032
- Table 94: China Diesel Power Engine Market Volume (K Unit) Forecast, by Application 2019 & 2032
- Table 95: India Diesel Power Engine Market Revenue (Million) Forecast, by Application 2019 & 2032
- Table 96: India Diesel Power Engine Market Volume (K Unit) Forecast, by Application 2019 & 2032
- Table 97: ASEAN Countries Diesel Power Engine Market Revenue (Million) Forecast, by Application 2019 & 2032
- Table 98: ASEAN Countries Diesel Power Engine Market Volume (K Unit) Forecast, by Application 2019 & 2032
- Table 99: Australia Diesel Power Engine Market Revenue (Million) Forecast, by Application 2019 & 2032
- Table 100: Australia Diesel Power Engine Market Volume (K Unit) Forecast, by Application 2019 & 2032
- Table 101: Rest of Asia Pacific Diesel Power Engine Market Revenue (Million) Forecast, by Application 2019 & 2032
- Table 102: Rest of Asia Pacific Diesel Power Engine Market Volume (K Unit) Forecast, by Application 2019 & 2032
- Table 103: Global Diesel Power Engine Market Revenue Million Forecast, by End User 2019 & 2032
- Table 104: Global Diesel Power Engine Market Volume K Unit Forecast, by End User 2019 & 2032
- Table 105: Global Diesel Power Engine Market Revenue Million Forecast, by Application 2019 & 2032
- Table 106: Global Diesel Power Engine Market Volume K Unit Forecast, by Application 2019 & 2032
- Table 107: Global Diesel Power Engine Market Revenue Million Forecast, by Country 2019 & 2032
- Table 108: Global Diesel Power Engine Market Volume K Unit Forecast, by Country 2019 & 2032
- Table 109: Brazil Diesel Power Engine Market Revenue (Million) Forecast, by Application 2019 & 2032
- Table 110: Brazil Diesel Power Engine Market Volume (K Unit) Forecast, by Application 2019 & 2032
- Table 111: Argentina Diesel Power Engine Market Revenue (Million) Forecast, by Application 2019 & 2032
- Table 112: Argentina Diesel Power Engine Market Volume (K Unit) Forecast, by Application 2019 & 2032
- Table 113: Rest of South America Diesel Power Engine Market Revenue (Million) Forecast, by Application 2019 & 2032
- Table 114: Rest of South America Diesel Power Engine Market Volume (K Unit) Forecast, by Application 2019 & 2032
- Table 115: Global Diesel Power Engine Market Revenue Million Forecast, by End User 2019 & 2032
- Table 116: Global Diesel Power Engine Market Volume K Unit Forecast, by End User 2019 & 2032
- Table 117: Global Diesel Power Engine Market Revenue Million Forecast, by Application 2019 & 2032
- Table 118: Global Diesel Power Engine Market Volume K Unit Forecast, by Application 2019 & 2032
- Table 119: Global Diesel Power Engine Market Revenue Million Forecast, by Country 2019 & 2032
- Table 120: Global Diesel Power Engine Market Volume K Unit Forecast, by Country 2019 & 2032
- Table 121: Saudi Arabia Diesel Power Engine Market Revenue (Million) Forecast, by Application 2019 & 2032
- Table 122: Saudi Arabia Diesel Power Engine Market Volume (K Unit) Forecast, by Application 2019 & 2032
- Table 123: Nigeria Diesel Power Engine Market Revenue (Million) Forecast, by Application 2019 & 2032
- Table 124: Nigeria Diesel Power Engine Market Volume (K Unit) Forecast, by Application 2019 & 2032
- Table 125: South Africa Diesel Power Engine Market Revenue (Million) Forecast, by Application 2019 & 2032
- Table 126: South Africa Diesel Power Engine Market Volume (K Unit) Forecast, by Application 2019 & 2032
- Table 127: Rest of Middle East and Africa Diesel Power Engine Market Revenue (Million) Forecast, by Application 2019 & 2032
- Table 128: Rest of Middle East and Africa Diesel Power Engine Market Volume (K Unit) Forecast, by Application 2019 & 2032
Frequently Asked Questions
1. What is the projected Compound Annual Growth Rate (CAGR) of the Diesel Power Engine Market?
The projected CAGR is approximately 6.39%.
2. Which companies are prominent players in the Diesel Power Engine Market?
Key companies in the market include YANMAR HOLDINGS Co Ltd *List Not Exhaustive 6 4 Market Ranking/Share (%) Analysi, Kohler Co, Hyundai Heavy Industries Co Ltd, Caterpillar Inc, Wartsila Oyj Abp, Cummins Inc, Volvo AB, Man SE, Mitsubishi Heavy Industries Ltd, Rolls-Royce Holding PLC.
3. What are the main segments of the Diesel Power Engine Market?
The market segments include End User, Application.
4. Can you provide details about the market size?
The market size is estimated to be USD 11.55 Million as of 2022.
5. What are some drivers contributing to market growth?
4.; Increasing Demand From Industrial Sector4.; Rising Power Outages To Increase The Demand For Diesel Generators.
6. What are the notable trends driving market growth?
The Industrial Segment to Dominate the Market.
7. Are there any restraints impacting market growth?
4.; Increasing Shift Toward Cleaner Energy Resources.
8. Can you provide examples of recent developments in the market?
October 2023: Mitsubishi Heavy Industries Engine & Turbocharger Ltd (MHIET), a part of Mitsubishi Heavy Industries (MHI) Group, approved the use of unblended Hydrotreated Vegetable Oil (HVO) that complies with EN15940 and blends with diesel fuel. Approved engine series include SM, SD, SB, SA, SH, SR, and SU series for all applications, including power systems and marine.
9. What pricing options are available for accessing the report?
Pricing options include single-user, multi-user, and enterprise licenses priced at USD 4750, USD 5250, and USD 8750 respectively.
10. Is the market size provided in terms of value or volume?
The market size is provided in terms of value, measured in Million and volume, measured in K Unit.
11. Are there any specific market keywords associated with the report?
Yes, the market keyword associated with the report is "Diesel Power Engine Market," which aids in identifying and referencing the specific market segment covered.
12. How do I determine which pricing option suits my needs best?
The pricing options vary based on user requirements and access needs. Individual users may opt for single-user licenses, while businesses requiring broader access may choose multi-user or enterprise licenses for cost-effective access to the report.
13. Are there any additional resources or data provided in the Diesel Power Engine Market report?
While the report offers comprehensive insights, it's advisable to review the specific contents or supplementary materials provided to ascertain if additional resources or data are available.
14. How can I stay updated on further developments or reports in the Diesel Power Engine Market?
To stay informed about further developments, trends, and reports in the Diesel Power Engine Market, consider subscribing to industry newsletters, following relevant companies and organizations, or regularly checking reputable industry news sources and publications.
Methodology
Step 1 - Identification of Relevant Samples Size from Population Database


Step 2 - Approaches for Defining Global Market Size (Value, Volume* & Price*)

Note*: In applicable scenarios
Step 3 - Data Sources
Primary Research
- Web Analytics
- Survey Reports
- Research Institute
- Latest Research Reports
- Opinion Leaders
Secondary Research
- Annual Reports
- White Paper
- Latest Press Release
- Industry Association
- Paid Database
- Investor Presentations

Step 4 - Data Triangulation
Involves using different sources of information in order to increase the validity of a study
These sources are likely to be stakeholders in a program - participants, other researchers, program staff, other community members, and so on.
Then we put all data in single framework & apply various statistical tools to find out the dynamic on the market.
During the analysis stage, feedback from the stakeholder groups would be compared to determine areas of agreement as well as areas of divergence


