

Key Insights
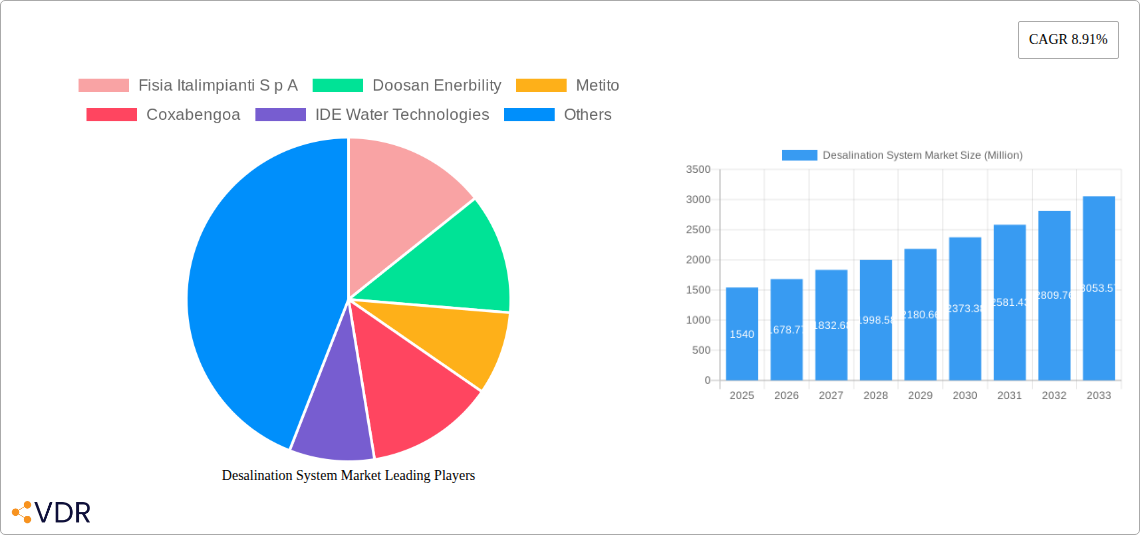
The global desalination system market is experiencing robust growth, projected to reach a substantial size driven by increasing water scarcity, particularly in arid and semi-arid regions. The market's Compound Annual Growth Rate (CAGR) of 8.91% from 2019 to 2024 indicates a significant upward trajectory, expected to continue throughout the forecast period (2025-2033). This expansion is fueled by several key drivers: rising industrial water demand, particularly in sectors like energy and manufacturing; growing urbanization and population growth in water-stressed areas; and the increasing adoption of stringent water regulations and policies promoting water conservation and reuse. Technological advancements in desalination techniques, such as improved membrane technologies and energy-efficient thermal processes (like Vapor Compression Distillation), are further accelerating market growth. Significant investments in desalination infrastructure projects, particularly in regions like the Middle East and North America, are also contributing factors.
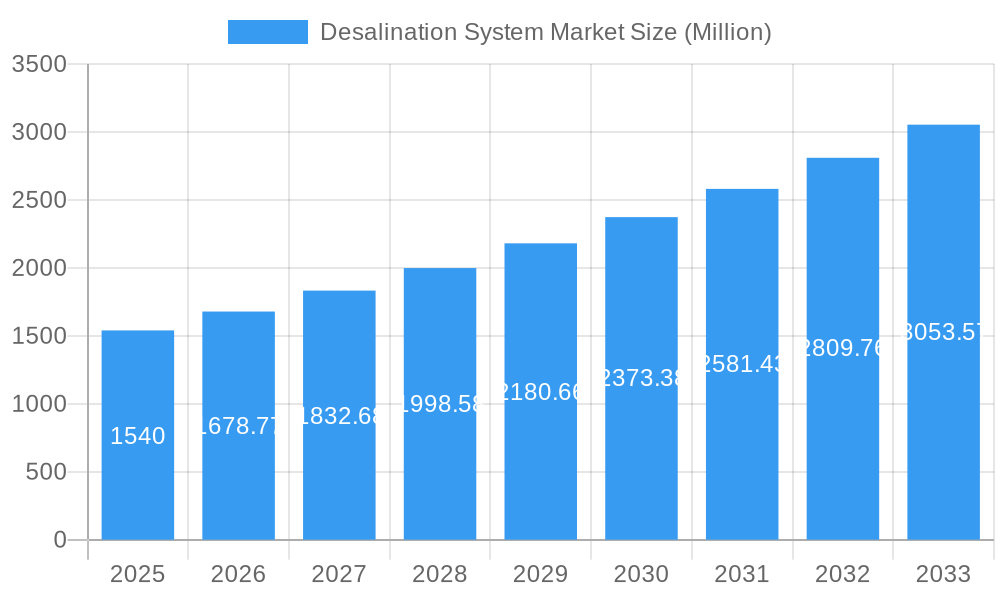
Desalination System Market Market Size (In Billion)
The market is segmented by technology (Vapor Compression Distillation, Membrane Technology, and Thermal Technology), application (Municipal and Industrial), and geography. While membrane technology currently dominates due to its lower energy consumption and operational costs, thermal technologies, including Vapor Compression Distillation, remain relevant for large-scale applications. The industrial sector is a significant revenue contributor owing to its high water demands, while the municipal sector exhibits steady growth due to increased government initiatives to improve water security. Geographically, the Middle East and North Africa (MEA) region currently holds a considerable market share, driven by high water scarcity and extensive investment in desalination projects. However, North America and Asia-Pacific are also demonstrating strong growth potential due to increasing water stress and rising industrial activity. Market restraints include high capital costs associated with desalination plant construction and operation, environmental concerns related to brine discharge, and energy consumption, particularly for thermal-based systems. However, ongoing technological improvements and advancements in energy efficiency are progressively mitigating these concerns.
Desalination System Market Company Market Share
Desalination System Market: A Comprehensive Report (2019-2033)
This comprehensive report provides a detailed analysis of the Desalination System Market, encompassing market dynamics, growth trends, regional dominance, product landscape, key players, and future outlook. The study period covers 2019-2033, with 2025 as the base year and a forecast period extending to 2033. The report segments the market by technology (Vapor Compression Distillation, Membrane Technology, Thermal Technology), application (Municipal, Industrial), and geographic regions, providing granular insights into this vital industry. The total market size is predicted to reach xx Million units by 2033.
Desalination System Market Dynamics & Structure
The global desalination system market is characterized by a moderately concentrated landscape with several key players holding significant market share. Market concentration is further analyzed in the full report, with specific market share percentages assigned to key players. Technological innovation, particularly in membrane technology and energy efficiency, is a major growth driver. Stringent regulatory frameworks concerning water quality and environmental impact are shaping industry practices. The market also faces competition from alternative water sources and technologies. End-user demographics, particularly in water-stressed regions, are a key determinant of market demand. The report delves into recent mergers and acquisitions (M&A) activity, quantifying deal volumes and analyzing their impact on market consolidation.
- Market Concentration: Moderately concentrated, with top 5 players holding xx% of market share (2024).
- Technological Innovation: Focus on energy-efficient RO and improved membrane technologies.
- Regulatory Landscape: Stringent environmental regulations and water quality standards.
- Competitive Substitutes: Water reuse, rainwater harvesting, and improved water management practices.
- End-User Demographics: Rapidly growing population in water-scarce regions drives demand.
- M&A Activity: xx M&A deals recorded between 2019-2024, indicating consolidation trends.
Desalination System Market Growth Trends & Insights
The desalination system market has experienced substantial growth over the historical period (2019-2024), driven by increasing water scarcity and rising demand from various sectors. The market size is projected to grow at a Compound Annual Growth Rate (CAGR) of xx% during the forecast period (2025-2033), reaching an estimated xx Million units by 2033. Technological advancements, such as the adoption of reverse osmosis (RO) and improved energy-efficient desalination technologies, are accelerating market penetration. Shifting consumer behavior towards greater water conservation awareness also contributes to market expansion. The report analyzes these trends in detail, providing specific data on market penetration rates and adoption across different regions and applications.
Dominant Regions, Countries, or Segments in Desalination System Market
The Middle East and North Africa (MENA) region currently dominates the global desalination system market, driven by high water scarcity and significant investments in desalination infrastructure. Other regions such as North America, Europe, and Asia-Pacific are also experiencing considerable growth, albeit at different paces. Within the market segmentation, the Membrane Technology segment holds the largest share, followed by Thermal Technology. The Municipal application segment demonstrates higher growth potential compared to the Industrial segment.
- Key Drivers (MENA): High water stress, government investments in infrastructure, supportive economic policies.
- Dominance Factors: High water scarcity, significant government funding, large-scale projects.
- Growth Potential (Asia-Pacific): Rising population, industrialization, and increasing water demand.
- Market Share (Membrane Technology): xx% in 2024, projected to reach xx% by 2033.
Desalination System Market Product Landscape
The desalination system market offers a range of products, including reverse osmosis (RO) systems, multi-stage flash (MSF) distillation systems, and multi-effect distillation (MED) systems. Recent innovations focus on energy efficiency, reduced footprint, and improved water quality. Many systems incorporate advanced features such as energy recovery devices and pre-treatment technologies to optimize performance and reduce operational costs. Unique selling propositions often center on energy efficiency, sustainability, and ease of operation.
Key Drivers, Barriers & Challenges in Desalination System Market
Key Drivers:
- Increasing water scarcity worldwide.
- Growing industrial and municipal water demands.
- Technological advancements leading to improved efficiency and cost reduction.
- Government initiatives and supportive policies promoting desalination.
Key Challenges & Restraints:
- High capital costs associated with desalination plant construction.
- Energy consumption and environmental impact of desalination processes.
- Supply chain disruptions affecting the availability of critical components.
- Regulatory hurdles and permitting complexities in some regions. These hurdles can delay project implementation by an average of xx months.
Emerging Opportunities in Desalination System Market
- Expansion into untapped markets with high water stress.
- Development of smaller, decentralized desalination units for remote areas.
- Integration of renewable energy sources to reduce reliance on fossil fuels.
- Exploration of innovative applications, such as desalination for agricultural purposes.
Growth Accelerators in the Desalination System Market Industry
Technological advancements, particularly in membrane technology and energy recovery, are key catalysts for long-term growth. Strategic partnerships between technology providers, engineering firms, and water utilities are accelerating project development. Government support and funding for desalination projects, coupled with increasing public awareness of water scarcity, will continue driving market expansion.
Key Players Shaping the Desalination System Market Market
- Fisia Italimpianti S p A
- Doosan Enerbility
- Metito
- Coxabengoa
- IDE Water Technologies
- Dupont
- Evoqua Water Technologies LLC
- Aquatech International LLC
- ACCIONA
- Biwater Holdings Limited
- Veolia
- Ocean Oasis
- List Not Exhaustive
Notable Milestones in Desalination System Market Sector
- April 2022: Veolia Water Technologies launched the Barrel, an integrated plug-and-play reverse osmosis (RO) technology in the Asia-Pacific region. This launch expands market access and caters to growing demand for efficient desalination solutions.
- August 2022: Doosan Enerbility secured a USD 633 billion contract to build the Shuaibah 3 seawater desalination plant in Saudi Arabia. This substantial project highlights the significant investments in large-scale desalination projects in water-stressed regions.
In-Depth Desalination System Market Market Outlook
The future of the desalination system market is bright, driven by persistent water scarcity and ongoing technological advancements. The market is poised for continued growth, with significant opportunities in emerging economies and regions experiencing rapid industrialization. Strategic investments in research and development, coupled with innovative business models, will be crucial for success in this dynamic market. The long-term outlook points towards increasing adoption of energy-efficient and sustainable desalination technologies, contributing to a more resilient and water-secure future.
Desalination System Market Segmentation
-
1. Technology of Separation
-
1.1. Thermal Technology
- 1.1.1. Multi-stage Flash Distillation (MSF)
- 1.1.2. Multi-effect Distillation (MED)
- 1.1.3. Vapor Compression Distillation
-
1.2. Membrane Technology
- 1.2.1. Electrodialysis (ED)
- 1.2.2. Electrodialysis Reversal (EDR)
- 1.2.3. Reverse Osmosis (RO)
- 1.2.4. Other Membrane Technologies
-
1.1. Thermal Technology
-
2. Application
- 2.1. Municipal
- 2.2. Industrial
Desalination System Market Segmentation By Geography
-
1. Asia Pacific
- 1.1. China
- 1.2. India
- 1.3. Japan
- 1.4. Rest of Asia Pacific
-
2. North America
- 2.1. United States
- 2.2. Mexico
-
3. Europe
- 3.1. Germany
- 3.2. United Kingdom
- 3.3. Spain
- 3.4. Rest of Europe
-
4. South America
- 4.1. Brazil
- 4.2. Chile
- 4.3. Rest of South America
-
5. Middle East and Africa
- 5.1. Saudi Arabia
- 5.2. Algeria
- 5.3. United Arab Emirates
- 5.4. Egypt
- 5.5. Rest of Middle East and Africa
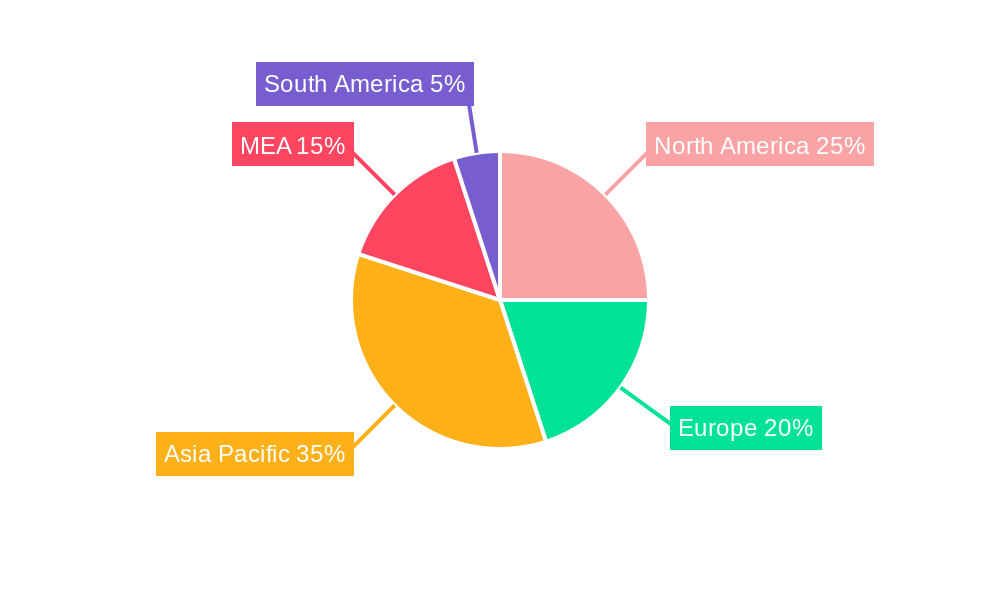
Desalination System Market Regional Market Share
Geographic Coverage of Desalination System Market
Desalination System Market REPORT HIGHLIGHTS
| Aspects | Details |
|---|---|
| Study Period | 2020-2034 |
| Base Year | 2025 |
| Estimated Year | 2026 |
| Forecast Period | 2026-2034 |
| Historical Period | 2020-2025 |
| Growth Rate | CAGR of 8.91% from 2020-2034 |
| Segmentation |
|
Table of Contents
- 1. Introduction
- 1.1. Research Scope
- 1.2. Market Segmentation
- 1.3. Research Objective
- 1.4. Definitions and Assumptions
- 2. Executive Summary
- 2.1. Market Snapshot
- 3. Market Dynamics
- 3.1. Market Drivers
- 3.2. Market Restrains
- 3.3. Market Trends
- 3.4. Market Opportunities
- 4. Market Factor Analysis
- 4.1. Porters Five Forces
- 4.1.1. Bargaining Power of Suppliers
- 4.1.2. Bargaining Power of Buyers
- 4.1.3. Threat of New Entrants
- 4.1.4. Threat of Substitutes
- 4.1.5. Competitive Rivalry
- 4.2. PESTEL analysis
- 4.3. BCG Analysis
- 4.3.1. Stars (High Growth, High Market Share)
- 4.3.2. Cash Cows (Low Growth, High Market Share)
- 4.3.3. Question Mark (High Growth, Low Market Share)
- 4.3.4. Dogs (Low Growth, Low Market Share)
- 4.4. Ansoff Matrix Analysis
- 4.5. Supply Chain Analysis
- 4.6. Regulatory Landscape
- 4.7. Current Market Potential and Opportunity Assessment (TAM–SAM–SOM Framework)
- 4.8. VDR Analyst Note
- 4.1. Porters Five Forces
- 5. Market Analysis, Insights and Forecast 2021-2033
- 5.1. Market Analysis, Insights and Forecast - by Technology of Separation
- 5.1.1. Thermal Technology
- 5.1.1.1. Multi-stage Flash Distillation (MSF)
- 5.1.1.2. Multi-effect Distillation (MED)
- 5.1.1.3. Vapor Compression Distillation
- 5.1.2. Membrane Technology
- 5.1.2.1. Electrodialysis (ED)
- 5.1.2.2. Electrodialysis Reversal (EDR)
- 5.1.2.3. Reverse Osmosis (RO)
- 5.1.2.4. Other Membrane Technologies
- 5.1.1. Thermal Technology
- 5.2. Market Analysis, Insights and Forecast - by Application
- 5.2.1. Municipal
- 5.2.2. Industrial
- 5.3. Market Analysis, Insights and Forecast - by Region
- 5.3.1. Asia Pacific
- 5.3.2. North America
- 5.3.3. Europe
- 5.3.4. South America
- 5.3.5. Middle East and Africa
- 5.1. Market Analysis, Insights and Forecast - by Technology of Separation
- 6. Global Desalination System Market Analysis, Insights and Forecast, 2021-2033
- 6.1. Market Analysis, Insights and Forecast - by Technology of Separation
- 6.1.1. Thermal Technology
- 6.1.1.1. Multi-stage Flash Distillation (MSF)
- 6.1.1.2. Multi-effect Distillation (MED)
- 6.1.1.3. Vapor Compression Distillation
- 6.1.2. Membrane Technology
- 6.1.2.1. Electrodialysis (ED)
- 6.1.2.2. Electrodialysis Reversal (EDR)
- 6.1.2.3. Reverse Osmosis (RO)
- 6.1.2.4. Other Membrane Technologies
- 6.1.1. Thermal Technology
- 6.2. Market Analysis, Insights and Forecast - by Application
- 6.2.1. Municipal
- 6.2.2. Industrial
- 6.1. Market Analysis, Insights and Forecast - by Technology of Separation
- 7. Asia Pacific Desalination System Market Analysis, Insights and Forecast, 2021-2033
- 7.1. Market Analysis, Insights and Forecast - by Technology of Separation
- 7.1.1. Thermal Technology
- 7.1.1.1. Multi-stage Flash Distillation (MSF)
- 7.1.1.2. Multi-effect Distillation (MED)
- 7.1.1.3. Vapor Compression Distillation
- 7.1.2. Membrane Technology
- 7.1.2.1. Electrodialysis (ED)
- 7.1.2.2. Electrodialysis Reversal (EDR)
- 7.1.2.3. Reverse Osmosis (RO)
- 7.1.2.4. Other Membrane Technologies
- 7.1.1. Thermal Technology
- 7.2. Market Analysis, Insights and Forecast - by Application
- 7.2.1. Municipal
- 7.2.2. Industrial
- 7.1. Market Analysis, Insights and Forecast - by Technology of Separation
- 8. North America Desalination System Market Analysis, Insights and Forecast, 2021-2033
- 8.1. Market Analysis, Insights and Forecast - by Technology of Separation
- 8.1.1. Thermal Technology
- 8.1.1.1. Multi-stage Flash Distillation (MSF)
- 8.1.1.2. Multi-effect Distillation (MED)
- 8.1.1.3. Vapor Compression Distillation
- 8.1.2. Membrane Technology
- 8.1.2.1. Electrodialysis (ED)
- 8.1.2.2. Electrodialysis Reversal (EDR)
- 8.1.2.3. Reverse Osmosis (RO)
- 8.1.2.4. Other Membrane Technologies
- 8.1.1. Thermal Technology
- 8.2. Market Analysis, Insights and Forecast - by Application
- 8.2.1. Municipal
- 8.2.2. Industrial
- 8.1. Market Analysis, Insights and Forecast - by Technology of Separation
- 9. Europe Desalination System Market Analysis, Insights and Forecast, 2021-2033
- 9.1. Market Analysis, Insights and Forecast - by Technology of Separation
- 9.1.1. Thermal Technology
- 9.1.1.1. Multi-stage Flash Distillation (MSF)
- 9.1.1.2. Multi-effect Distillation (MED)
- 9.1.1.3. Vapor Compression Distillation
- 9.1.2. Membrane Technology
- 9.1.2.1. Electrodialysis (ED)
- 9.1.2.2. Electrodialysis Reversal (EDR)
- 9.1.2.3. Reverse Osmosis (RO)
- 9.1.2.4. Other Membrane Technologies
- 9.1.1. Thermal Technology
- 9.2. Market Analysis, Insights and Forecast - by Application
- 9.2.1. Municipal
- 9.2.2. Industrial
- 9.1. Market Analysis, Insights and Forecast - by Technology of Separation
- 10. South America Desalination System Market Analysis, Insights and Forecast, 2021-2033
- 10.1. Market Analysis, Insights and Forecast - by Technology of Separation
- 10.1.1. Thermal Technology
- 10.1.1.1. Multi-stage Flash Distillation (MSF)
- 10.1.1.2. Multi-effect Distillation (MED)
- 10.1.1.3. Vapor Compression Distillation
- 10.1.2. Membrane Technology
- 10.1.2.1. Electrodialysis (ED)
- 10.1.2.2. Electrodialysis Reversal (EDR)
- 10.1.2.3. Reverse Osmosis (RO)
- 10.1.2.4. Other Membrane Technologies
- 10.1.1. Thermal Technology
- 10.2. Market Analysis, Insights and Forecast - by Application
- 10.2.1. Municipal
- 10.2.2. Industrial
- 10.1. Market Analysis, Insights and Forecast - by Technology of Separation
- 11. Middle East and Africa Desalination System Market Analysis, Insights and Forecast, 2021-2033
- 11.1. Market Analysis, Insights and Forecast - by Technology of Separation
- 11.1.1. Thermal Technology
- 11.1.1.1. Multi-stage Flash Distillation (MSF)
- 11.1.1.2. Multi-effect Distillation (MED)
- 11.1.1.3. Vapor Compression Distillation
- 11.1.2. Membrane Technology
- 11.1.2.1. Electrodialysis (ED)
- 11.1.2.2. Electrodialysis Reversal (EDR)
- 11.1.2.3. Reverse Osmosis (RO)
- 11.1.2.4. Other Membrane Technologies
- 11.1.1. Thermal Technology
- 11.2. Market Analysis, Insights and Forecast - by Application
- 11.2.1. Municipal
- 11.2.2. Industrial
- 11.1. Market Analysis, Insights and Forecast - by Technology of Separation
- 12. Competitive Analysis
- 12.1. Company Profiles
- 12.1.1 Fisia Italimpianti S p A
- 12.1.1.1. Company Overview
- 12.1.1.2. Products
- 12.1.1.3. Company Financials
- 12.1.1.4. SWOT Analysis
- 12.1.2 Doosan Enerbility
- 12.1.2.1. Company Overview
- 12.1.2.2. Products
- 12.1.2.3. Company Financials
- 12.1.2.4. SWOT Analysis
- 12.1.3 Metito
- 12.1.3.1. Company Overview
- 12.1.3.2. Products
- 12.1.3.3. Company Financials
- 12.1.3.4. SWOT Analysis
- 12.1.4 Coxabengoa
- 12.1.4.1. Company Overview
- 12.1.4.2. Products
- 12.1.4.3. Company Financials
- 12.1.4.4. SWOT Analysis
- 12.1.5 IDE Water Technologies
- 12.1.5.1. Company Overview
- 12.1.5.2. Products
- 12.1.5.3. Company Financials
- 12.1.5.4. SWOT Analysis
- 12.1.6 Dupont
- 12.1.6.1. Company Overview
- 12.1.6.2. Products
- 12.1.6.3. Company Financials
- 12.1.6.4. SWOT Analysis
- 12.1.7 Evoqua Water Technologies LLC
- 12.1.7.1. Company Overview
- 12.1.7.2. Products
- 12.1.7.3. Company Financials
- 12.1.7.4. SWOT Analysis
- 12.1.8 Aquatech International LLC
- 12.1.8.1. Company Overview
- 12.1.8.2. Products
- 12.1.8.3. Company Financials
- 12.1.8.4. SWOT Analysis
- 12.1.9 ACCIONA
- 12.1.9.1. Company Overview
- 12.1.9.2. Products
- 12.1.9.3. Company Financials
- 12.1.9.4. SWOT Analysis
- 12.1.10 Biwater Holdings Limited
- 12.1.10.1. Company Overview
- 12.1.10.2. Products
- 12.1.10.3. Company Financials
- 12.1.10.4. SWOT Analysis
- 12.1.11 Veolia*List Not Exhaustive
- 12.1.11.1. Company Overview
- 12.1.11.2. Products
- 12.1.11.3. Company Financials
- 12.1.11.4. SWOT Analysis
- 12.1.12 Ocean Oasis
- 12.1.12.1. Company Overview
- 12.1.12.2. Products
- 12.1.12.3. Company Financials
- 12.1.12.4. SWOT Analysis
- 12.1.1 Fisia Italimpianti S p A
- 12.2. Market Entropy
- 12.2.1 Company's Key Areas Served
- 12.2.2 Recent Developments
- 12.3. Company Market Share Analysis 2025
- 12.3.1 Top 5 Companies Market Share Analysis
- 12.3.2 Top 3 Companies Market Share Analysis
- 12.4. List of Potential Customers
- 13. Research Methodology
List of Figures
- Figure 1: Global Desalination System Market Revenue Breakdown (Million, %) by Region 2025 & 2033
- Figure 2: Asia Pacific Desalination System Market Revenue (Million), by Technology of Separation 2025 & 2033
- Figure 3: Asia Pacific Desalination System Market Revenue Share (%), by Technology of Separation 2025 & 2033
- Figure 4: Asia Pacific Desalination System Market Revenue (Million), by Application 2025 & 2033
- Figure 5: Asia Pacific Desalination System Market Revenue Share (%), by Application 2025 & 2033
- Figure 6: Asia Pacific Desalination System Market Revenue (Million), by Country 2025 & 2033
- Figure 7: Asia Pacific Desalination System Market Revenue Share (%), by Country 2025 & 2033
- Figure 8: North America Desalination System Market Revenue (Million), by Technology of Separation 2025 & 2033
- Figure 9: North America Desalination System Market Revenue Share (%), by Technology of Separation 2025 & 2033
- Figure 10: North America Desalination System Market Revenue (Million), by Application 2025 & 2033
- Figure 11: North America Desalination System Market Revenue Share (%), by Application 2025 & 2033
- Figure 12: North America Desalination System Market Revenue (Million), by Country 2025 & 2033
- Figure 13: North America Desalination System Market Revenue Share (%), by Country 2025 & 2033
- Figure 14: Europe Desalination System Market Revenue (Million), by Technology of Separation 2025 & 2033
- Figure 15: Europe Desalination System Market Revenue Share (%), by Technology of Separation 2025 & 2033
- Figure 16: Europe Desalination System Market Revenue (Million), by Application 2025 & 2033
- Figure 17: Europe Desalination System Market Revenue Share (%), by Application 2025 & 2033
- Figure 18: Europe Desalination System Market Revenue (Million), by Country 2025 & 2033
- Figure 19: Europe Desalination System Market Revenue Share (%), by Country 2025 & 2033
- Figure 20: South America Desalination System Market Revenue (Million), by Technology of Separation 2025 & 2033
- Figure 21: South America Desalination System Market Revenue Share (%), by Technology of Separation 2025 & 2033
- Figure 22: South America Desalination System Market Revenue (Million), by Application 2025 & 2033
- Figure 23: South America Desalination System Market Revenue Share (%), by Application 2025 & 2033
- Figure 24: South America Desalination System Market Revenue (Million), by Country 2025 & 2033
- Figure 25: South America Desalination System Market Revenue Share (%), by Country 2025 & 2033
- Figure 26: Middle East and Africa Desalination System Market Revenue (Million), by Technology of Separation 2025 & 2033
- Figure 27: Middle East and Africa Desalination System Market Revenue Share (%), by Technology of Separation 2025 & 2033
- Figure 28: Middle East and Africa Desalination System Market Revenue (Million), by Application 2025 & 2033
- Figure 29: Middle East and Africa Desalination System Market Revenue Share (%), by Application 2025 & 2033
- Figure 30: Middle East and Africa Desalination System Market Revenue (Million), by Country 2025 & 2033
- Figure 31: Middle East and Africa Desalination System Market Revenue Share (%), by Country 2025 & 2033
List of Tables
- Table 1: Global Desalination System Market Revenue Million Forecast, by Technology of Separation 2020 & 2033
- Table 2: Global Desalination System Market Revenue Million Forecast, by Application 2020 & 2033
- Table 3: Global Desalination System Market Revenue Million Forecast, by Region 2020 & 2033
- Table 4: Global Desalination System Market Revenue Million Forecast, by Technology of Separation 2020 & 2033
- Table 5: Global Desalination System Market Revenue Million Forecast, by Application 2020 & 2033
- Table 6: Global Desalination System Market Revenue Million Forecast, by Country 2020 & 2033
- Table 7: China Desalination System Market Revenue (Million) Forecast, by Application 2020 & 2033
- Table 8: India Desalination System Market Revenue (Million) Forecast, by Application 2020 & 2033
- Table 9: Japan Desalination System Market Revenue (Million) Forecast, by Application 2020 & 2033
- Table 10: Rest of Asia Pacific Desalination System Market Revenue (Million) Forecast, by Application 2020 & 2033
- Table 11: Global Desalination System Market Revenue Million Forecast, by Technology of Separation 2020 & 2033
- Table 12: Global Desalination System Market Revenue Million Forecast, by Application 2020 & 2033
- Table 13: Global Desalination System Market Revenue Million Forecast, by Country 2020 & 2033
- Table 14: United States Desalination System Market Revenue (Million) Forecast, by Application 2020 & 2033
- Table 15: Mexico Desalination System Market Revenue (Million) Forecast, by Application 2020 & 2033
- Table 16: Global Desalination System Market Revenue Million Forecast, by Technology of Separation 2020 & 2033
- Table 17: Global Desalination System Market Revenue Million Forecast, by Application 2020 & 2033
- Table 18: Global Desalination System Market Revenue Million Forecast, by Country 2020 & 2033
- Table 19: Germany Desalination System Market Revenue (Million) Forecast, by Application 2020 & 2033
- Table 20: United Kingdom Desalination System Market Revenue (Million) Forecast, by Application 2020 & 2033
- Table 21: Spain Desalination System Market Revenue (Million) Forecast, by Application 2020 & 2033
- Table 22: Rest of Europe Desalination System Market Revenue (Million) Forecast, by Application 2020 & 2033
- Table 23: Global Desalination System Market Revenue Million Forecast, by Technology of Separation 2020 & 2033
- Table 24: Global Desalination System Market Revenue Million Forecast, by Application 2020 & 2033
- Table 25: Global Desalination System Market Revenue Million Forecast, by Country 2020 & 2033
- Table 26: Brazil Desalination System Market Revenue (Million) Forecast, by Application 2020 & 2033
- Table 27: Chile Desalination System Market Revenue (Million) Forecast, by Application 2020 & 2033
- Table 28: Rest of South America Desalination System Market Revenue (Million) Forecast, by Application 2020 & 2033
- Table 29: Global Desalination System Market Revenue Million Forecast, by Technology of Separation 2020 & 2033
- Table 30: Global Desalination System Market Revenue Million Forecast, by Application 2020 & 2033
- Table 31: Global Desalination System Market Revenue Million Forecast, by Country 2020 & 2033
- Table 32: Saudi Arabia Desalination System Market Revenue (Million) Forecast, by Application 2020 & 2033
- Table 33: Algeria Desalination System Market Revenue (Million) Forecast, by Application 2020 & 2033
- Table 34: United Arab Emirates Desalination System Market Revenue (Million) Forecast, by Application 2020 & 2033
- Table 35: Egypt Desalination System Market Revenue (Million) Forecast, by Application 2020 & 2033
- Table 36: Rest of Middle East and Africa Desalination System Market Revenue (Million) Forecast, by Application 2020 & 2033
Frequently Asked Questions
1. What is the projected Compound Annual Growth Rate (CAGR) of the Desalination System Market?
The projected CAGR is approximately 8.91%.
2. Which companies are prominent players in the Desalination System Market?
Key companies in the market include Fisia Italimpianti S p A, Doosan Enerbility, Metito, Coxabengoa, IDE Water Technologies, Dupont, Evoqua Water Technologies LLC, Aquatech International LLC, ACCIONA, Biwater Holdings Limited, Veolia*List Not Exhaustive, Ocean Oasis.
3. What are the main segments of the Desalination System Market?
The market segments include Technology of Separation, Application.
4. Can you provide details about the market size?
The market size is estimated to be USD 1.54 Million as of 2022.
5. What are some drivers contributing to market growth?
Increasing Demand from Middle East and North Africa; Growing Demand of Desalinated Water for Industrial Purposes.
6. What are the notable trends driving market growth?
Municipal Application to Dominate the Market.
7. Are there any restraints impacting market growth?
RO Membrane Fouling; Environmental Repercussions of Desalination.
8. Can you provide examples of recent developments in the market?
April 2022: Veolia Water Technologies, a subsidiary of the Veolia group and leading specialist in water treatment announced the Asia-Pacific launch of the Barrel, an integrated plug-and-play reverse osmosis (RO) technology. The Barrel produces fresh water that complies with all water quality regulations while meeting the demands and expectations of the desalination market.
9. What pricing options are available for accessing the report?
Pricing options include single-user, multi-user, and enterprise licenses priced at USD 4750, USD 5250, and USD 8750 respectively.
10. Is the market size provided in terms of value or volume?
The market size is provided in terms of value, measured in Million.
11. Are there any specific market keywords associated with the report?
Yes, the market keyword associated with the report is "Desalination System Market," which aids in identifying and referencing the specific market segment covered.
12. How do I determine which pricing option suits my needs best?
The pricing options vary based on user requirements and access needs. Individual users may opt for single-user licenses, while businesses requiring broader access may choose multi-user or enterprise licenses for cost-effective access to the report.
13. Are there any additional resources or data provided in the Desalination System Market report?
While the report offers comprehensive insights, it's advisable to review the specific contents or supplementary materials provided to ascertain if additional resources or data are available.
14. How can I stay updated on further developments or reports in the Desalination System Market?
To stay informed about further developments, trends, and reports in the Desalination System Market, consider subscribing to industry newsletters, following relevant companies and organizations, or regularly checking reputable industry news sources and publications.
Methodology
Step 1 - Identification of Relevant Samples Size from Population Database


Step 2 - Approaches for Defining Global Market Size (Value, Volume* & Price*)

Note*: In applicable scenarios
Step 3 - Data Sources
Primary Research
- Web Analytics
- Survey Reports
- Research Institute
- Latest Research Reports
- Opinion Leaders
Secondary Research
- Annual Reports
- White Paper
- Latest Press Release
- Industry Association
- Paid Database
- Investor Presentations

Step 4 - Data Triangulation
Involves using different sources of information in order to increase the validity of a study
These sources are likely to be stakeholders in a program - participants, other researchers, program staff, other community members, and so on.
Then we put all data in single framework & apply various statistical tools to find out the dynamic on the market.
During the analysis stage, feedback from the stakeholder groups would be compared to determine areas of agreement as well as areas of divergence