

Key Insights
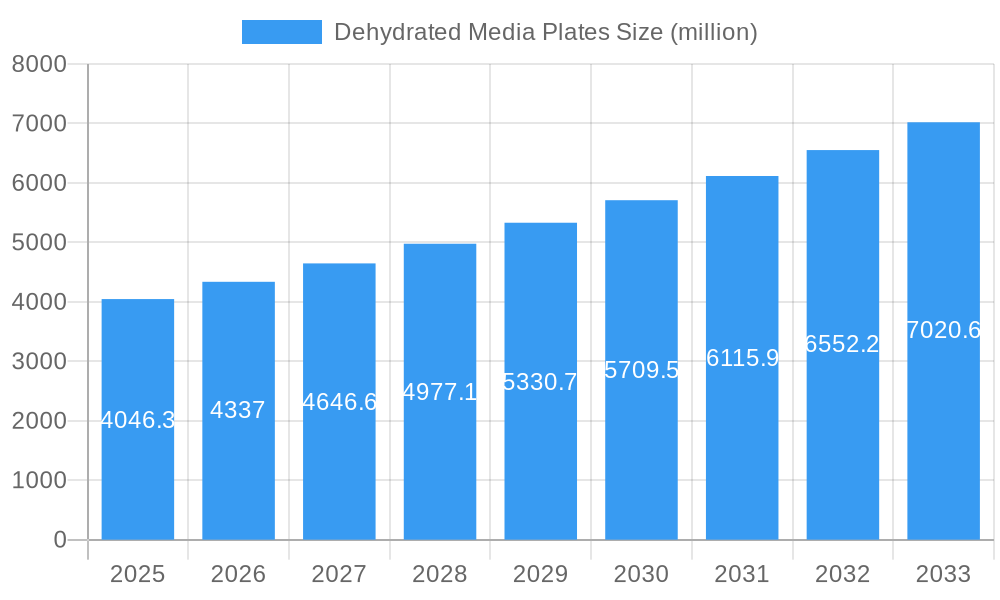
The global Dehydrated Media Plates market is poised for robust growth, projected to reach approximately $4,046.3 million with a compound annual growth rate (CAGR) of 7.3% between 2025 and 2033. This expansion is primarily fueled by the increasing demand for reliable and cost-effective microbial detection solutions across various industries. The food industry stands out as a significant driver, with stringent food safety regulations and a growing consumer emphasis on product quality necessitating advanced microbiological testing. Similarly, the pharmaceutical sector's continuous need for quality control in drug manufacturing and research, coupled with the expanding cosmetics market's focus on product safety and ingredient integrity, further bolster demand. Emerging economies, particularly in the Asia Pacific region, are expected to contribute substantially to this growth due to rising healthcare investments and an expanding industrial base.
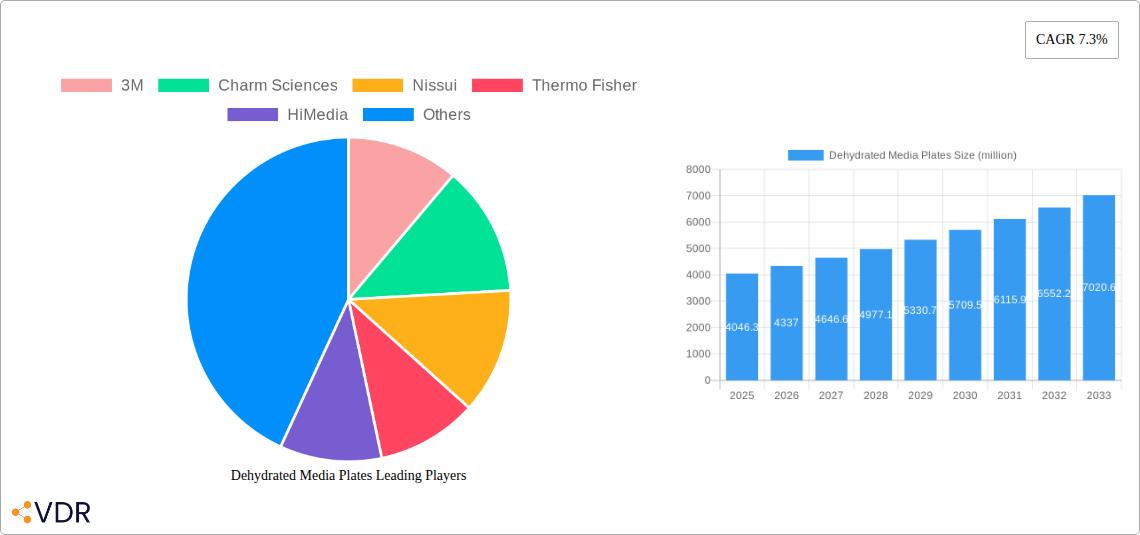
Dehydrated Media Plates Market Size (In Billion)
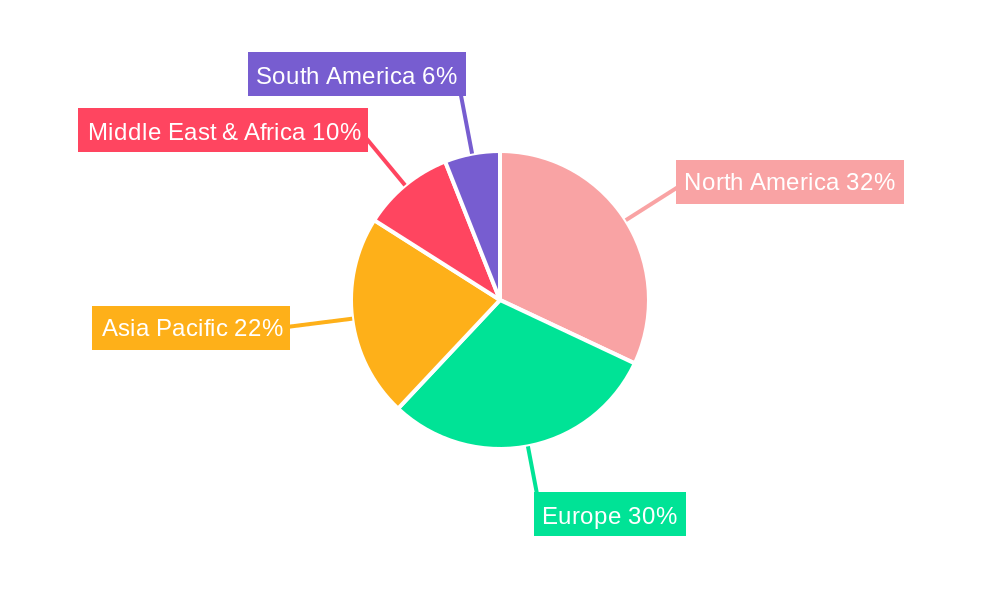
While the market demonstrates strong upward momentum, certain factors warrant consideration. The perceived complexity in handling and reconstituting dehydrated media, along with the availability of ready-to-use alternatives, could present minor restraints. However, the inherent advantages of dehydrated media, such as longer shelf life, reduced shipping costs, and greater versatility, are expected to outweigh these concerns. Geographically, North America and Europe currently dominate the market, driven by established regulatory frameworks and advanced research infrastructure. Nevertheless, the Asia Pacific region is anticipated to witness the highest growth rate, propelled by increasing awareness of food and health safety, a burgeoning manufacturing sector, and significant government initiatives to enhance public health. Key players like Thermo Fisher, 3M, and Charm Sciences are actively innovating to meet evolving market needs, focusing on developing specialized media formulations and improving product usability.
Dehydrated Media Plates Company Market Share
Dehydrated Media Plates Market: Comprehensive Analysis and Growth Outlook (2019-2033)
This in-depth report provides a comprehensive analysis of the global dehydrated media plates market, offering critical insights into market dynamics, growth trends, regional dominance, product landscape, key drivers, barriers, opportunities, and leading players. Covering the historical period from 2019-2024, a base year of 2025, and a forecast period extending to 2033, this report is essential for stakeholders seeking to understand and capitalize on the evolving dehydrated media plates industry. The analysis encompasses both parent and child market segments to provide a holistic view, with all quantitative data presented in millions of units.
Dehydrated Media Plates Market Dynamics & Structure
The global dehydrated media plates market exhibits a moderate to high concentration, with key players like Thermo Fisher, 3M, and BD holding significant market share. Technological innovation remains a primary driver, particularly in the development of specialized dehydrated media for complex microbial detection and rapid culturing. Regulatory frameworks, such as those established by the FDA and EMA, play a crucial role in ensuring product quality and safety, influencing product development and market entry strategies. Competitive product substitutes, including liquid media and ready-to-use plates, pose a moderate challenge, but the cost-effectiveness and extended shelf-life of dehydrated media plates maintain their strong market position. End-user demographics are shifting towards a greater demand from the pharmaceutical and biotechnology sectors, driven by increased research and development activities and stringent quality control requirements. Mergers and acquisitions (M&A) have been a notable trend, with companies consolidating to expand their product portfolios and geographical reach. For instance, the acquisition of smaller niche media manufacturers by larger corporations has been observed.
- Market Concentration: Moderate to High. Leading companies account for an estimated 60% of the total market share.
- Technological Innovation Drivers: Development of selective and differential media, automation-compatible formulations, and improved shelf-life technologies.
- Regulatory Frameworks: FDA, EMA, ISO certifications impact product approval and market access.
- Competitive Product Substitutes: Liquid media, ready-to-use plates, rapid testing kits.
- End-User Demographics: Dominance of pharmaceutical, biotechnology, and food & beverage industries.
- M&A Trends: Strategic acquisitions to enhance product offerings and market penetration. Estimated M&A deal volume in the past five years is approximately 25 deals, averaging a value of $50 million per deal.
Dehydrated Media Plates Growth Trends & Insights
The global dehydrated media plates market is projected to experience robust growth, driven by increasing demand across various end-use industries and advancements in diagnostic technologies. The market size, estimated at approximately $2,100 million in 2025, is anticipated to reach around $3,500 million by 2033, exhibiting a Compound Annual Growth Rate (CAGR) of approximately 6.5% during the forecast period. The rising incidence of foodborne illnesses and the stringent regulatory requirements for food safety are significant contributors to the growth of dehydrated media plates in the food industry, with an estimated market penetration of 75% for key microbial testing applications. In the pharmaceutical sector, the escalating need for quality control and the development of new drug formulations are fueling demand, with an estimated 70% of pharmaceutical microbiology labs utilizing dehydrated media.
Technological disruptions are playing a pivotal role, with the development of novel dehydrated media formulations offering enhanced selectivity, sensitivity, and faster recovery of specific microorganisms. This includes the integration of chromogenic agents and selective inhibitors. Consumer behavior shifts, such as a growing preference for faster and more reliable microbial testing methods, are also positively impacting market growth. The increasing focus on preventative healthcare and the growing awareness of hygiene standards in sectors like cosmetics are further bolstering demand. The penetration of dehydrated media plates in the cosmetics industry, although smaller than food and pharma, is growing at an estimated CAGR of 7%, driven by stricter cosmetic safety regulations. The ‘Others’ segment, encompassing environmental monitoring and research laboratories, is also showing steady growth.
- Market Size Evolution: Estimated market size of $2,100 million in 2025, projected to reach $3,500 million by 2033.
- CAGR: Approximately 6.5% during the forecast period (2025-2033).
- Adoption Rates: High adoption in food safety (75% penetration for key tests) and pharmaceutical quality control (70% utilization).
- Technological Disruptions: Development of chromogenic and selective media, improved shelf-life.
- Consumer Behavior Shifts: Demand for faster, reliable testing; increased focus on hygiene and preventative healthcare.
- Market Penetration in Cosmetics: Growing at an estimated CAGR of 7%.
Dominant Regions, Countries, or Segments in Dehydrated Media Plates
The global dehydrated media plates market is significantly influenced by regional economic factors, regulatory landscapes, and the presence of key end-user industries. North America currently holds a dominant position, driven by its advanced pharmaceutical and biotechnology sectors, robust food safety regulations, and substantial investment in research and development. The United States, in particular, accounts for a significant portion of this regional dominance, estimated at 65% of the North American market. The stringent Food Safety Modernization Act (FSMA) and increasing FDA enforcement contribute to a consistent demand for reliable microbial testing solutions in the food industry.
Within the Application segment, the Food Industry emerges as the largest and most dominant segment, accounting for an estimated 40% of the global market share. This is directly attributable to the global rise in processed food consumption and the critical need for microbial contamination control. The Pharmaceuticals segment follows closely, representing approximately 35% of the market, driven by the rigorous quality control measures mandated for drug manufacturing and the burgeoning biopharmaceutical research. The Cosmetics sector, while smaller at an estimated 15% market share, is experiencing significant growth due to increasing consumer awareness about product safety and hygiene. The 'Others' segment, encompassing environmental monitoring, veterinary diagnostics, and academic research, contributes the remaining 10%.
In terms of Types, Coliform testing media remains a consistently high-demand category within the dehydrated media plates market, estimated at 50% of the total type segment. This is a direct reflection of its widespread application in water and food safety testing. Yeast and Mold media constitute approximately 30% of the market share, essential for detecting spoilage in food and beverage products. The 'Others' type category, which includes specialized media for various pathogens like Salmonella, Listeria, and specific environmental microbes, makes up the remaining 20% of the market. Growth in this 'Others' type segment is driven by the continuous identification of new pathogens and the need for targeted detection methods.
- Dominant Region: North America, with the United States being the leading country.
- Dominant Application Segment: Food Industry (40% market share), followed by Pharmaceuticals (35%).
- Key Drivers in Food Industry: Food safety regulations (FSMA), increased processed food consumption.
- Growth in Cosmetics: Driven by consumer awareness and safety regulations.
- Dominant Type Segment: Coliform testing media (50% market share).
- Growth in 'Others' Type: Driven by specialized pathogen detection needs.
Dehydrated Media Plates Product Landscape
The dehydrated media plates market is characterized by a diverse range of products designed for specific microbial detection and enumeration needs. Innovations focus on enhancing selectivity, sensitivity, and reducing incubation times. Key product advancements include chromogenic media that facilitate easy identification of specific bacteria through color development, and selective media that inhibit the growth of unwanted microorganisms, ensuring accurate results for target pathogens. Performance metrics such as recovery rates, selectivity ratios, and shelf-life stability are critical differentiators. For example, improved formulations now offer a shelf-life of up to five years, significantly reducing waste and cost for end-users. The integration of dehydrated media into automated microbiology systems is also a growing trend, enhancing efficiency and throughput in high-volume testing laboratories.
Key Drivers, Barriers & Challenges in Dehydrated Media Plates
Several factors propel the growth of the dehydrated media plates market. Technological advancements in media formulations, leading to improved accuracy and efficiency, are paramount. The increasing stringency of regulatory frameworks globally for food, pharmaceutical, and cosmetic safety mandates the use of reliable microbial testing solutions. Growing public awareness regarding health and hygiene, particularly in food safety and personal care, further fuels demand. Cost-effectiveness and extended shelf-life of dehydrated media compared to liquid or ready-to-use alternatives remain significant economic drivers.
However, the market faces certain challenges and barriers. Competition from alternative testing methods, such as rapid molecular diagnostics and immunoassay-based kits, poses a competitive threat, offering faster results albeit often at a higher cost per test. Fluctuations in raw material prices, particularly for nutrient components and agar, can impact profit margins and pricing strategies. Strict regulatory compliance requirements can also be a barrier to entry for new manufacturers and can necessitate significant investment in quality control and validation. Supply chain disruptions, as witnessed in recent years, can affect the availability and cost of essential raw materials, impacting production timelines.
Emerging Opportunities in Dehydrated Media Plates
Emerging opportunities in the dehydrated media plates sector are primarily driven by the expansion of their application into novel areas and technological integration. The increasing focus on environmental monitoring, including air and water quality testing for pathogens, presents a significant untapped market. The development of specialized dehydrated media for rare or emerging pathogens, driven by global health concerns, offers substantial growth potential. Furthermore, the integration of dehydrated media plates with biosensor technologies and AI-powered analytical platforms for real-time microbial detection and data interpretation is a promising area. Consumer preferences for sustainably sourced and biodegradable packaging for laboratory consumables also present an opportunity for manufacturers to innovate their product presentation.
Growth Accelerators in the Dehydrated Media Plates Industry
Several catalysts are accelerating the long-term growth of the dehydrated media plates industry. Technological breakthroughs in media formulation, such as the development of media with improved diagnostic capabilities (e.g., enhanced colorimetric or fluorogenic responses), are key accelerators. Strategic partnerships between media manufacturers and diagnostic equipment providers, focusing on integrated workflow solutions, are also driving adoption. Market expansion strategies, particularly in emerging economies with growing food and pharmaceutical industries and increasing adoption of quality control standards, offer significant growth potential. The increasing prevalence of personalized medicine and biopharmaceutical research also demands highly specific and reliable culture media.
Key Players Shaping the Dehydrated Media Plates Market
- 3M
- Charm Sciences
- Nissui
- Thermo Fisher
- HiMedia
- Cherwell Laboratories
- BD
- Hylabs
Notable Milestones in Dehydrated Media Plates Sector
- 2020: Launch of advanced chromogenic dehydrated media for Salmonella detection by Thermo Fisher, improving ease of identification.
- 2021: Acquisition of a specialized media manufacturer by BD, expanding its microbiology portfolio.
- 2022: Introduction of extended shelf-life dehydrated media formulations by HiMedia, offering enhanced cost-efficiency.
- 2023: Development of dehydrated media plates with improved selectivity for Listeria by Charm Sciences, addressing food safety concerns.
- 2024: Introduction of dehydrated media compatible with automated robotic plating systems by Cherwell Laboratories.
In-Depth Dehydrated Media Plates Market Outlook
The dehydrated media plates market is poised for continued expansion, fueled by ongoing advancements in microbial detection technologies and the persistent demand for reliable quality control across critical industries. Future growth will likely be characterized by the development of highly specialized and multiplexed dehydrated media, catering to the nuanced needs of biopharmaceutical research and emerging pathogen surveillance. Strategic collaborations aimed at creating integrated testing solutions, combining dehydrated media with automated systems and data analytics, will be crucial for market leadership. Emerging economies, with their rapidly growing food and pharmaceutical sectors, represent significant untapped markets for expansion. Manufacturers focusing on sustainability and eco-friendly packaging will also gain a competitive edge. The market's trajectory indicates sustained innovation and increasing importance in ensuring global public health and safety.
Dehydrated Media Plates Segmentation
-
1. Application
- 1.1. Food Industry
- 1.2. Cosmetics
- 1.3. Pharmaceuticals
- 1.4. Others
-
2. Types
- 2.1. Coliform
- 2.2. Yeast
- 2.3. Others
Dehydrated Media Plates Segmentation By Geography
-
1. North America
- 1.1. United States
- 1.2. Canada
- 1.3. Mexico
-
2. South America
- 2.1. Brazil
- 2.2. Argentina
- 2.3. Rest of South America
-
3. Europe
- 3.1. United Kingdom
- 3.2. Germany
- 3.3. France
- 3.4. Italy
- 3.5. Spain
- 3.6. Russia
- 3.7. Benelux
- 3.8. Nordics
- 3.9. Rest of Europe
-
4. Middle East & Africa
- 4.1. Turkey
- 4.2. Israel
- 4.3. GCC
- 4.4. North Africa
- 4.5. South Africa
- 4.6. Rest of Middle East & Africa
-
5. Asia Pacific
- 5.1. China
- 5.2. India
- 5.3. Japan
- 5.4. South Korea
- 5.5. ASEAN
- 5.6. Oceania
- 5.7. Rest of Asia Pacific
Dehydrated Media Plates Regional Market Share
Geographic Coverage of Dehydrated Media Plates
Dehydrated Media Plates REPORT HIGHLIGHTS
| Aspects | Details |
|---|---|
| Study Period | 2020-2034 |
| Base Year | 2025 |
| Estimated Year | 2026 |
| Forecast Period | 2026-2034 |
| Historical Period | 2020-2025 |
| Growth Rate | CAGR of 7.3% from 2020-2034 |
| Segmentation |
|
Table of Contents
- 1. Introduction
- 1.1. Research Scope
- 1.2. Market Segmentation
- 1.3. Research Methodology
- 1.4. Definitions and Assumptions
- 2. Executive Summary
- 2.1. Introduction
- 3. Market Dynamics
- 3.1. Introduction
- 3.2. Market Drivers
- 3.3. Market Restrains
- 3.4. Market Trends
- 4. Market Factor Analysis
- 4.1. Porters Five Forces
- 4.2. Supply/Value Chain
- 4.3. PESTEL analysis
- 4.4. Market Entropy
- 4.5. Patent/Trademark Analysis
- 5. Global Dehydrated Media Plates Analysis, Insights and Forecast, 2020-2032
- 5.1. Market Analysis, Insights and Forecast - by Application
- 5.1.1. Food Industry
- 5.1.2. Cosmetics
- 5.1.3. Pharmaceuticals
- 5.1.4. Others
- 5.2. Market Analysis, Insights and Forecast - by Types
- 5.2.1. Coliform
- 5.2.2. Yeast
- 5.2.3. Others
- 5.3. Market Analysis, Insights and Forecast - by Region
- 5.3.1. North America
- 5.3.2. South America
- 5.3.3. Europe
- 5.3.4. Middle East & Africa
- 5.3.5. Asia Pacific
- 5.1. Market Analysis, Insights and Forecast - by Application
- 6. North America Dehydrated Media Plates Analysis, Insights and Forecast, 2020-2032
- 6.1. Market Analysis, Insights and Forecast - by Application
- 6.1.1. Food Industry
- 6.1.2. Cosmetics
- 6.1.3. Pharmaceuticals
- 6.1.4. Others
- 6.2. Market Analysis, Insights and Forecast - by Types
- 6.2.1. Coliform
- 6.2.2. Yeast
- 6.2.3. Others
- 6.1. Market Analysis, Insights and Forecast - by Application
- 7. South America Dehydrated Media Plates Analysis, Insights and Forecast, 2020-2032
- 7.1. Market Analysis, Insights and Forecast - by Application
- 7.1.1. Food Industry
- 7.1.2. Cosmetics
- 7.1.3. Pharmaceuticals
- 7.1.4. Others
- 7.2. Market Analysis, Insights and Forecast - by Types
- 7.2.1. Coliform
- 7.2.2. Yeast
- 7.2.3. Others
- 7.1. Market Analysis, Insights and Forecast - by Application
- 8. Europe Dehydrated Media Plates Analysis, Insights and Forecast, 2020-2032
- 8.1. Market Analysis, Insights and Forecast - by Application
- 8.1.1. Food Industry
- 8.1.2. Cosmetics
- 8.1.3. Pharmaceuticals
- 8.1.4. Others
- 8.2. Market Analysis, Insights and Forecast - by Types
- 8.2.1. Coliform
- 8.2.2. Yeast
- 8.2.3. Others
- 8.1. Market Analysis, Insights and Forecast - by Application
- 9. Middle East & Africa Dehydrated Media Plates Analysis, Insights and Forecast, 2020-2032
- 9.1. Market Analysis, Insights and Forecast - by Application
- 9.1.1. Food Industry
- 9.1.2. Cosmetics
- 9.1.3. Pharmaceuticals
- 9.1.4. Others
- 9.2. Market Analysis, Insights and Forecast - by Types
- 9.2.1. Coliform
- 9.2.2. Yeast
- 9.2.3. Others
- 9.1. Market Analysis, Insights and Forecast - by Application
- 10. Asia Pacific Dehydrated Media Plates Analysis, Insights and Forecast, 2020-2032
- 10.1. Market Analysis, Insights and Forecast - by Application
- 10.1.1. Food Industry
- 10.1.2. Cosmetics
- 10.1.3. Pharmaceuticals
- 10.1.4. Others
- 10.2. Market Analysis, Insights and Forecast - by Types
- 10.2.1. Coliform
- 10.2.2. Yeast
- 10.2.3. Others
- 10.1. Market Analysis, Insights and Forecast - by Application
- 11. Competitive Analysis
- 11.1. Global Market Share Analysis 2025
- 11.2. Company Profiles
- 11.2.1 3M
- 11.2.1.1. Overview
- 11.2.1.2. Products
- 11.2.1.3. SWOT Analysis
- 11.2.1.4. Recent Developments
- 11.2.1.5. Financials (Based on Availability)
- 11.2.2 Charm Sciences
- 11.2.2.1. Overview
- 11.2.2.2. Products
- 11.2.2.3. SWOT Analysis
- 11.2.2.4. Recent Developments
- 11.2.2.5. Financials (Based on Availability)
- 11.2.3 Nissui
- 11.2.3.1. Overview
- 11.2.3.2. Products
- 11.2.3.3. SWOT Analysis
- 11.2.3.4. Recent Developments
- 11.2.3.5. Financials (Based on Availability)
- 11.2.4 Thermo Fisher
- 11.2.4.1. Overview
- 11.2.4.2. Products
- 11.2.4.3. SWOT Analysis
- 11.2.4.4. Recent Developments
- 11.2.4.5. Financials (Based on Availability)
- 11.2.5 HiMedia
- 11.2.5.1. Overview
- 11.2.5.2. Products
- 11.2.5.3. SWOT Analysis
- 11.2.5.4. Recent Developments
- 11.2.5.5. Financials (Based on Availability)
- 11.2.6 Cherwell Laboratories
- 11.2.6.1. Overview
- 11.2.6.2. Products
- 11.2.6.3. SWOT Analysis
- 11.2.6.4. Recent Developments
- 11.2.6.5. Financials (Based on Availability)
- 11.2.7 BD
- 11.2.7.1. Overview
- 11.2.7.2. Products
- 11.2.7.3. SWOT Analysis
- 11.2.7.4. Recent Developments
- 11.2.7.5. Financials (Based on Availability)
- 11.2.8 Hylabs
- 11.2.8.1. Overview
- 11.2.8.2. Products
- 11.2.8.3. SWOT Analysis
- 11.2.8.4. Recent Developments
- 11.2.8.5. Financials (Based on Availability)
- 11.2.1 3M
List of Figures
- Figure 1: Global Dehydrated Media Plates Revenue Breakdown (undefined, %) by Region 2025 & 2033
- Figure 2: Global Dehydrated Media Plates Volume Breakdown (K, %) by Region 2025 & 2033
- Figure 3: North America Dehydrated Media Plates Revenue (undefined), by Application 2025 & 2033
- Figure 4: North America Dehydrated Media Plates Volume (K), by Application 2025 & 2033
- Figure 5: North America Dehydrated Media Plates Revenue Share (%), by Application 2025 & 2033
- Figure 6: North America Dehydrated Media Plates Volume Share (%), by Application 2025 & 2033
- Figure 7: North America Dehydrated Media Plates Revenue (undefined), by Types 2025 & 2033
- Figure 8: North America Dehydrated Media Plates Volume (K), by Types 2025 & 2033
- Figure 9: North America Dehydrated Media Plates Revenue Share (%), by Types 2025 & 2033
- Figure 10: North America Dehydrated Media Plates Volume Share (%), by Types 2025 & 2033
- Figure 11: North America Dehydrated Media Plates Revenue (undefined), by Country 2025 & 2033
- Figure 12: North America Dehydrated Media Plates Volume (K), by Country 2025 & 2033
- Figure 13: North America Dehydrated Media Plates Revenue Share (%), by Country 2025 & 2033
- Figure 14: North America Dehydrated Media Plates Volume Share (%), by Country 2025 & 2033
- Figure 15: South America Dehydrated Media Plates Revenue (undefined), by Application 2025 & 2033
- Figure 16: South America Dehydrated Media Plates Volume (K), by Application 2025 & 2033
- Figure 17: South America Dehydrated Media Plates Revenue Share (%), by Application 2025 & 2033
- Figure 18: South America Dehydrated Media Plates Volume Share (%), by Application 2025 & 2033
- Figure 19: South America Dehydrated Media Plates Revenue (undefined), by Types 2025 & 2033
- Figure 20: South America Dehydrated Media Plates Volume (K), by Types 2025 & 2033
- Figure 21: South America Dehydrated Media Plates Revenue Share (%), by Types 2025 & 2033
- Figure 22: South America Dehydrated Media Plates Volume Share (%), by Types 2025 & 2033
- Figure 23: South America Dehydrated Media Plates Revenue (undefined), by Country 2025 & 2033
- Figure 24: South America Dehydrated Media Plates Volume (K), by Country 2025 & 2033
- Figure 25: South America Dehydrated Media Plates Revenue Share (%), by Country 2025 & 2033
- Figure 26: South America Dehydrated Media Plates Volume Share (%), by Country 2025 & 2033
- Figure 27: Europe Dehydrated Media Plates Revenue (undefined), by Application 2025 & 2033
- Figure 28: Europe Dehydrated Media Plates Volume (K), by Application 2025 & 2033
- Figure 29: Europe Dehydrated Media Plates Revenue Share (%), by Application 2025 & 2033
- Figure 30: Europe Dehydrated Media Plates Volume Share (%), by Application 2025 & 2033
- Figure 31: Europe Dehydrated Media Plates Revenue (undefined), by Types 2025 & 2033
- Figure 32: Europe Dehydrated Media Plates Volume (K), by Types 2025 & 2033
- Figure 33: Europe Dehydrated Media Plates Revenue Share (%), by Types 2025 & 2033
- Figure 34: Europe Dehydrated Media Plates Volume Share (%), by Types 2025 & 2033
- Figure 35: Europe Dehydrated Media Plates Revenue (undefined), by Country 2025 & 2033
- Figure 36: Europe Dehydrated Media Plates Volume (K), by Country 2025 & 2033
- Figure 37: Europe Dehydrated Media Plates Revenue Share (%), by Country 2025 & 2033
- Figure 38: Europe Dehydrated Media Plates Volume Share (%), by Country 2025 & 2033
- Figure 39: Middle East & Africa Dehydrated Media Plates Revenue (undefined), by Application 2025 & 2033
- Figure 40: Middle East & Africa Dehydrated Media Plates Volume (K), by Application 2025 & 2033
- Figure 41: Middle East & Africa Dehydrated Media Plates Revenue Share (%), by Application 2025 & 2033
- Figure 42: Middle East & Africa Dehydrated Media Plates Volume Share (%), by Application 2025 & 2033
- Figure 43: Middle East & Africa Dehydrated Media Plates Revenue (undefined), by Types 2025 & 2033
- Figure 44: Middle East & Africa Dehydrated Media Plates Volume (K), by Types 2025 & 2033
- Figure 45: Middle East & Africa Dehydrated Media Plates Revenue Share (%), by Types 2025 & 2033
- Figure 46: Middle East & Africa Dehydrated Media Plates Volume Share (%), by Types 2025 & 2033
- Figure 47: Middle East & Africa Dehydrated Media Plates Revenue (undefined), by Country 2025 & 2033
- Figure 48: Middle East & Africa Dehydrated Media Plates Volume (K), by Country 2025 & 2033
- Figure 49: Middle East & Africa Dehydrated Media Plates Revenue Share (%), by Country 2025 & 2033
- Figure 50: Middle East & Africa Dehydrated Media Plates Volume Share (%), by Country 2025 & 2033
- Figure 51: Asia Pacific Dehydrated Media Plates Revenue (undefined), by Application 2025 & 2033
- Figure 52: Asia Pacific Dehydrated Media Plates Volume (K), by Application 2025 & 2033
- Figure 53: Asia Pacific Dehydrated Media Plates Revenue Share (%), by Application 2025 & 2033
- Figure 54: Asia Pacific Dehydrated Media Plates Volume Share (%), by Application 2025 & 2033
- Figure 55: Asia Pacific Dehydrated Media Plates Revenue (undefined), by Types 2025 & 2033
- Figure 56: Asia Pacific Dehydrated Media Plates Volume (K), by Types 2025 & 2033
- Figure 57: Asia Pacific Dehydrated Media Plates Revenue Share (%), by Types 2025 & 2033
- Figure 58: Asia Pacific Dehydrated Media Plates Volume Share (%), by Types 2025 & 2033
- Figure 59: Asia Pacific Dehydrated Media Plates Revenue (undefined), by Country 2025 & 2033
- Figure 60: Asia Pacific Dehydrated Media Plates Volume (K), by Country 2025 & 2033
- Figure 61: Asia Pacific Dehydrated Media Plates Revenue Share (%), by Country 2025 & 2033
- Figure 62: Asia Pacific Dehydrated Media Plates Volume Share (%), by Country 2025 & 2033
List of Tables
- Table 1: Global Dehydrated Media Plates Revenue undefined Forecast, by Application 2020 & 2033
- Table 2: Global Dehydrated Media Plates Volume K Forecast, by Application 2020 & 2033
- Table 3: Global Dehydrated Media Plates Revenue undefined Forecast, by Types 2020 & 2033
- Table 4: Global Dehydrated Media Plates Volume K Forecast, by Types 2020 & 2033
- Table 5: Global Dehydrated Media Plates Revenue undefined Forecast, by Region 2020 & 2033
- Table 6: Global Dehydrated Media Plates Volume K Forecast, by Region 2020 & 2033
- Table 7: Global Dehydrated Media Plates Revenue undefined Forecast, by Application 2020 & 2033
- Table 8: Global Dehydrated Media Plates Volume K Forecast, by Application 2020 & 2033
- Table 9: Global Dehydrated Media Plates Revenue undefined Forecast, by Types 2020 & 2033
- Table 10: Global Dehydrated Media Plates Volume K Forecast, by Types 2020 & 2033
- Table 11: Global Dehydrated Media Plates Revenue undefined Forecast, by Country 2020 & 2033
- Table 12: Global Dehydrated Media Plates Volume K Forecast, by Country 2020 & 2033
- Table 13: United States Dehydrated Media Plates Revenue (undefined) Forecast, by Application 2020 & 2033
- Table 14: United States Dehydrated Media Plates Volume (K) Forecast, by Application 2020 & 2033
- Table 15: Canada Dehydrated Media Plates Revenue (undefined) Forecast, by Application 2020 & 2033
- Table 16: Canada Dehydrated Media Plates Volume (K) Forecast, by Application 2020 & 2033
- Table 17: Mexico Dehydrated Media Plates Revenue (undefined) Forecast, by Application 2020 & 2033
- Table 18: Mexico Dehydrated Media Plates Volume (K) Forecast, by Application 2020 & 2033
- Table 19: Global Dehydrated Media Plates Revenue undefined Forecast, by Application 2020 & 2033
- Table 20: Global Dehydrated Media Plates Volume K Forecast, by Application 2020 & 2033
- Table 21: Global Dehydrated Media Plates Revenue undefined Forecast, by Types 2020 & 2033
- Table 22: Global Dehydrated Media Plates Volume K Forecast, by Types 2020 & 2033
- Table 23: Global Dehydrated Media Plates Revenue undefined Forecast, by Country 2020 & 2033
- Table 24: Global Dehydrated Media Plates Volume K Forecast, by Country 2020 & 2033
- Table 25: Brazil Dehydrated Media Plates Revenue (undefined) Forecast, by Application 2020 & 2033
- Table 26: Brazil Dehydrated Media Plates Volume (K) Forecast, by Application 2020 & 2033
- Table 27: Argentina Dehydrated Media Plates Revenue (undefined) Forecast, by Application 2020 & 2033
- Table 28: Argentina Dehydrated Media Plates Volume (K) Forecast, by Application 2020 & 2033
- Table 29: Rest of South America Dehydrated Media Plates Revenue (undefined) Forecast, by Application 2020 & 2033
- Table 30: Rest of South America Dehydrated Media Plates Volume (K) Forecast, by Application 2020 & 2033
- Table 31: Global Dehydrated Media Plates Revenue undefined Forecast, by Application 2020 & 2033
- Table 32: Global Dehydrated Media Plates Volume K Forecast, by Application 2020 & 2033
- Table 33: Global Dehydrated Media Plates Revenue undefined Forecast, by Types 2020 & 2033
- Table 34: Global Dehydrated Media Plates Volume K Forecast, by Types 2020 & 2033
- Table 35: Global Dehydrated Media Plates Revenue undefined Forecast, by Country 2020 & 2033
- Table 36: Global Dehydrated Media Plates Volume K Forecast, by Country 2020 & 2033
- Table 37: United Kingdom Dehydrated Media Plates Revenue (undefined) Forecast, by Application 2020 & 2033
- Table 38: United Kingdom Dehydrated Media Plates Volume (K) Forecast, by Application 2020 & 2033
- Table 39: Germany Dehydrated Media Plates Revenue (undefined) Forecast, by Application 2020 & 2033
- Table 40: Germany Dehydrated Media Plates Volume (K) Forecast, by Application 2020 & 2033
- Table 41: France Dehydrated Media Plates Revenue (undefined) Forecast, by Application 2020 & 2033
- Table 42: France Dehydrated Media Plates Volume (K) Forecast, by Application 2020 & 2033
- Table 43: Italy Dehydrated Media Plates Revenue (undefined) Forecast, by Application 2020 & 2033
- Table 44: Italy Dehydrated Media Plates Volume (K) Forecast, by Application 2020 & 2033
- Table 45: Spain Dehydrated Media Plates Revenue (undefined) Forecast, by Application 2020 & 2033
- Table 46: Spain Dehydrated Media Plates Volume (K) Forecast, by Application 2020 & 2033
- Table 47: Russia Dehydrated Media Plates Revenue (undefined) Forecast, by Application 2020 & 2033
- Table 48: Russia Dehydrated Media Plates Volume (K) Forecast, by Application 2020 & 2033
- Table 49: Benelux Dehydrated Media Plates Revenue (undefined) Forecast, by Application 2020 & 2033
- Table 50: Benelux Dehydrated Media Plates Volume (K) Forecast, by Application 2020 & 2033
- Table 51: Nordics Dehydrated Media Plates Revenue (undefined) Forecast, by Application 2020 & 2033
- Table 52: Nordics Dehydrated Media Plates Volume (K) Forecast, by Application 2020 & 2033
- Table 53: Rest of Europe Dehydrated Media Plates Revenue (undefined) Forecast, by Application 2020 & 2033
- Table 54: Rest of Europe Dehydrated Media Plates Volume (K) Forecast, by Application 2020 & 2033
- Table 55: Global Dehydrated Media Plates Revenue undefined Forecast, by Application 2020 & 2033
- Table 56: Global Dehydrated Media Plates Volume K Forecast, by Application 2020 & 2033
- Table 57: Global Dehydrated Media Plates Revenue undefined Forecast, by Types 2020 & 2033
- Table 58: Global Dehydrated Media Plates Volume K Forecast, by Types 2020 & 2033
- Table 59: Global Dehydrated Media Plates Revenue undefined Forecast, by Country 2020 & 2033
- Table 60: Global Dehydrated Media Plates Volume K Forecast, by Country 2020 & 2033
- Table 61: Turkey Dehydrated Media Plates Revenue (undefined) Forecast, by Application 2020 & 2033
- Table 62: Turkey Dehydrated Media Plates Volume (K) Forecast, by Application 2020 & 2033
- Table 63: Israel Dehydrated Media Plates Revenue (undefined) Forecast, by Application 2020 & 2033
- Table 64: Israel Dehydrated Media Plates Volume (K) Forecast, by Application 2020 & 2033
- Table 65: GCC Dehydrated Media Plates Revenue (undefined) Forecast, by Application 2020 & 2033
- Table 66: GCC Dehydrated Media Plates Volume (K) Forecast, by Application 2020 & 2033
- Table 67: North Africa Dehydrated Media Plates Revenue (undefined) Forecast, by Application 2020 & 2033
- Table 68: North Africa Dehydrated Media Plates Volume (K) Forecast, by Application 2020 & 2033
- Table 69: South Africa Dehydrated Media Plates Revenue (undefined) Forecast, by Application 2020 & 2033
- Table 70: South Africa Dehydrated Media Plates Volume (K) Forecast, by Application 2020 & 2033
- Table 71: Rest of Middle East & Africa Dehydrated Media Plates Revenue (undefined) Forecast, by Application 2020 & 2033
- Table 72: Rest of Middle East & Africa Dehydrated Media Plates Volume (K) Forecast, by Application 2020 & 2033
- Table 73: Global Dehydrated Media Plates Revenue undefined Forecast, by Application 2020 & 2033
- Table 74: Global Dehydrated Media Plates Volume K Forecast, by Application 2020 & 2033
- Table 75: Global Dehydrated Media Plates Revenue undefined Forecast, by Types 2020 & 2033
- Table 76: Global Dehydrated Media Plates Volume K Forecast, by Types 2020 & 2033
- Table 77: Global Dehydrated Media Plates Revenue undefined Forecast, by Country 2020 & 2033
- Table 78: Global Dehydrated Media Plates Volume K Forecast, by Country 2020 & 2033
- Table 79: China Dehydrated Media Plates Revenue (undefined) Forecast, by Application 2020 & 2033
- Table 80: China Dehydrated Media Plates Volume (K) Forecast, by Application 2020 & 2033
- Table 81: India Dehydrated Media Plates Revenue (undefined) Forecast, by Application 2020 & 2033
- Table 82: India Dehydrated Media Plates Volume (K) Forecast, by Application 2020 & 2033
- Table 83: Japan Dehydrated Media Plates Revenue (undefined) Forecast, by Application 2020 & 2033
- Table 84: Japan Dehydrated Media Plates Volume (K) Forecast, by Application 2020 & 2033
- Table 85: South Korea Dehydrated Media Plates Revenue (undefined) Forecast, by Application 2020 & 2033
- Table 86: South Korea Dehydrated Media Plates Volume (K) Forecast, by Application 2020 & 2033
- Table 87: ASEAN Dehydrated Media Plates Revenue (undefined) Forecast, by Application 2020 & 2033
- Table 88: ASEAN Dehydrated Media Plates Volume (K) Forecast, by Application 2020 & 2033
- Table 89: Oceania Dehydrated Media Plates Revenue (undefined) Forecast, by Application 2020 & 2033
- Table 90: Oceania Dehydrated Media Plates Volume (K) Forecast, by Application 2020 & 2033
- Table 91: Rest of Asia Pacific Dehydrated Media Plates Revenue (undefined) Forecast, by Application 2020 & 2033
- Table 92: Rest of Asia Pacific Dehydrated Media Plates Volume (K) Forecast, by Application 2020 & 2033
Frequently Asked Questions
1. What is the projected Compound Annual Growth Rate (CAGR) of the Dehydrated Media Plates?
The projected CAGR is approximately 7.3%.
2. Which companies are prominent players in the Dehydrated Media Plates?
Key companies in the market include 3M, Charm Sciences, Nissui, Thermo Fisher, HiMedia, Cherwell Laboratories, BD, Hylabs.
3. What are the main segments of the Dehydrated Media Plates?
The market segments include Application, Types.
4. Can you provide details about the market size?
The market size is estimated to be USD XXX N/A as of 2022.
5. What are some drivers contributing to market growth?
N/A
6. What are the notable trends driving market growth?
N/A
7. Are there any restraints impacting market growth?
N/A
8. Can you provide examples of recent developments in the market?
N/A
9. What pricing options are available for accessing the report?
Pricing options include single-user, multi-user, and enterprise licenses priced at USD 3950.00, USD 5925.00, and USD 7900.00 respectively.
10. Is the market size provided in terms of value or volume?
The market size is provided in terms of value, measured in N/A and volume, measured in K.
11. Are there any specific market keywords associated with the report?
Yes, the market keyword associated with the report is "Dehydrated Media Plates," which aids in identifying and referencing the specific market segment covered.
12. How do I determine which pricing option suits my needs best?
The pricing options vary based on user requirements and access needs. Individual users may opt for single-user licenses, while businesses requiring broader access may choose multi-user or enterprise licenses for cost-effective access to the report.
13. Are there any additional resources or data provided in the Dehydrated Media Plates report?
While the report offers comprehensive insights, it's advisable to review the specific contents or supplementary materials provided to ascertain if additional resources or data are available.
14. How can I stay updated on further developments or reports in the Dehydrated Media Plates?
To stay informed about further developments, trends, and reports in the Dehydrated Media Plates, consider subscribing to industry newsletters, following relevant companies and organizations, or regularly checking reputable industry news sources and publications.
Methodology
Step 1 - Identification of Relevant Samples Size from Population Database


Step 2 - Approaches for Defining Global Market Size (Value, Volume* & Price*)

Note*: In applicable scenarios
Step 3 - Data Sources
Primary Research
- Web Analytics
- Survey Reports
- Research Institute
- Latest Research Reports
- Opinion Leaders
Secondary Research
- Annual Reports
- White Paper
- Latest Press Release
- Industry Association
- Paid Database
- Investor Presentations

Step 4 - Data Triangulation
Involves using different sources of information in order to increase the validity of a study
These sources are likely to be stakeholders in a program - participants, other researchers, program staff, other community members, and so on.
Then we put all data in single framework & apply various statistical tools to find out the dynamic on the market.
During the analysis stage, feedback from the stakeholder groups would be compared to determine areas of agreement as well as areas of divergence