Key Insights
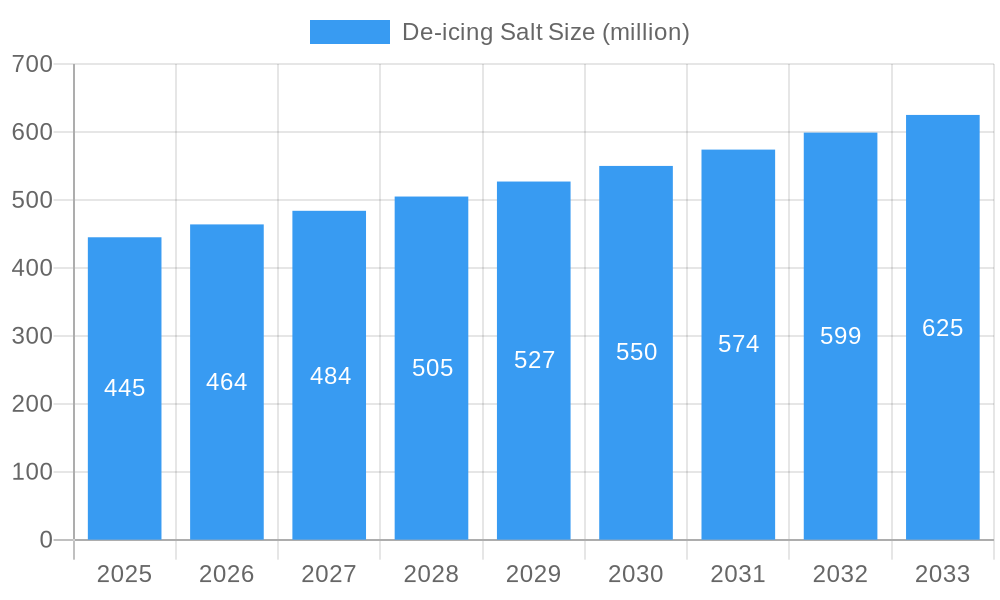
The de-icing salt market, currently valued at $445 million in 2025, is projected to experience steady growth, exhibiting a Compound Annual Growth Rate (CAGR) of 4.1% from 2025 to 2033. This growth is primarily driven by increasing infrastructure development, particularly in regions with harsh winters, leading to a higher demand for effective road de-icing solutions. Furthermore, rising awareness of road safety and the economic consequences of transportation disruptions during winter storms is bolstering the adoption of de-icing salts. Government regulations mandating safe road conditions in winter also contribute significantly to market expansion. However, environmental concerns regarding the impact of salt runoff on water bodies and vegetation pose a significant restraint on market growth. Companies are actively seeking solutions to mitigate these environmental concerns, such as developing less corrosive salt blends and promoting responsible application techniques. The market is segmented by type (sodium chloride, calcium chloride, magnesium chloride, potassium chloride), application (roads, highways, bridges, airports, parking lots), and region (North America, Europe, Asia-Pacific, etc.). Key players like Archean Group, ICL Fertilizers, Ahir Salt, and others are competing through product innovation, strategic partnerships, and regional expansion.
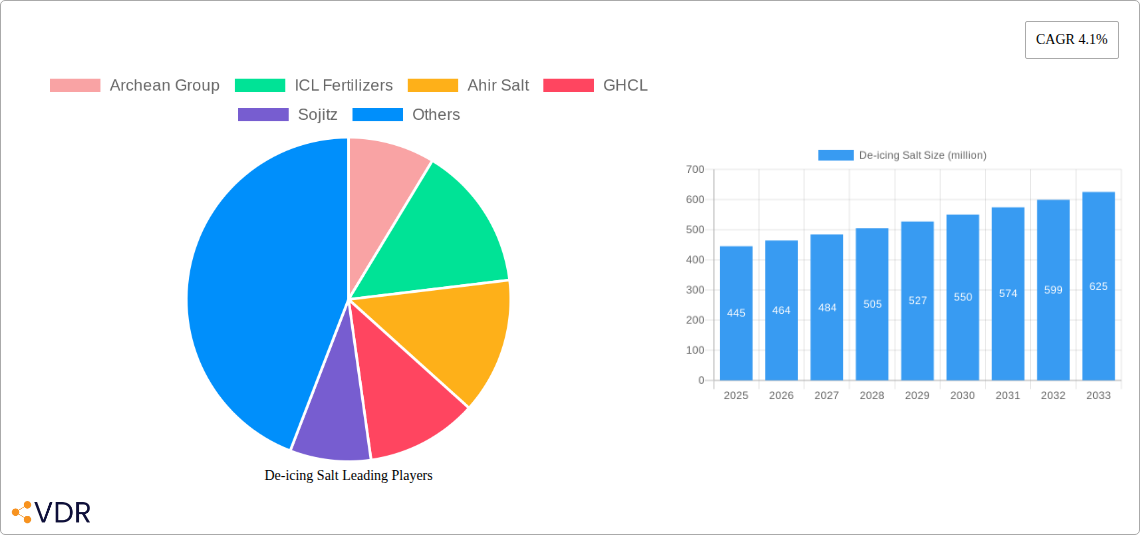
De-icing Salt Market Size (In Million)
The forecast period (2025-2033) anticipates continued market expansion, albeit at a moderate pace. The growth will likely be influenced by factors such as technological advancements in salt production and distribution, evolving government regulations on salt usage, and increasing consumer awareness of environmentally friendly de-icing alternatives. While the environmental concerns represent a challenge, the industry's focus on sustainable practices and the inherent need for efficient de-icing solutions will likely ensure continued, albeit moderated, market growth in the coming years. The competitive landscape is likely to remain dynamic with mergers, acquisitions, and new product launches shaping the industry’s trajectory.
De-icing Salt Company Market Share
De-icing Salt Market Report: 2019-2033
This comprehensive report provides a detailed analysis of the global de-icing salt market, offering invaluable insights for industry professionals, investors, and strategic decision-makers. Covering the period from 2019 to 2033, with a base year of 2025 and a forecast period of 2025-2033, this report meticulously examines market dynamics, growth trends, regional landscapes, and key players. The parent market is the broader chemical industry, while the child market focuses specifically on road de-icing and winter maintenance applications. The global market size in 2025 is estimated at xx million units.
De-icing Salt Market Dynamics & Structure
The de-icing salt market is characterized by moderate concentration, with several large players dominating alongside numerous regional producers. Technological innovation is primarily focused on enhancing product efficacy, reducing environmental impact (e.g., less corrosive formulations), and improving application methods. Stringent environmental regulations and evolving safety standards significantly influence market dynamics. Competitive substitutes include alternative de-icing agents like magnesium chloride and potassium acetate, albeit with varying effectiveness and cost implications. End-users primarily comprise government agencies (highway departments, municipalities), private contractors, and airports. M&A activity has been relatively low in recent years, with a total of xx deals recorded between 2019 and 2024.
- Market Concentration: Moderately concentrated, with top 5 players holding xx% market share in 2025.
- Technological Innovation: Focus on enhanced efficacy, environmental friendliness, and application technology.
- Regulatory Landscape: Stringent environmental regulations drive product innovation and adoption.
- Competitive Substitutes: Magnesium chloride and potassium acetate pose some competitive pressure.
- M&A Activity: xx deals recorded between 2019-2024, indicating moderate consolidation.
- Innovation Barriers: High R&D costs and regulatory hurdles hinder innovation.
De-icing Salt Growth Trends & Insights
The de-icing salt market experienced a CAGR of xx% during the historical period (2019-2024), driven by increasing infrastructure development, growing urbanization in colder climates, and consistent winter severity in several regions. Adoption rates vary significantly across regions, with developed nations exhibiting higher penetration due to established infrastructure and higher winter maintenance budgets. Technological disruptions are focused on improving efficiency and reducing environmental impact. Consumer behavior shifts primarily relate to heightened awareness of environmental concerns, leading to a preference for less damaging de-icing solutions. Market penetration is expected to reach xx% by 2033.
Dominant Regions, Countries, or Segments in De-icing Salt
North America currently holds the largest market share, primarily due to extensive road networks and a high frequency of winter storms. European countries are also significant consumers due to similar climatic conditions and well-established winter maintenance programs. The dominance of North America is attributed to higher infrastructure investment and government spending on winter maintenance. Key growth drivers include increasing urbanization, expanding transportation networks, and heightened awareness of road safety during winter.
- North America: Largest market share, driven by extensive road networks and frequent winter storms.
- Europe: Significant market share due to similar climatic conditions and established infrastructure.
- Asia-Pacific: Growing market driven by infrastructure development and urbanization.
- Key Drivers: Government spending on infrastructure, growing urbanization, increasing awareness of road safety.
De-icing Salt Product Landscape
De-icing salt products primarily consist of sodium chloride, with varying levels of purity and additives to enhance performance or minimize environmental impact. Innovations focus on formulations that reduce corrosion, improve melting efficiency at lower temperatures, and minimize environmental impact. These enhancements often come at a higher cost, representing a key trade-off for end-users.
Key Drivers, Barriers & Challenges in De-icing Salt
Key Drivers: Increasing infrastructure development in cold regions, growing urbanization, rising awareness of road safety, and government initiatives promoting efficient winter maintenance.
Challenges: Fluctuating raw material prices, environmental concerns surrounding salt runoff, and competition from alternative de-icing products. The impact of fluctuating raw material prices on profitability is estimated at xx% in 2025.
Emerging Opportunities in De-icing Salt
Emerging opportunities include the development of more environmentally friendly formulations, expansion into untapped markets (e.g., developing economies with growing infrastructure), and the use of advanced application technologies for precise and efficient de-icing.
Growth Accelerators in the De-icing Salt Industry
Long-term growth will be driven by technological advancements in salt formulations and application methods, strategic partnerships between chemical producers and winter maintenance providers, and expansion into new geographical markets. Furthermore, increased government investment in infrastructure and emphasis on road safety will significantly contribute to market expansion.
Key Players Shaping the De-icing Salt Market
- Archean Group
- ICL Fertilizers
- Ahir Salt
- GHCL
- Sojitz
- Phenix Enterprise
- Naikai Salt
- China National Salt
- 9D Group
- Yunnan Salt
- Lantai Industry
- Chengyuan Salt
- Jingshen Salt & Chemical
Notable Milestones in De-icing Salt Sector
- 2021: Introduction of a new low-chloride de-icing salt by ICL Fertilizers.
- 2022: Archean Group acquires a smaller regional salt producer, expanding its market presence.
- 2023: New environmental regulations implemented in several European countries impact the market.
- 2024: Several key players invest in developing more sustainable de-icing technologies.
In-Depth De-icing Salt Market Outlook
The de-icing salt market is poised for continued growth, driven by factors such as infrastructure development, urbanization, and increased focus on road safety. Strategic opportunities exist in the development and adoption of environmentally sustainable de-icing products and smart application technologies. Market expansion into emerging economies represents a significant growth potential, particularly in regions experiencing rapid economic development and infrastructure improvements. The market is expected to reach xx million units by 2033.
De-icing Salt Segmentation
-
1. Application
- 1.1. Road
- 1.2. Street
- 1.3. Highway
- 1.4. Others
-
2. Types
- 2.1. Natural
- 2.2. Processing
De-icing Salt Segmentation By Geography
-
1. North America
- 1.1. United States
- 1.2. Canada
- 1.3. Mexico
-
2. South America
- 2.1. Brazil
- 2.2. Argentina
- 2.3. Rest of South America
-
3. Europe
- 3.1. United Kingdom
- 3.2. Germany
- 3.3. France
- 3.4. Italy
- 3.5. Spain
- 3.6. Russia
- 3.7. Benelux
- 3.8. Nordics
- 3.9. Rest of Europe
-
4. Middle East & Africa
- 4.1. Turkey
- 4.2. Israel
- 4.3. GCC
- 4.4. North Africa
- 4.5. South Africa
- 4.6. Rest of Middle East & Africa
-
5. Asia Pacific
- 5.1. China
- 5.2. India
- 5.3. Japan
- 5.4. South Korea
- 5.5. ASEAN
- 5.6. Oceania
- 5.7. Rest of Asia Pacific

De-icing Salt Regional Market Share
Geographic Coverage of De-icing Salt
De-icing Salt REPORT HIGHLIGHTS
| Aspects | Details |
|---|---|
| Study Period | 2020-2034 |
| Base Year | 2025 |
| Estimated Year | 2026 |
| Forecast Period | 2026-2034 |
| Historical Period | 2020-2025 |
| Growth Rate | CAGR of 4.1% from 2020-2034 |
| Segmentation |
|
Table of Contents
- 1. Introduction
- 1.1. Research Scope
- 1.2. Market Segmentation
- 1.3. Research Objective
- 1.4. Definitions and Assumptions
- 2. Executive Summary
- 2.1. Market Snapshot
- 3. Market Dynamics
- 3.1. Market Drivers
- 3.2. Market Restrains
- 3.3. Market Trends
- 3.4. Market Opportunities
- 4. Market Factor Analysis
- 4.1. Porters Five Forces
- 4.1.1. Bargaining Power of Suppliers
- 4.1.2. Bargaining Power of Buyers
- 4.1.3. Threat of New Entrants
- 4.1.4. Threat of Substitutes
- 4.1.5. Competitive Rivalry
- 4.2. PESTEL analysis
- 4.3. BCG Analysis
- 4.3.1. Stars (High Growth, High Market Share)
- 4.3.2. Cash Cows (Low Growth, High Market Share)
- 4.3.3. Question Mark (High Growth, Low Market Share)
- 4.3.4. Dogs (Low Growth, Low Market Share)
- 4.4. Ansoff Matrix Analysis
- 4.5. Supply Chain Analysis
- 4.6. Regulatory Landscape
- 4.7. Current Market Potential and Opportunity Assessment (TAM–SAM–SOM Framework)
- 4.8. VDR Analyst Note
- 4.1. Porters Five Forces
- 5. Market Analysis, Insights and Forecast 2021-2033
- 5.1. Market Analysis, Insights and Forecast - by Application
- 5.1.1. Road
- 5.1.2. Street
- 5.1.3. Highway
- 5.1.4. Others
- 5.2. Market Analysis, Insights and Forecast - by Types
- 5.2.1. Natural
- 5.2.2. Processing
- 5.3. Market Analysis, Insights and Forecast - by Region
- 5.3.1. North America
- 5.3.2. South America
- 5.3.3. Europe
- 5.3.4. Middle East & Africa
- 5.3.5. Asia Pacific
- 5.1. Market Analysis, Insights and Forecast - by Application
- 6. Global De-icing Salt Analysis, Insights and Forecast, 2021-2033
- 6.1. Market Analysis, Insights and Forecast - by Application
- 6.1.1. Road
- 6.1.2. Street
- 6.1.3. Highway
- 6.1.4. Others
- 6.2. Market Analysis, Insights and Forecast - by Types
- 6.2.1. Natural
- 6.2.2. Processing
- 6.1. Market Analysis, Insights and Forecast - by Application
- 7. North America De-icing Salt Analysis, Insights and Forecast, 2021-2033
- 7.1. Market Analysis, Insights and Forecast - by Application
- 7.1.1. Road
- 7.1.2. Street
- 7.1.3. Highway
- 7.1.4. Others
- 7.2. Market Analysis, Insights and Forecast - by Types
- 7.2.1. Natural
- 7.2.2. Processing
- 7.1. Market Analysis, Insights and Forecast - by Application
- 8. South America De-icing Salt Analysis, Insights and Forecast, 2021-2033
- 8.1. Market Analysis, Insights and Forecast - by Application
- 8.1.1. Road
- 8.1.2. Street
- 8.1.3. Highway
- 8.1.4. Others
- 8.2. Market Analysis, Insights and Forecast - by Types
- 8.2.1. Natural
- 8.2.2. Processing
- 8.1. Market Analysis, Insights and Forecast - by Application
- 9. Europe De-icing Salt Analysis, Insights and Forecast, 2021-2033
- 9.1. Market Analysis, Insights and Forecast - by Application
- 9.1.1. Road
- 9.1.2. Street
- 9.1.3. Highway
- 9.1.4. Others
- 9.2. Market Analysis, Insights and Forecast - by Types
- 9.2.1. Natural
- 9.2.2. Processing
- 9.1. Market Analysis, Insights and Forecast - by Application
- 10. Middle East & Africa De-icing Salt Analysis, Insights and Forecast, 2021-2033
- 10.1. Market Analysis, Insights and Forecast - by Application
- 10.1.1. Road
- 10.1.2. Street
- 10.1.3. Highway
- 10.1.4. Others
- 10.2. Market Analysis, Insights and Forecast - by Types
- 10.2.1. Natural
- 10.2.2. Processing
- 10.1. Market Analysis, Insights and Forecast - by Application
- 11. Asia Pacific De-icing Salt Analysis, Insights and Forecast, 2021-2033
- 11.1. Market Analysis, Insights and Forecast - by Application
- 11.1.1. Road
- 11.1.2. Street
- 11.1.3. Highway
- 11.1.4. Others
- 11.2. Market Analysis, Insights and Forecast - by Types
- 11.2.1. Natural
- 11.2.2. Processing
- 11.1. Market Analysis, Insights and Forecast - by Application
- 12. Competitive Analysis
- 12.1. Company Profiles
- 12.1.1 Archean Group
- 12.1.1.1. Company Overview
- 12.1.1.2. Products
- 12.1.1.3. Company Financials
- 12.1.1.4. SWOT Analysis
- 12.1.2 ICL Fertilizers
- 12.1.2.1. Company Overview
- 12.1.2.2. Products
- 12.1.2.3. Company Financials
- 12.1.2.4. SWOT Analysis
- 12.1.3 Ahir Salt
- 12.1.3.1. Company Overview
- 12.1.3.2. Products
- 12.1.3.3. Company Financials
- 12.1.3.4. SWOT Analysis
- 12.1.4 GHCL
- 12.1.4.1. Company Overview
- 12.1.4.2. Products
- 12.1.4.3. Company Financials
- 12.1.4.4. SWOT Analysis
- 12.1.5 Sojitz
- 12.1.5.1. Company Overview
- 12.1.5.2. Products
- 12.1.5.3. Company Financials
- 12.1.5.4. SWOT Analysis
- 12.1.6 Phenix Enterprise
- 12.1.6.1. Company Overview
- 12.1.6.2. Products
- 12.1.6.3. Company Financials
- 12.1.6.4. SWOT Analysis
- 12.1.7 Naikai Salt
- 12.1.7.1. Company Overview
- 12.1.7.2. Products
- 12.1.7.3. Company Financials
- 12.1.7.4. SWOT Analysis
- 12.1.8 China National Salt
- 12.1.8.1. Company Overview
- 12.1.8.2. Products
- 12.1.8.3. Company Financials
- 12.1.8.4. SWOT Analysis
- 12.1.9 9D Group
- 12.1.9.1. Company Overview
- 12.1.9.2. Products
- 12.1.9.3. Company Financials
- 12.1.9.4. SWOT Analysis
- 12.1.10 Yunnan Salt
- 12.1.10.1. Company Overview
- 12.1.10.2. Products
- 12.1.10.3. Company Financials
- 12.1.10.4. SWOT Analysis
- 12.1.11 Lantai Industry
- 12.1.11.1. Company Overview
- 12.1.11.2. Products
- 12.1.11.3. Company Financials
- 12.1.11.4. SWOT Analysis
- 12.1.12 Chengyuan Salt
- 12.1.12.1. Company Overview
- 12.1.12.2. Products
- 12.1.12.3. Company Financials
- 12.1.12.4. SWOT Analysis
- 12.1.13 Jingshen Salt & Chemical
- 12.1.13.1. Company Overview
- 12.1.13.2. Products
- 12.1.13.3. Company Financials
- 12.1.13.4. SWOT Analysis
- 12.1.1 Archean Group
- 12.2. Market Entropy
- 12.2.1 Company's Key Areas Served
- 12.2.2 Recent Developments
- 12.3. Company Market Share Analysis 2025
- 12.3.1 Top 5 Companies Market Share Analysis
- 12.3.2 Top 3 Companies Market Share Analysis
- 12.4. List of Potential Customers
- 13. Research Methodology
List of Figures
- Figure 1: Global De-icing Salt Revenue Breakdown (million, %) by Region 2025 & 2033
- Figure 2: North America De-icing Salt Revenue (million), by Application 2025 & 2033
- Figure 3: North America De-icing Salt Revenue Share (%), by Application 2025 & 2033
- Figure 4: North America De-icing Salt Revenue (million), by Types 2025 & 2033
- Figure 5: North America De-icing Salt Revenue Share (%), by Types 2025 & 2033
- Figure 6: North America De-icing Salt Revenue (million), by Country 2025 & 2033
- Figure 7: North America De-icing Salt Revenue Share (%), by Country 2025 & 2033
- Figure 8: South America De-icing Salt Revenue (million), by Application 2025 & 2033
- Figure 9: South America De-icing Salt Revenue Share (%), by Application 2025 & 2033
- Figure 10: South America De-icing Salt Revenue (million), by Types 2025 & 2033
- Figure 11: South America De-icing Salt Revenue Share (%), by Types 2025 & 2033
- Figure 12: South America De-icing Salt Revenue (million), by Country 2025 & 2033
- Figure 13: South America De-icing Salt Revenue Share (%), by Country 2025 & 2033
- Figure 14: Europe De-icing Salt Revenue (million), by Application 2025 & 2033
- Figure 15: Europe De-icing Salt Revenue Share (%), by Application 2025 & 2033
- Figure 16: Europe De-icing Salt Revenue (million), by Types 2025 & 2033
- Figure 17: Europe De-icing Salt Revenue Share (%), by Types 2025 & 2033
- Figure 18: Europe De-icing Salt Revenue (million), by Country 2025 & 2033
- Figure 19: Europe De-icing Salt Revenue Share (%), by Country 2025 & 2033
- Figure 20: Middle East & Africa De-icing Salt Revenue (million), by Application 2025 & 2033
- Figure 21: Middle East & Africa De-icing Salt Revenue Share (%), by Application 2025 & 2033
- Figure 22: Middle East & Africa De-icing Salt Revenue (million), by Types 2025 & 2033
- Figure 23: Middle East & Africa De-icing Salt Revenue Share (%), by Types 2025 & 2033
- Figure 24: Middle East & Africa De-icing Salt Revenue (million), by Country 2025 & 2033
- Figure 25: Middle East & Africa De-icing Salt Revenue Share (%), by Country 2025 & 2033
- Figure 26: Asia Pacific De-icing Salt Revenue (million), by Application 2025 & 2033
- Figure 27: Asia Pacific De-icing Salt Revenue Share (%), by Application 2025 & 2033
- Figure 28: Asia Pacific De-icing Salt Revenue (million), by Types 2025 & 2033
- Figure 29: Asia Pacific De-icing Salt Revenue Share (%), by Types 2025 & 2033
- Figure 30: Asia Pacific De-icing Salt Revenue (million), by Country 2025 & 2033
- Figure 31: Asia Pacific De-icing Salt Revenue Share (%), by Country 2025 & 2033
List of Tables
- Table 1: Global De-icing Salt Revenue million Forecast, by Application 2020 & 2033
- Table 2: Global De-icing Salt Revenue million Forecast, by Types 2020 & 2033
- Table 3: Global De-icing Salt Revenue million Forecast, by Region 2020 & 2033
- Table 4: Global De-icing Salt Revenue million Forecast, by Application 2020 & 2033
- Table 5: Global De-icing Salt Revenue million Forecast, by Types 2020 & 2033
- Table 6: Global De-icing Salt Revenue million Forecast, by Country 2020 & 2033
- Table 7: United States De-icing Salt Revenue (million) Forecast, by Application 2020 & 2033
- Table 8: Canada De-icing Salt Revenue (million) Forecast, by Application 2020 & 2033
- Table 9: Mexico De-icing Salt Revenue (million) Forecast, by Application 2020 & 2033
- Table 10: Global De-icing Salt Revenue million Forecast, by Application 2020 & 2033
- Table 11: Global De-icing Salt Revenue million Forecast, by Types 2020 & 2033
- Table 12: Global De-icing Salt Revenue million Forecast, by Country 2020 & 2033
- Table 13: Brazil De-icing Salt Revenue (million) Forecast, by Application 2020 & 2033
- Table 14: Argentina De-icing Salt Revenue (million) Forecast, by Application 2020 & 2033
- Table 15: Rest of South America De-icing Salt Revenue (million) Forecast, by Application 2020 & 2033
- Table 16: Global De-icing Salt Revenue million Forecast, by Application 2020 & 2033
- Table 17: Global De-icing Salt Revenue million Forecast, by Types 2020 & 2033
- Table 18: Global De-icing Salt Revenue million Forecast, by Country 2020 & 2033
- Table 19: United Kingdom De-icing Salt Revenue (million) Forecast, by Application 2020 & 2033
- Table 20: Germany De-icing Salt Revenue (million) Forecast, by Application 2020 & 2033
- Table 21: France De-icing Salt Revenue (million) Forecast, by Application 2020 & 2033
- Table 22: Italy De-icing Salt Revenue (million) Forecast, by Application 2020 & 2033
- Table 23: Spain De-icing Salt Revenue (million) Forecast, by Application 2020 & 2033
- Table 24: Russia De-icing Salt Revenue (million) Forecast, by Application 2020 & 2033
- Table 25: Benelux De-icing Salt Revenue (million) Forecast, by Application 2020 & 2033
- Table 26: Nordics De-icing Salt Revenue (million) Forecast, by Application 2020 & 2033
- Table 27: Rest of Europe De-icing Salt Revenue (million) Forecast, by Application 2020 & 2033
- Table 28: Global De-icing Salt Revenue million Forecast, by Application 2020 & 2033
- Table 29: Global De-icing Salt Revenue million Forecast, by Types 2020 & 2033
- Table 30: Global De-icing Salt Revenue million Forecast, by Country 2020 & 2033
- Table 31: Turkey De-icing Salt Revenue (million) Forecast, by Application 2020 & 2033
- Table 32: Israel De-icing Salt Revenue (million) Forecast, by Application 2020 & 2033
- Table 33: GCC De-icing Salt Revenue (million) Forecast, by Application 2020 & 2033
- Table 34: North Africa De-icing Salt Revenue (million) Forecast, by Application 2020 & 2033
- Table 35: South Africa De-icing Salt Revenue (million) Forecast, by Application 2020 & 2033
- Table 36: Rest of Middle East & Africa De-icing Salt Revenue (million) Forecast, by Application 2020 & 2033
- Table 37: Global De-icing Salt Revenue million Forecast, by Application 2020 & 2033
- Table 38: Global De-icing Salt Revenue million Forecast, by Types 2020 & 2033
- Table 39: Global De-icing Salt Revenue million Forecast, by Country 2020 & 2033
- Table 40: China De-icing Salt Revenue (million) Forecast, by Application 2020 & 2033
- Table 41: India De-icing Salt Revenue (million) Forecast, by Application 2020 & 2033
- Table 42: Japan De-icing Salt Revenue (million) Forecast, by Application 2020 & 2033
- Table 43: South Korea De-icing Salt Revenue (million) Forecast, by Application 2020 & 2033
- Table 44: ASEAN De-icing Salt Revenue (million) Forecast, by Application 2020 & 2033
- Table 45: Oceania De-icing Salt Revenue (million) Forecast, by Application 2020 & 2033
- Table 46: Rest of Asia Pacific De-icing Salt Revenue (million) Forecast, by Application 2020 & 2033
Frequently Asked Questions
1. What is the projected Compound Annual Growth Rate (CAGR) of the De-icing Salt?
The projected CAGR is approximately 4.1%.
2. Which companies are prominent players in the De-icing Salt?
Key companies in the market include Archean Group, ICL Fertilizers, Ahir Salt, GHCL, Sojitz, Phenix Enterprise, Naikai Salt, China National Salt, 9D Group, Yunnan Salt, Lantai Industry, Chengyuan Salt, Jingshen Salt & Chemical.
3. What are the main segments of the De-icing Salt?
The market segments include Application, Types.
4. Can you provide details about the market size?
The market size is estimated to be USD 445 million as of 2022.
5. What are some drivers contributing to market growth?
N/A
6. What are the notable trends driving market growth?
N/A
7. Are there any restraints impacting market growth?
N/A
8. Can you provide examples of recent developments in the market?
N/A
9. What pricing options are available for accessing the report?
Pricing options include single-user, multi-user, and enterprise licenses priced at USD 4900.00, USD 7350.00, and USD 9800.00 respectively.
10. Is the market size provided in terms of value or volume?
The market size is provided in terms of value, measured in million.
11. Are there any specific market keywords associated with the report?
Yes, the market keyword associated with the report is "De-icing Salt," which aids in identifying and referencing the specific market segment covered.
12. How do I determine which pricing option suits my needs best?
The pricing options vary based on user requirements and access needs. Individual users may opt for single-user licenses, while businesses requiring broader access may choose multi-user or enterprise licenses for cost-effective access to the report.
13. Are there any additional resources or data provided in the De-icing Salt report?
While the report offers comprehensive insights, it's advisable to review the specific contents or supplementary materials provided to ascertain if additional resources or data are available.
14. How can I stay updated on further developments or reports in the De-icing Salt?
To stay informed about further developments, trends, and reports in the De-icing Salt, consider subscribing to industry newsletters, following relevant companies and organizations, or regularly checking reputable industry news sources and publications.
Methodology
Step 1 - Identification of Relevant Samples Size from Population Database


Step 2 - Approaches for Defining Global Market Size (Value, Volume* & Price*)

Note*: In applicable scenarios
Step 3 - Data Sources
Primary Research
- Web Analytics
- Survey Reports
- Research Institute
- Latest Research Reports
- Opinion Leaders
Secondary Research
- Annual Reports
- White Paper
- Latest Press Release
- Industry Association
- Paid Database
- Investor Presentations

Step 4 - Data Triangulation
Involves using different sources of information in order to increase the validity of a study
These sources are likely to be stakeholders in a program - participants, other researchers, program staff, other community members, and so on.
Then we put all data in single framework & apply various statistical tools to find out the dynamic on the market.
During the analysis stage, feedback from the stakeholder groups would be compared to determine areas of agreement as well as areas of divergence

