Market Projections for Dates Market Industry 2025-2033

Dates Market by Production Analysis, by Consumption Analysis, by Import Market Analysis (Value & Volume), by Export Market Analysis (Value & Volume), by Price Trend Analysis, by North America (United States, Canada), by Europe (Germany, United Kingdom, France, Netherlands, Italy), by Asia Pacific (India, Indonesia, Malaysia, Pakistan), by South America (Brazil, Argentina), by Middle East and Africa (Unites Arab Emirates, Saudi Arabia, Oman, Egypt, Morocco) Forecast 2025-2033

Jun 25 2025
Base Year: 2024

234 Pages
Main Logo

Market Projections for Dates Market Industry 2025-2033


Home
Industries
Agriculture
sponsor image

Tailored for you

  • In-depth Analysis Tailored to Specified Regions or Segments
  • Company Profiles Customized to User Preferences
  • Comprehensive Insights Focused on Specific Segments or Regions
  • Customized Evaluation of Competitive Landscape to Meet Your Needs
  • Tailored Customization to Address Other Specific Requirements
Ask for customization


Key Insights

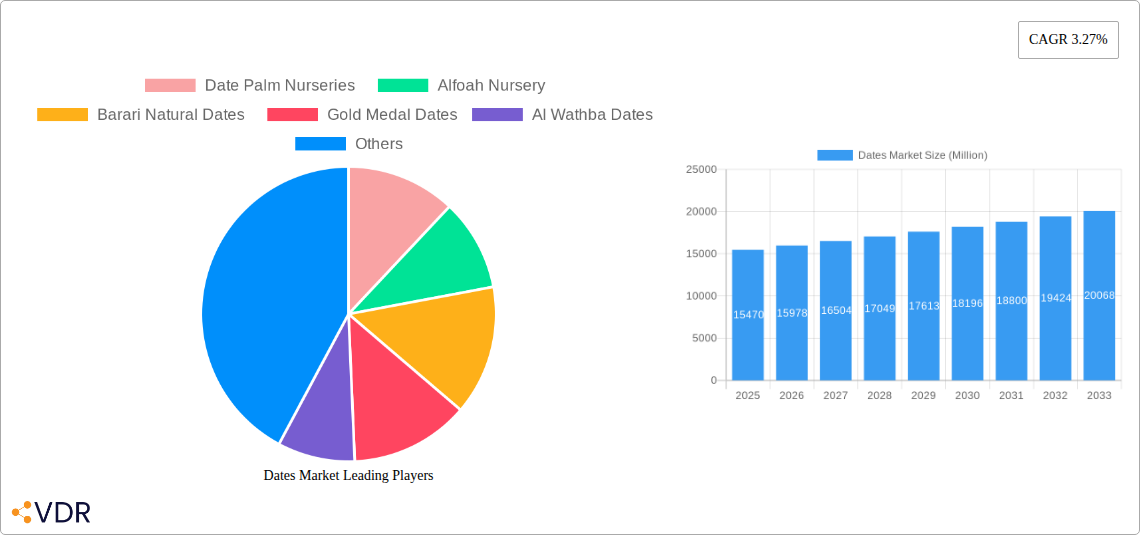
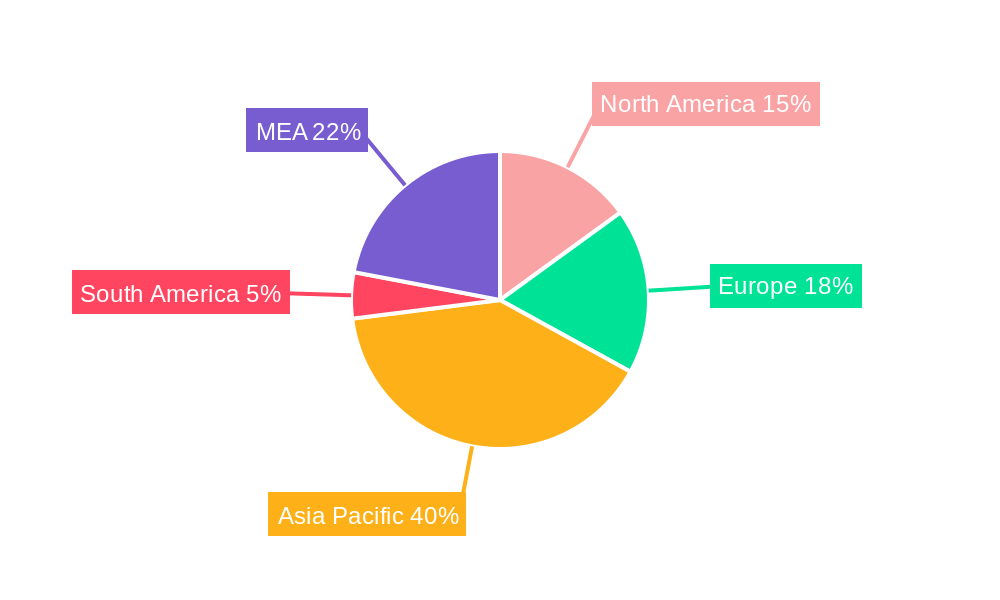
The global dates market, valued at $15.47 billion in 2025, is projected to experience steady growth, driven by increasing consumer awareness of the health benefits associated with dates. These benefits, including high fiber content, essential vitamins and minerals, and natural sweetness, are fueling demand, particularly among health-conscious consumers. The rising popularity of date-based products in the food and beverage industry, including confectionery, desserts, and energy bars, further contributes to market expansion. Significant regional variations exist, with the Middle East and Africa likely holding the largest market share due to the region's historical significance in date cultivation and consumption. Growth in other regions is anticipated, however, fueled by increased imports and diversification of date varieties available globally. While factors such as fluctuating crop yields and climate change present challenges, the ongoing innovation in date processing and product development, alongside strategic marketing initiatives highlighting the versatility and nutritional profile of dates, are expected to mitigate these restraints and drive market expansion throughout the forecast period (2025-2033).

The market segmentation reveals Medjool and Deglet Noor as leading date types, with significant demand from both the food and beverage industries. Companies like Date Palm Nurseries, Alfoah Nursery, and Gold Medal Dates are key players, leveraging their established supply chains and processing capabilities to meet the growing global demand. Future growth is likely to be shaped by factors including the expansion of date cultivation in new regions, the development of value-added date products catering to evolving consumer preferences, and the strategic partnerships between producers and brands focused on marketing and distribution. Continued research into sustainable farming practices will also play a crucial role in ensuring the long-term viability and sustainability of the dates market.

Dates Market Research Report - Market Size, Growth & Forecast

Dates Market: A Comprehensive Market Report (2019-2033)

This comprehensive report provides an in-depth analysis of the global Dates Market, covering market dynamics, growth trends, regional analysis, product landscape, key players, and future outlook. The study period spans from 2019 to 2033, with 2025 serving as the base and estimated year. This report is essential for industry professionals, investors, and anyone seeking a thorough understanding of this lucrative market. The report analyzes the parent market of dried fruits and the child market of natural sweeteners, providing a holistic view of the Dates Market's position within the broader food industry.

Dates Market Dynamics & Structure

The global Dates Market exhibits a moderately consolidated structure, with a few major players holding significant market share. Technological innovations, primarily in processing and packaging to extend shelf life and improve product quality, are key drivers. Stringent regulatory frameworks concerning food safety and labeling influence market practices. Competitive substitutes include other dried fruits and sweeteners, impacting market share dynamics. End-user demographics, particularly the growing health-conscious population favoring natural sweeteners, are significantly driving demand. Mergers and acquisitions (M&A) activity remains moderate, with a predicted xx number of deals in the last five years (2019-2024), resulting in a xx% increase in market concentration.

  • Market Concentration: Moderately consolidated (xx% market share held by top 5 players in 2024).
  • Technological Innovation: Focus on improved processing, packaging, and shelf-life extension.
  • Regulatory Landscape: Stringent food safety and labeling regulations impacting market operations.
  • Competitive Substitutes: Dried fruits, other natural and artificial sweeteners.
  • End-User Demographics: Growing health-conscious population driving demand for natural sweeteners.
  • M&A Activity: xx deals (2019-2024), leading to a xx% increase in market concentration.

Dates Market Growth Trends & Insights

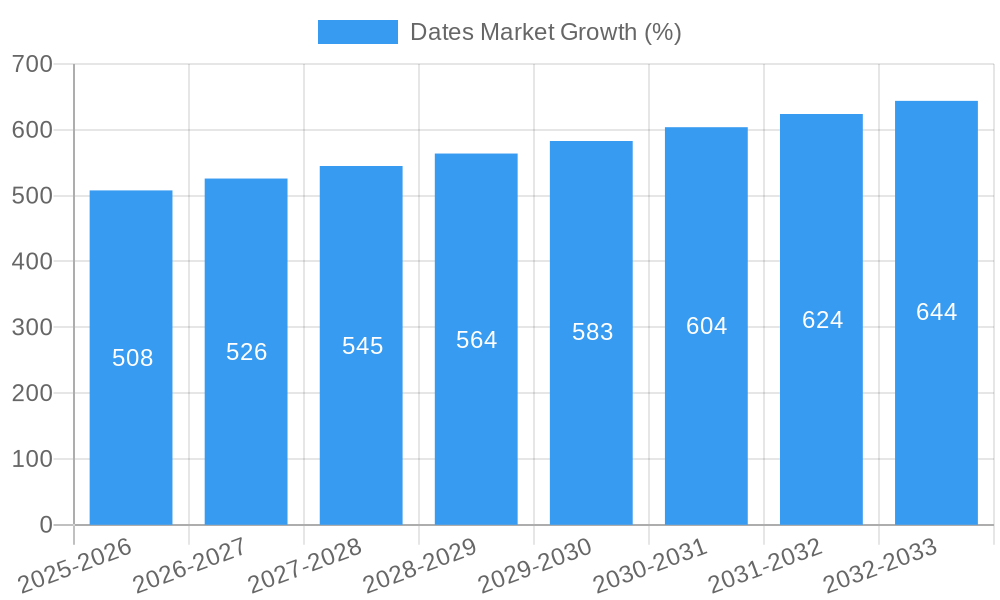
The global Dates Market witnessed robust growth during the historical period (2019-2024), expanding from xx million units in 2019 to xx million units in 2024, representing a CAGR of xx%. This growth is attributed to rising consumer preference for natural sweeteners, increasing health consciousness, and the versatility of dates in various food and beverage applications. Technological advancements in processing and preservation techniques have expanded market reach and accessibility. Consumer behavior shifts towards convenient and ready-to-eat options are also fueling growth. The market is expected to maintain a strong growth trajectory during the forecast period (2025-2033), reaching xx million units by 2033, with a projected CAGR of xx%. Market penetration within new geographic regions and emerging product applications will be key drivers for this expansion.

Dates Market Growth

Dominant Regions, Countries, or Segments in Dates Market

The Middle East and North Africa (MENA) region holds the dominant position in the global Dates Market, owing to favorable climatic conditions and a long history of date cultivation. Within this region, Saudi Arabia and Morocco are significant producers and exporters. Among the date types, Medjool commands the highest market share due to its superior flavor and texture, followed by Deglet Noor and Khalas. The Food application segment dominates overall market consumption, followed by Confectionery and Beverage applications. Growth is primarily driven by increasing demand from the food processing industry.

  • Key Growth Drivers: Favorable climatic conditions in MENA, established cultivation practices, increasing global demand for natural sweeteners.
  • Dominant Regions: Middle East and North Africa (MENA) region.
  • Leading Countries: Saudi Arabia, Morocco, UAE, Iraq.
  • Leading Date Types: Medjool, Deglet Noor, Khalas.
  • Leading Application: Food, followed by confectionery and beverage.

Dates Market Product Landscape

Product innovations focus on value-added products like date paste, date syrup, and date-based energy bars. The market offers various processing methods, impacting product quality, shelf-life, and price points. Technological advancements include improved packaging solutions to preserve freshness and enhance product appeal. Unique selling propositions (USPs) often revolve around organic certification, specific date varieties, and functional health benefits.

Key Drivers, Barriers & Challenges in Dates Market

Key Drivers: Growing consumer preference for natural sweeteners, increasing health consciousness, and expanding applications in the food and beverage industry. Rising disposable incomes in emerging economies and the versatility of dates in different culinary applications are also significant drivers.

Key Challenges: Supply chain inefficiencies, particularly in transportation and storage, can lead to significant product loss. Seasonal variability in production poses a challenge for consistent supply. Fluctuating global prices of dates impact profitability. Furthermore, competition from substitute sweeteners and increasing production costs can hinder growth.

Emerging Opportunities in Dates Market

Untapped markets in Asia and Latin America present significant growth potential. Innovative applications, such as date-based functional foods and beverages targeting specific health benefits, offer promising opportunities. Evolving consumer preferences for organic and sustainably sourced products will shape product development strategies.

Growth Accelerators in the Dates Market Industry

Technological breakthroughs in processing and packaging, improving shelf life and product quality are crucial growth catalysts. Strategic partnerships between date producers, processors, and retailers can streamline supply chains and enhance distribution efficiency. Expansion strategies focusing on new markets, particularly in developing economies with high growth potential, will drive market expansion.

Key Players Shaping the Dates Market Market

  • Date Palm Nurseries
  • Alfoah Nursery
  • Barari Natural Dates
  • Gold Medal Dates
  • Al Wathba Dates

Notable Milestones in Dates Market Sector

  • October 2022: Morocco announces a plan to double its dates production by 2030, aiming to reach 300,000 tons annually, a significant boost to global supply. This initiative, under Generation Green 2020-2030, highlights the sector's potential for expansion.
  • April 2022: Launch of the 'Saudidates' B2B e-commerce platform facilitates global trade and enhances market access for Saudi Arabian date producers.

In-Depth Dates Market Market Outlook

The Dates Market is poised for sustained growth over the forecast period, driven by increasing health awareness, innovation in product applications, and expansion into new markets. Strategic partnerships and investments in sustainable cultivation practices will play a significant role in shaping the future of this dynamic market. Opportunities abound for companies focusing on value-added products, organic certification, and efficient supply chain management. The market's continued expansion presents lucrative opportunities for both established and emerging players.

Dates Market Segmentation

  • 1. Production Analysis
  • 2. Consumption Analysis
  • 3. Import Market Analysis (Value & Volume)
  • 4. Export Market Analysis (Value & Volume)
  • 5. Price Trend Analysis

Dates Market Segmentation By Geography

  • 1. North America
    • 1.1. United States
    • 1.2. Canada
  • 2. Europe
    • 2.1. Germany
    • 2.2. United Kingdom
    • 2.3. France
    • 2.4. Netherlands
    • 2.5. Italy
  • 3. Asia Pacific
    • 3.1. India
    • 3.2. Indonesia
    • 3.3. Malaysia
    • 3.4. Pakistan
  • 4. South America
    • 4.1. Brazil
    • 4.2. Argentina
  • 5. Middle East and Africa
    • 5.1. Unites Arab Emirates
    • 5.2. Saudi Arabia
    • 5.3. Oman
    • 5.4. Egypt
    • 5.5. Morocco
Dates Market Regional Share


Dates Market REPORT HIGHLIGHTS

AspectsDetails
Study Period 2019-2033
Base Year 2024
Estimated Year 2025
Forecast Period2025-2033
Historical Period2019-2024
Growth RateCAGR of 3.27% from 2019-2033
Segmentation
    • By Production Analysis
    • By Consumption Analysis
    • By Import Market Analysis (Value & Volume)
    • By Export Market Analysis (Value & Volume)
    • By Price Trend Analysis
  • By Geography
    • North America
      • United States
      • Canada
    • Europe
      • Germany
      • United Kingdom
      • France
      • Netherlands
      • Italy
    • Asia Pacific
      • India
      • Indonesia
      • Malaysia
      • Pakistan
    • South America
      • Brazil
      • Argentina
    • Middle East and Africa
      • Unites Arab Emirates
      • Saudi Arabia
      • Oman
      • Egypt
      • Morocco


Table of Contents

  1. 1. Introduction
    • 1.1. Research Scope
    • 1.2. Market Segmentation
    • 1.3. Research Methodology
    • 1.4. Definitions and Assumptions
  2. 2. Executive Summary
    • 2.1. Introduction
  3. 3. Market Dynamics
    • 3.1. Introduction
      • 3.2. Market Drivers
        • 3.2.1. Increasing Berry Consumption for Health Benefits; Increasing Adoption of High-Technology Farm Practices; Growing Usage of Berries in the Food and Beverage Industries
      • 3.3. Market Restrains
        • 3.3.1. High Production Cost Involved in Berry Production; Increasing Disease and Pest Infestations
      • 3.4. Market Trends
        • 3.4.1. Rising Awareness of Health Benefits of Dates is Driving the Market
  4. 4. Market Factor Analysis
    • 4.1. Porters Five Forces
    • 4.2. Supply/Value Chain
    • 4.3. PESTEL analysis
    • 4.4. Market Entropy
    • 4.5. Patent/Trademark Analysis
  5. 5. Global Dates Market Analysis, Insights and Forecast, 2019-2031
    • 5.1. Market Analysis, Insights and Forecast - by Production Analysis
      • 5.2. Market Analysis, Insights and Forecast - by Consumption Analysis
        • 5.3. Market Analysis, Insights and Forecast - by Import Market Analysis (Value & Volume)
          • 5.4. Market Analysis, Insights and Forecast - by Export Market Analysis (Value & Volume)
            • 5.5. Market Analysis, Insights and Forecast - by Price Trend Analysis
              • 5.6. Market Analysis, Insights and Forecast - by Region
                • 5.6.1. North America
                • 5.6.2. Europe
                • 5.6.3. Asia Pacific
                • 5.6.4. South America
                • 5.6.5. Middle East and Africa
            • 6. North America Dates Market Analysis, Insights and Forecast, 2019-2031
              • 6.1. Market Analysis, Insights and Forecast - by Production Analysis
                • 6.2. Market Analysis, Insights and Forecast - by Consumption Analysis
                  • 6.3. Market Analysis, Insights and Forecast - by Import Market Analysis (Value & Volume)
                    • 6.4. Market Analysis, Insights and Forecast - by Export Market Analysis (Value & Volume)
                      • 6.5. Market Analysis, Insights and Forecast - by Price Trend Analysis
                      • 7. Europe Dates Market Analysis, Insights and Forecast, 2019-2031
                        • 7.1. Market Analysis, Insights and Forecast - by Production Analysis
                          • 7.2. Market Analysis, Insights and Forecast - by Consumption Analysis
                            • 7.3. Market Analysis, Insights and Forecast - by Import Market Analysis (Value & Volume)
                              • 7.4. Market Analysis, Insights and Forecast - by Export Market Analysis (Value & Volume)
                                • 7.5. Market Analysis, Insights and Forecast - by Price Trend Analysis
                                • 8. Asia Pacific Dates Market Analysis, Insights and Forecast, 2019-2031
                                  • 8.1. Market Analysis, Insights and Forecast - by Production Analysis
                                    • 8.2. Market Analysis, Insights and Forecast - by Consumption Analysis
                                      • 8.3. Market Analysis, Insights and Forecast - by Import Market Analysis (Value & Volume)
                                        • 8.4. Market Analysis, Insights and Forecast - by Export Market Analysis (Value & Volume)
                                          • 8.5. Market Analysis, Insights and Forecast - by Price Trend Analysis
                                          • 9. South America Dates Market Analysis, Insights and Forecast, 2019-2031
                                            • 9.1. Market Analysis, Insights and Forecast - by Production Analysis
                                              • 9.2. Market Analysis, Insights and Forecast - by Consumption Analysis
                                                • 9.3. Market Analysis, Insights and Forecast - by Import Market Analysis (Value & Volume)
                                                  • 9.4. Market Analysis, Insights and Forecast - by Export Market Analysis (Value & Volume)
                                                    • 9.5. Market Analysis, Insights and Forecast - by Price Trend Analysis
                                                    • 10. Middle East and Africa Dates Market Analysis, Insights and Forecast, 2019-2031
                                                      • 10.1. Market Analysis, Insights and Forecast - by Production Analysis
                                                        • 10.2. Market Analysis, Insights and Forecast - by Consumption Analysis
                                                          • 10.3. Market Analysis, Insights and Forecast - by Import Market Analysis (Value & Volume)
                                                            • 10.4. Market Analysis, Insights and Forecast - by Export Market Analysis (Value & Volume)
                                                              • 10.5. Market Analysis, Insights and Forecast - by Price Trend Analysis
                                                              • 11. North America Dates Market Analysis, Insights and Forecast, 2019-2031
                                                                  • 11.1. Market Analysis, Insights and Forecast - By Country/Sub-region
                                                                    • 11.1.1 United States
                                                                    • 11.1.2 Canada
                                                                    • 11.1.3 Mexico
                                                              • 12. Europe Dates Market Analysis, Insights and Forecast, 2019-2031
                                                                  • 12.1. Market Analysis, Insights and Forecast - By Country/Sub-region
                                                                    • 12.1.1 Germany
                                                                    • 12.1.2 United Kingdom
                                                                    • 12.1.3 France
                                                                    • 12.1.4 Spain
                                                                    • 12.1.5 Italy
                                                                    • 12.1.6 Spain
                                                                    • 12.1.7 Belgium
                                                                    • 12.1.8 Netherland
                                                                    • 12.1.9 Nordics
                                                                    • 12.1.10 Rest of Europe
                                                              • 13. Asia Pacific Dates Market Analysis, Insights and Forecast, 2019-2031
                                                                  • 13.1. Market Analysis, Insights and Forecast - By Country/Sub-region
                                                                    • 13.1.1 China
                                                                    • 13.1.2 Japan
                                                                    • 13.1.3 India
                                                                    • 13.1.4 South Korea
                                                                    • 13.1.5 Southeast Asia
                                                                    • 13.1.6 Australia
                                                                    • 13.1.7 Indonesia
                                                                    • 13.1.8 Phillipes
                                                                    • 13.1.9 Singapore
                                                                    • 13.1.10 Thailandc
                                                                    • 13.1.11 Rest of Asia Pacific
                                                              • 14. South America Dates Market Analysis, Insights and Forecast, 2019-2031
                                                                  • 14.1. Market Analysis, Insights and Forecast - By Country/Sub-region
                                                                    • 14.1.1 Brazil
                                                                    • 14.1.2 Argentina
                                                                    • 14.1.3 Peru
                                                                    • 14.1.4 Chile
                                                                    • 14.1.5 Colombia
                                                                    • 14.1.6 Ecuador
                                                                    • 14.1.7 Venezuela
                                                                    • 14.1.8 Rest of South America
                                                              • 15. MEA Dates Market Analysis, Insights and Forecast, 2019-2031
                                                                  • 15.1. Market Analysis, Insights and Forecast - By Country/Sub-region
                                                                    • 15.1.1 United Arab Emirates
                                                                    • 15.1.2 Saudi Arabia
                                                                    • 15.1.3 South Africa
                                                                    • 15.1.4 Rest of Middle East and Africa
                                                              • 16. Competitive Analysis
                                                                • 16.1. Global Market Share Analysis 2024
                                                                  • 16.2. Company Profiles
                                                                    • 16.2.1 Date Palm Nurseries
                                                                      • 16.2.1.1. Overview
                                                                      • 16.2.1.2. Products
                                                                      • 16.2.1.3. SWOT Analysis
                                                                      • 16.2.1.4. Recent Developments
                                                                      • 16.2.1.5. Financials (Based on Availability)
                                                                    • 16.2.2 Alfoah Nursery
                                                                      • 16.2.2.1. Overview
                                                                      • 16.2.2.2. Products
                                                                      • 16.2.2.3. SWOT Analysis
                                                                      • 16.2.2.4. Recent Developments
                                                                      • 16.2.2.5. Financials (Based on Availability)
                                                                    • 16.2.3 Barari Natural Dates
                                                                      • 16.2.3.1. Overview
                                                                      • 16.2.3.2. Products
                                                                      • 16.2.3.3. SWOT Analysis
                                                                      • 16.2.3.4. Recent Developments
                                                                      • 16.2.3.5. Financials (Based on Availability)
                                                                    • 16.2.4 Gold Medal Dates
                                                                      • 16.2.4.1. Overview
                                                                      • 16.2.4.2. Products
                                                                      • 16.2.4.3. SWOT Analysis
                                                                      • 16.2.4.4. Recent Developments
                                                                      • 16.2.4.5. Financials (Based on Availability)
                                                                    • 16.2.5 Al Wathba Dates
                                                                      • 16.2.5.1. Overview
                                                                      • 16.2.5.2. Products
                                                                      • 16.2.5.3. SWOT Analysis
                                                                      • 16.2.5.4. Recent Developments
                                                                      • 16.2.5.5. Financials (Based on Availability)

                                                              List of Figures

                                                              1. Figure 1: Global Dates Market Revenue Breakdown (Million, %) by Region 2024 & 2032
                                                              2. Figure 2: North America Dates Market Revenue (Million), by Country 2024 & 2032
                                                              3. Figure 3: North America Dates Market Revenue Share (%), by Country 2024 & 2032
                                                              4. Figure 4: Europe Dates Market Revenue (Million), by Country 2024 & 2032
                                                              5. Figure 5: Europe Dates Market Revenue Share (%), by Country 2024 & 2032
                                                              6. Figure 6: Asia Pacific Dates Market Revenue (Million), by Country 2024 & 2032
                                                              7. Figure 7: Asia Pacific Dates Market Revenue Share (%), by Country 2024 & 2032
                                                              8. Figure 8: South America Dates Market Revenue (Million), by Country 2024 & 2032
                                                              9. Figure 9: South America Dates Market Revenue Share (%), by Country 2024 & 2032
                                                              10. Figure 10: MEA Dates Market Revenue (Million), by Country 2024 & 2032
                                                              11. Figure 11: MEA Dates Market Revenue Share (%), by Country 2024 & 2032
                                                              12. Figure 12: North America Dates Market Revenue (Million), by Production Analysis 2024 & 2032
                                                              13. Figure 13: North America Dates Market Revenue Share (%), by Production Analysis 2024 & 2032
                                                              14. Figure 14: North America Dates Market Revenue (Million), by Consumption Analysis 2024 & 2032
                                                              15. Figure 15: North America Dates Market Revenue Share (%), by Consumption Analysis 2024 & 2032
                                                              16. Figure 16: North America Dates Market Revenue (Million), by Import Market Analysis (Value & Volume) 2024 & 2032
                                                              17. Figure 17: North America Dates Market Revenue Share (%), by Import Market Analysis (Value & Volume) 2024 & 2032
                                                              18. Figure 18: North America Dates Market Revenue (Million), by Export Market Analysis (Value & Volume) 2024 & 2032
                                                              19. Figure 19: North America Dates Market Revenue Share (%), by Export Market Analysis (Value & Volume) 2024 & 2032
                                                              20. Figure 20: North America Dates Market Revenue (Million), by Price Trend Analysis 2024 & 2032
                                                              21. Figure 21: North America Dates Market Revenue Share (%), by Price Trend Analysis 2024 & 2032
                                                              22. Figure 22: North America Dates Market Revenue (Million), by Country 2024 & 2032
                                                              23. Figure 23: North America Dates Market Revenue Share (%), by Country 2024 & 2032
                                                              24. Figure 24: Europe Dates Market Revenue (Million), by Production Analysis 2024 & 2032
                                                              25. Figure 25: Europe Dates Market Revenue Share (%), by Production Analysis 2024 & 2032
                                                              26. Figure 26: Europe Dates Market Revenue (Million), by Consumption Analysis 2024 & 2032
                                                              27. Figure 27: Europe Dates Market Revenue Share (%), by Consumption Analysis 2024 & 2032
                                                              28. Figure 28: Europe Dates Market Revenue (Million), by Import Market Analysis (Value & Volume) 2024 & 2032
                                                              29. Figure 29: Europe Dates Market Revenue Share (%), by Import Market Analysis (Value & Volume) 2024 & 2032
                                                              30. Figure 30: Europe Dates Market Revenue (Million), by Export Market Analysis (Value & Volume) 2024 & 2032
                                                              31. Figure 31: Europe Dates Market Revenue Share (%), by Export Market Analysis (Value & Volume) 2024 & 2032
                                                              32. Figure 32: Europe Dates Market Revenue (Million), by Price Trend Analysis 2024 & 2032
                                                              33. Figure 33: Europe Dates Market Revenue Share (%), by Price Trend Analysis 2024 & 2032
                                                              34. Figure 34: Europe Dates Market Revenue (Million), by Country 2024 & 2032
                                                              35. Figure 35: Europe Dates Market Revenue Share (%), by Country 2024 & 2032
                                                              36. Figure 36: Asia Pacific Dates Market Revenue (Million), by Production Analysis 2024 & 2032
                                                              37. Figure 37: Asia Pacific Dates Market Revenue Share (%), by Production Analysis 2024 & 2032
                                                              38. Figure 38: Asia Pacific Dates Market Revenue (Million), by Consumption Analysis 2024 & 2032
                                                              39. Figure 39: Asia Pacific Dates Market Revenue Share (%), by Consumption Analysis 2024 & 2032
                                                              40. Figure 40: Asia Pacific Dates Market Revenue (Million), by Import Market Analysis (Value & Volume) 2024 & 2032
                                                              41. Figure 41: Asia Pacific Dates Market Revenue Share (%), by Import Market Analysis (Value & Volume) 2024 & 2032
                                                              42. Figure 42: Asia Pacific Dates Market Revenue (Million), by Export Market Analysis (Value & Volume) 2024 & 2032
                                                              43. Figure 43: Asia Pacific Dates Market Revenue Share (%), by Export Market Analysis (Value & Volume) 2024 & 2032
                                                              44. Figure 44: Asia Pacific Dates Market Revenue (Million), by Price Trend Analysis 2024 & 2032
                                                              45. Figure 45: Asia Pacific Dates Market Revenue Share (%), by Price Trend Analysis 2024 & 2032
                                                              46. Figure 46: Asia Pacific Dates Market Revenue (Million), by Country 2024 & 2032
                                                              47. Figure 47: Asia Pacific Dates Market Revenue Share (%), by Country 2024 & 2032
                                                              48. Figure 48: South America Dates Market Revenue (Million), by Production Analysis 2024 & 2032
                                                              49. Figure 49: South America Dates Market Revenue Share (%), by Production Analysis 2024 & 2032
                                                              50. Figure 50: South America Dates Market Revenue (Million), by Consumption Analysis 2024 & 2032
                                                              51. Figure 51: South America Dates Market Revenue Share (%), by Consumption Analysis 2024 & 2032
                                                              52. Figure 52: South America Dates Market Revenue (Million), by Import Market Analysis (Value & Volume) 2024 & 2032
                                                              53. Figure 53: South America Dates Market Revenue Share (%), by Import Market Analysis (Value & Volume) 2024 & 2032
                                                              54. Figure 54: South America Dates Market Revenue (Million), by Export Market Analysis (Value & Volume) 2024 & 2032
                                                              55. Figure 55: South America Dates Market Revenue Share (%), by Export Market Analysis (Value & Volume) 2024 & 2032
                                                              56. Figure 56: South America Dates Market Revenue (Million), by Price Trend Analysis 2024 & 2032
                                                              57. Figure 57: South America Dates Market Revenue Share (%), by Price Trend Analysis 2024 & 2032
                                                              58. Figure 58: South America Dates Market Revenue (Million), by Country 2024 & 2032
                                                              59. Figure 59: South America Dates Market Revenue Share (%), by Country 2024 & 2032
                                                              60. Figure 60: Middle East and Africa Dates Market Revenue (Million), by Production Analysis 2024 & 2032
                                                              61. Figure 61: Middle East and Africa Dates Market Revenue Share (%), by Production Analysis 2024 & 2032
                                                              62. Figure 62: Middle East and Africa Dates Market Revenue (Million), by Consumption Analysis 2024 & 2032
                                                              63. Figure 63: Middle East and Africa Dates Market Revenue Share (%), by Consumption Analysis 2024 & 2032
                                                              64. Figure 64: Middle East and Africa Dates Market Revenue (Million), by Import Market Analysis (Value & Volume) 2024 & 2032
                                                              65. Figure 65: Middle East and Africa Dates Market Revenue Share (%), by Import Market Analysis (Value & Volume) 2024 & 2032
                                                              66. Figure 66: Middle East and Africa Dates Market Revenue (Million), by Export Market Analysis (Value & Volume) 2024 & 2032
                                                              67. Figure 67: Middle East and Africa Dates Market Revenue Share (%), by Export Market Analysis (Value & Volume) 2024 & 2032
                                                              68. Figure 68: Middle East and Africa Dates Market Revenue (Million), by Price Trend Analysis 2024 & 2032
                                                              69. Figure 69: Middle East and Africa Dates Market Revenue Share (%), by Price Trend Analysis 2024 & 2032
                                                              70. Figure 70: Middle East and Africa Dates Market Revenue (Million), by Country 2024 & 2032
                                                              71. Figure 71: Middle East and Africa Dates Market Revenue Share (%), by Country 2024 & 2032

                                                              List of Tables

                                                              1. Table 1: Global Dates Market Revenue Million Forecast, by Region 2019 & 2032
                                                              2. Table 2: Global Dates Market Revenue Million Forecast, by Production Analysis 2019 & 2032
                                                              3. Table 3: Global Dates Market Revenue Million Forecast, by Consumption Analysis 2019 & 2032
                                                              4. Table 4: Global Dates Market Revenue Million Forecast, by Import Market Analysis (Value & Volume) 2019 & 2032
                                                              5. Table 5: Global Dates Market Revenue Million Forecast, by Export Market Analysis (Value & Volume) 2019 & 2032
                                                              6. Table 6: Global Dates Market Revenue Million Forecast, by Price Trend Analysis 2019 & 2032
                                                              7. Table 7: Global Dates Market Revenue Million Forecast, by Region 2019 & 2032
                                                              8. Table 8: Global Dates Market Revenue Million Forecast, by Country 2019 & 2032
                                                              9. Table 9: United States Dates Market Revenue (Million) Forecast, by Application 2019 & 2032
                                                              10. Table 10: Canada Dates Market Revenue (Million) Forecast, by Application 2019 & 2032
                                                              11. Table 11: Mexico Dates Market Revenue (Million) Forecast, by Application 2019 & 2032
                                                              12. Table 12: Global Dates Market Revenue Million Forecast, by Country 2019 & 2032
                                                              13. Table 13: Germany Dates Market Revenue (Million) Forecast, by Application 2019 & 2032
                                                              14. Table 14: United Kingdom Dates Market Revenue (Million) Forecast, by Application 2019 & 2032
                                                              15. Table 15: France Dates Market Revenue (Million) Forecast, by Application 2019 & 2032
                                                              16. Table 16: Spain Dates Market Revenue (Million) Forecast, by Application 2019 & 2032
                                                              17. Table 17: Italy Dates Market Revenue (Million) Forecast, by Application 2019 & 2032
                                                              18. Table 18: Spain Dates Market Revenue (Million) Forecast, by Application 2019 & 2032
                                                              19. Table 19: Belgium Dates Market Revenue (Million) Forecast, by Application 2019 & 2032
                                                              20. Table 20: Netherland Dates Market Revenue (Million) Forecast, by Application 2019 & 2032
                                                              21. Table 21: Nordics Dates Market Revenue (Million) Forecast, by Application 2019 & 2032
                                                              22. Table 22: Rest of Europe Dates Market Revenue (Million) Forecast, by Application 2019 & 2032
                                                              23. Table 23: Global Dates Market Revenue Million Forecast, by Country 2019 & 2032
                                                              24. Table 24: China Dates Market Revenue (Million) Forecast, by Application 2019 & 2032
                                                              25. Table 25: Japan Dates Market Revenue (Million) Forecast, by Application 2019 & 2032
                                                              26. Table 26: India Dates Market Revenue (Million) Forecast, by Application 2019 & 2032
                                                              27. Table 27: South Korea Dates Market Revenue (Million) Forecast, by Application 2019 & 2032
                                                              28. Table 28: Southeast Asia Dates Market Revenue (Million) Forecast, by Application 2019 & 2032
                                                              29. Table 29: Australia Dates Market Revenue (Million) Forecast, by Application 2019 & 2032
                                                              30. Table 30: Indonesia Dates Market Revenue (Million) Forecast, by Application 2019 & 2032
                                                              31. Table 31: Phillipes Dates Market Revenue (Million) Forecast, by Application 2019 & 2032
                                                              32. Table 32: Singapore Dates Market Revenue (Million) Forecast, by Application 2019 & 2032
                                                              33. Table 33: Thailandc Dates Market Revenue (Million) Forecast, by Application 2019 & 2032
                                                              34. Table 34: Rest of Asia Pacific Dates Market Revenue (Million) Forecast, by Application 2019 & 2032
                                                              35. Table 35: Global Dates Market Revenue Million Forecast, by Country 2019 & 2032
                                                              36. Table 36: Brazil Dates Market Revenue (Million) Forecast, by Application 2019 & 2032
                                                              37. Table 37: Argentina Dates Market Revenue (Million) Forecast, by Application 2019 & 2032
                                                              38. Table 38: Peru Dates Market Revenue (Million) Forecast, by Application 2019 & 2032
                                                              39. Table 39: Chile Dates Market Revenue (Million) Forecast, by Application 2019 & 2032
                                                              40. Table 40: Colombia Dates Market Revenue (Million) Forecast, by Application 2019 & 2032
                                                              41. Table 41: Ecuador Dates Market Revenue (Million) Forecast, by Application 2019 & 2032
                                                              42. Table 42: Venezuela Dates Market Revenue (Million) Forecast, by Application 2019 & 2032
                                                              43. Table 43: Rest of South America Dates Market Revenue (Million) Forecast, by Application 2019 & 2032
                                                              44. Table 44: Global Dates Market Revenue Million Forecast, by Country 2019 & 2032
                                                              45. Table 45: United Arab Emirates Dates Market Revenue (Million) Forecast, by Application 2019 & 2032
                                                              46. Table 46: Saudi Arabia Dates Market Revenue (Million) Forecast, by Application 2019 & 2032
                                                              47. Table 47: South Africa Dates Market Revenue (Million) Forecast, by Application 2019 & 2032
                                                              48. Table 48: Rest of Middle East and Africa Dates Market Revenue (Million) Forecast, by Application 2019 & 2032
                                                              49. Table 49: Global Dates Market Revenue Million Forecast, by Production Analysis 2019 & 2032
                                                              50. Table 50: Global Dates Market Revenue Million Forecast, by Consumption Analysis 2019 & 2032
                                                              51. Table 51: Global Dates Market Revenue Million Forecast, by Import Market Analysis (Value & Volume) 2019 & 2032
                                                              52. Table 52: Global Dates Market Revenue Million Forecast, by Export Market Analysis (Value & Volume) 2019 & 2032
                                                              53. Table 53: Global Dates Market Revenue Million Forecast, by Price Trend Analysis 2019 & 2032
                                                              54. Table 54: Global Dates Market Revenue Million Forecast, by Country 2019 & 2032
                                                              55. Table 55: United States Dates Market Revenue (Million) Forecast, by Application 2019 & 2032
                                                              56. Table 56: Canada Dates Market Revenue (Million) Forecast, by Application 2019 & 2032
                                                              57. Table 57: Global Dates Market Revenue Million Forecast, by Production Analysis 2019 & 2032
                                                              58. Table 58: Global Dates Market Revenue Million Forecast, by Consumption Analysis 2019 & 2032
                                                              59. Table 59: Global Dates Market Revenue Million Forecast, by Import Market Analysis (Value & Volume) 2019 & 2032
                                                              60. Table 60: Global Dates Market Revenue Million Forecast, by Export Market Analysis (Value & Volume) 2019 & 2032
                                                              61. Table 61: Global Dates Market Revenue Million Forecast, by Price Trend Analysis 2019 & 2032
                                                              62. Table 62: Global Dates Market Revenue Million Forecast, by Country 2019 & 2032
                                                              63. Table 63: Germany Dates Market Revenue (Million) Forecast, by Application 2019 & 2032
                                                              64. Table 64: United Kingdom Dates Market Revenue (Million) Forecast, by Application 2019 & 2032
                                                              65. Table 65: France Dates Market Revenue (Million) Forecast, by Application 2019 & 2032
                                                              66. Table 66: Netherlands Dates Market Revenue (Million) Forecast, by Application 2019 & 2032
                                                              67. Table 67: Italy Dates Market Revenue (Million) Forecast, by Application 2019 & 2032
                                                              68. Table 68: Global Dates Market Revenue Million Forecast, by Production Analysis 2019 & 2032
                                                              69. Table 69: Global Dates Market Revenue Million Forecast, by Consumption Analysis 2019 & 2032
                                                              70. Table 70: Global Dates Market Revenue Million Forecast, by Import Market Analysis (Value & Volume) 2019 & 2032
                                                              71. Table 71: Global Dates Market Revenue Million Forecast, by Export Market Analysis (Value & Volume) 2019 & 2032
                                                              72. Table 72: Global Dates Market Revenue Million Forecast, by Price Trend Analysis 2019 & 2032
                                                              73. Table 73: Global Dates Market Revenue Million Forecast, by Country 2019 & 2032
                                                              74. Table 74: India Dates Market Revenue (Million) Forecast, by Application 2019 & 2032
                                                              75. Table 75: Indonesia Dates Market Revenue (Million) Forecast, by Application 2019 & 2032
                                                              76. Table 76: Malaysia Dates Market Revenue (Million) Forecast, by Application 2019 & 2032
                                                              77. Table 77: Pakistan Dates Market Revenue (Million) Forecast, by Application 2019 & 2032
                                                              78. Table 78: Global Dates Market Revenue Million Forecast, by Production Analysis 2019 & 2032
                                                              79. Table 79: Global Dates Market Revenue Million Forecast, by Consumption Analysis 2019 & 2032
                                                              80. Table 80: Global Dates Market Revenue Million Forecast, by Import Market Analysis (Value & Volume) 2019 & 2032
                                                              81. Table 81: Global Dates Market Revenue Million Forecast, by Export Market Analysis (Value & Volume) 2019 & 2032
                                                              82. Table 82: Global Dates Market Revenue Million Forecast, by Price Trend Analysis 2019 & 2032
                                                              83. Table 83: Global Dates Market Revenue Million Forecast, by Country 2019 & 2032
                                                              84. Table 84: Brazil Dates Market Revenue (Million) Forecast, by Application 2019 & 2032
                                                              85. Table 85: Argentina Dates Market Revenue (Million) Forecast, by Application 2019 & 2032
                                                              86. Table 86: Global Dates Market Revenue Million Forecast, by Production Analysis 2019 & 2032
                                                              87. Table 87: Global Dates Market Revenue Million Forecast, by Consumption Analysis 2019 & 2032
                                                              88. Table 88: Global Dates Market Revenue Million Forecast, by Import Market Analysis (Value & Volume) 2019 & 2032
                                                              89. Table 89: Global Dates Market Revenue Million Forecast, by Export Market Analysis (Value & Volume) 2019 & 2032
                                                              90. Table 90: Global Dates Market Revenue Million Forecast, by Price Trend Analysis 2019 & 2032
                                                              91. Table 91: Global Dates Market Revenue Million Forecast, by Country 2019 & 2032
                                                              92. Table 92: Unites Arab Emirates Dates Market Revenue (Million) Forecast, by Application 2019 & 2032
                                                              93. Table 93: Saudi Arabia Dates Market Revenue (Million) Forecast, by Application 2019 & 2032
                                                              94. Table 94: Oman Dates Market Revenue (Million) Forecast, by Application 2019 & 2032
                                                              95. Table 95: Egypt Dates Market Revenue (Million) Forecast, by Application 2019 & 2032
                                                              96. Table 96: Morocco Dates Market Revenue (Million) Forecast, by Application 2019 & 2032


                                                              Frequently Asked Questions

                                                              1. What is the projected Compound Annual Growth Rate (CAGR) of the Dates Market?

                                                              The projected CAGR is approximately 3.27%.

                                                              2. Which companies are prominent players in the Dates Market?

                                                              Key companies in the market include Date Palm Nurseries , Alfoah Nursery , Barari Natural Dates , Gold Medal Dates, Al Wathba Dates .

                                                              3. What are the main segments of the Dates Market?

                                                              The market segments include Production Analysis, Consumption Analysis, Import Market Analysis (Value & Volume), Export Market Analysis (Value & Volume), Price Trend Analysis.

                                                              4. Can you provide details about the market size?

                                                              The market size is estimated to be USD 15.47 Million as of 2022.

                                                              5. What are some drivers contributing to market growth?

                                                              Increasing Berry Consumption for Health Benefits; Increasing Adoption of High-Technology Farm Practices; Growing Usage of Berries in the Food and Beverage Industries.

                                                              6. What are the notable trends driving market growth?

                                                              Rising Awareness of Health Benefits of Dates is Driving the Market.

                                                              7. Are there any restraints impacting market growth?

                                                              High Production Cost Involved in Berry Production; Increasing Disease and Pest Infestations.

                                                              8. Can you provide examples of recent developments in the market?

                                                              October 2022: Morocco aims to double its dates production by 2030 to reach 300,000 tons per year, against 149,000 tons in 2021, according to data from the Ministry of Agriculture, Maritime Fisheries, Rural Development and Water and Forests. This goal will be achieved through the implementation of the new strategy Generation Green 2020-2030 for the development of the sector of date palm aims to continue the rehabilitation of the traditional palm grove and the extension of plantations outside the palm grove.

                                                              9. What pricing options are available for accessing the report?

                                                              Pricing options include single-user, multi-user, and enterprise licenses priced at USD 4750, USD 5250, and USD 8750 respectively.

                                                              10. Is the market size provided in terms of value or volume?

                                                              The market size is provided in terms of value, measured in Million.

                                                              11. Are there any specific market keywords associated with the report?

                                                              Yes, the market keyword associated with the report is "Dates Market," which aids in identifying and referencing the specific market segment covered.

                                                              12. How do I determine which pricing option suits my needs best?

                                                              The pricing options vary based on user requirements and access needs. Individual users may opt for single-user licenses, while businesses requiring broader access may choose multi-user or enterprise licenses for cost-effective access to the report.

                                                              13. Are there any additional resources or data provided in the Dates Market report?

                                                              While the report offers comprehensive insights, it's advisable to review the specific contents or supplementary materials provided to ascertain if additional resources or data are available.

                                                              14. How can I stay updated on further developments or reports in the Dates Market?

                                                              To stay informed about further developments, trends, and reports in the Dates Market, consider subscribing to industry newsletters, following relevant companies and organizations, or regularly checking reputable industry news sources and publications.


                                                              Methodology

                                                              Step 1 - Identification of Relevant Samples Size from Population Database

                                                              Step Chart
                                                              Bar Chart
                                                              Method Chart

                                                              Step 2 - Approaches for Defining Global Market Size (Value, Volume* & Price*)

                                                              Approach Chart
                                                              Top-down and bottom-up approaches are used to validate the global market size and estimate the market size for manufactures, regional segments, product, and application.

                                                              Note*: In applicable scenarios

                                                              Step 3 - Data Sources

                                                              Primary Research

                                                              • Web Analytics
                                                              • Survey Reports
                                                              • Research Institute
                                                              • Latest Research Reports
                                                              • Opinion Leaders

                                                              Secondary Research

                                                              • Annual Reports
                                                              • White Paper
                                                              • Latest Press Release
                                                              • Industry Association
                                                              • Paid Database
                                                              • Investor Presentations
                                                              Analyst Chart

                                                              Step 4 - Data Triangulation

                                                              Involves using different sources of information in order to increase the validity of a study

                                                              These sources are likely to be stakeholders in a program - participants, other researchers, program staff, other community members, and so on.

                                                              Then we put all data in single framework & apply various statistical tools to find out the dynamic on the market.

                                                              During the analysis stage, feedback from the stakeholder groups would be compared to determine areas of agreement as well as areas of divergence

                                                              Additionally, after gathering mixed and scattered data from a wide range of sources, data is triangulated and correlated to come up with estimated figures which are further validated through primary mediums or industry experts, opinion leaders.

                                                              About Visionary Data Reports

                                                              Visionary Data Reports provides future-focused market research, advanced analytics, and strategic insights for technology, healthcare, green energy, and finance. Our reports help you anticipate trends, innovate, and lead in your industry. Our expert team combines primary research, data science, and industry knowledge to deliver actionable intelligence. We offer syndicated reports, custom analytics, and consulting services tailored to your business needs. At Visionary Data Reports, we are committed to quality, transparency, and client satisfaction. Every report is rigorously validated to ensure accuracy and relevance. Our global perspective and forward-thinking approach help you understand both current and emerging market dynamics.

                                                              Stay ahead with Visionary Data Reports. Subscribe to our newsletter for the latest insights and research highlights, and follow us on social media for real-time updates. Visionary Data Reports – Your Guide to Tomorrow’s Opportunities.

                                                              artwork spiralartwork spiralRelated Reports
                                                              artwork underline

                                                              North America Specialty Fertilizer Market 2025-2033 Overview: Trends, Competitor Dynamics, and Opportunities

                                                              The North American specialty fertilizer market is experiencing robust growth, driven by precision agriculture, sustainable farming practices, and demand for high-yield crops. Explore market size, CAGR, key players (Koch Industries, Mosaic, Nutrien), and regional trends (US, Canada, Mexico) in this in-depth analysis. Discover opportunities and challenges in the liquid, slow-release, and water-soluble fertilizer segments.

                                                              July 2025
                                                              Base Year: 2024
                                                              No Of Pages: 197
                                                              Price: $3800

                                                              Europe Chia Seeds Market Market’s Role in Emerging Tech: Insights and Projections 2025-2033

                                                              Discover the booming European chia seeds market! This in-depth analysis reveals market size, CAGR, key players (The Chia Company, Salba, Nutiva), and growth drivers. Explore trends in packaging, applications (food, supplements, personal care), and regional variations. Learn how this €414.20 million market is poised for significant expansion.

                                                              July 2025
                                                              Base Year: 2024
                                                              No Of Pages: 180
                                                              Price: $4750

                                                              Drivers of Change in Thailand Vegetable Seed Market Market 2025-2033

                                                              Discover the thriving Thailand vegetable seed market's growth trajectory (CAGR 5.20%), driven by consumer demand and technological advancements. Explore market segmentation, key players, and challenges impacting this dynamic sector projected to reach $XXX million by 2033.

                                                              July 2025
                                                              Base Year: 2024
                                                              No Of Pages: 150
                                                              Price: $3800

                                                              Consumer Trends Driving Indonesia Fungicide Market Market Growth

                                                              Discover the booming Indonesia Fungicide Market! This report reveals a projected 16.50% CAGR from 2025-2033, driven by rising disease prevalence, advanced application methods, and government support. Learn about market size, key players (Bayer, Syngenta, BASF), and future trends impacting this dynamic agricultural sector.

                                                              July 2025
                                                              Base Year: 2024
                                                              No Of Pages: 197
                                                              Price: $3800

                                                              Tomato Seed Market 2025-2033 Overview: Trends, Competitor Dynamics, and Opportunities

                                                              Discover the booming global tomato seed market! This comprehensive analysis reveals key trends, growth drivers (hybrid seeds, protected cultivation), restraints, and regional insights (Asia-Pacific leading) for the period 2019-2033, featuring top players like Sakata Seeds and Syngenta. Projected CAGR of 4.70% showcases significant investment opportunities.

                                                              July 2025
                                                              Base Year: 2024
                                                              No Of Pages: 180
                                                              Price: $3800

                                                              Emerging Trends in Brazil Maize Market: A Technology Perspective 2025-2033

                                                              Discover the dynamic Brazil maize market forecast (2025-2033)! This in-depth analysis reveals key growth drivers, including animal feed, biofuel, and human consumption, alongside major players like Syngenta and Corteva. Explore market size, CAGR, and regional insights to understand this lucrative opportunity.

                                                              July 2025
                                                              Base Year: 2024
                                                              No Of Pages: 180
                                                              Price: $3800

                                                              Future Forecasts for North America Seed Treatment Market Industry Growth

                                                              Discover the booming North American seed treatment market! This in-depth analysis reveals a CAGR of 4.20% (2025-2033), driven by precision farming, pest control needs, and government support. Explore key players, market segments (fungicides, insecticides, crops), and regional trends in the US, Canada, and Mexico. Get the data-driven insights you need to succeed.

                                                              July 2025
                                                              Base Year: 2024
                                                              No Of Pages: 150
                                                              Price: $3800

                                                              Africa Chia Seeds Industry Market’s Drivers and Challenges: Strategic Overview 2025-2033

                                                              Discover the booming African chia seed market! Our analysis reveals a $13.87M market in 2025, projected to grow at a 2.10% CAGR through 2033. Explore key trends, segments (organic, hybrid, processed, omega-3 rich), applications (food & beverage, supplements, personal care), and leading companies. Get insights for investment and market entry.

                                                              July 2025
                                                              Base Year: 2024
                                                              No Of Pages: 180
                                                              Price: $4750

                                                              Strategic Trends in Asia-Pacific Seed Coating Materials Market Market 2025-2033

                                                              The Asia-Pacific seed coating materials market is booming, with an 8% CAGR. Discover key trends, leading companies (BASF, Bayer), and segment analysis (polymers, colorants) driving growth in this $XX million market. Explore the forecast to 2033.

                                                              July 2025
                                                              Base Year: 2024
                                                              No Of Pages: 150
                                                              Price: $3800

                                                              Comprehensive Review of UK Fruits and Vegetables Market Growth Potential

                                                              Discover the booming UK fruits and vegetables market! This in-depth analysis reveals a £31.58 billion market with a 2.97% CAGR (2025-2033), driven by health trends and major players like Tesco and Sainsbury's. Explore regional data, consumption patterns, and future growth potential.

                                                              July 2025
                                                              Base Year: 2024
                                                              No Of Pages: 180
                                                              Price: $3800

                                                              Malaysia Agrochemical Market Market’s Drivers and Challenges: Strategic Overview 2025-2033

                                                              Discover the booming Malaysian agrochemical market! This comprehensive analysis reveals a RM 679.59 million market in 2025, projected to grow at a 4.56% CAGR until 2033. Explore key drivers, trends, restraints, and leading companies shaping this dynamic sector. Learn about fertilizers, pesticides, and other agrochemical segments.

                                                              July 2025
                                                              Base Year: 2024
                                                              No Of Pages: 150
                                                              Price: $3800

                                                              Drivers of Change in Agricultural Surfactant Market Market 2025-2033

                                                              The global agricultural surfactant market is booming, projected to reach $3.56 billion by 2033 with a 6.70% CAGR. Driven by precision agriculture and sustainable farming, this market analysis explores key segments (anionic, nonionic, bio-based), top players (BASF, Clariant), and regional growth trends. Discover the future of agricultural surfactants.

                                                              July 2025
                                                              Base Year: 2024
                                                              No Of Pages: 234
                                                              Price: $4750

                                                              Cameroon Grains Industry Industry Analysis and Consumer Behavior

                                                              Discover the booming Cameroon grains industry! Explore market size, growth trends (4.80% CAGR), key players (Sodecoton, CDC, etc.), and challenges impacting cereals, pulses, and oilseeds in Cameroon from 2019-2033. Invest wisely in this promising African market.

                                                              July 2025
                                                              Base Year: 2024
                                                              No Of Pages: 180
                                                              Price: $3800

                                                              Analyzing Consumer Behavior in Agriculture Market in Tanzania Market

                                                              Discover the booming Tanzanian agriculture market! Projected to reach $17.44 billion in 2025, with a 5.63% CAGR, this report analyzes market size, key players (Syngenta, Rijk Zwaan), growth drivers, and future trends in Tanzania's agricultural sector. Explore market segments, including food crops and investment opportunities.

                                                              July 2025
                                                              Base Year: 2024
                                                              No Of Pages: 150
                                                              Price: $3800

                                                              Analyzing Consumer Behavior in Artificial Intelligence in Agriculture Industry Market

                                                              Discover the booming AI in Agriculture market! This comprehensive analysis reveals a 4.20% CAGR, key drivers, trends, restraints, and regional insights from 2019-2033. Learn about leading companies and applications like precision farming, drone analytics, and weather tracking. Explore market size projections and future growth potential.

                                                              July 2025
                                                              Base Year: 2024
                                                              No Of Pages: 150
                                                              Price: $4750

                                                              Exploring Forestry Machinery Market’s Market Size Dynamics 2025-2033

                                                              The global forestry machinery market is booming, projected to reach $15 billion by 2033, driven by rising timber demand and technological advancements. Explore market trends, key players (Deere, Komatsu, etc.), and regional growth in our comprehensive analysis.

                                                              July 2025
                                                              Base Year: 2024
                                                              No Of Pages: 150
                                                              Price: $4750

                                                              Nutrition Canary Seed Market Competitive Strategies: Trends and Forecasts 2025-2033

                                                              Discover the booming nutrition canary seed market! Explore key trends, growth drivers, and regional market share projections for 2025-2033. Learn about leading companies and the increasing demand driven by health-conscious consumers and the birdseed industry.

                                                              July 2025
                                                              Base Year: 2024
                                                              No Of Pages: 234
                                                              Price: $4750

                                                              Consumer Behavior and Cashews Market in South America Trends

                                                              Discover the booming South American cashew market! This comprehensive analysis reveals a $582.24 million market in 2025, projected to grow at a 5.20% CAGR through 2033. Explore key trends, drivers, and leading companies shaping this lucrative industry.

                                                              July 2025
                                                              Base Year: 2024
                                                              No Of Pages: 180
                                                              Price: $3800

                                                              Strategic Growth Drivers for Rye Industry Market

                                                              Discover the latest market analysis of the global rye industry, projecting a steady CAGR of 2.20% to 2033. Explore key drivers, restraints, and regional trends impacting the growth of rye in food, feed, and beverage applications. Learn about leading companies and future market opportunities.

                                                              July 2025
                                                              Base Year: 2024
                                                              No Of Pages: 234
                                                              Price: $4750

                                                              Comprehensive Overview of Water Soluble Fertilizer Industry Trends: 2025-2033

                                                              Discover the booming water-soluble fertilizer market! Explore its $XX million valuation in 2025, projected 3.80% CAGR growth to 2033, key drivers, trends, and regional insights. Learn about top players and lucrative segments like fertigation and horticultural crops.

                                                              July 2025
                                                              Base Year: 2024
                                                              No Of Pages: 150
                                                              Price: $3800
                                                              • Home
                                                              • About Us
                                                              • Industries
                                                                • Aerospace & Defense
                                                                • Agriculture
                                                                • Animal Nutrition & Wellness
                                                                • Automotive
                                                                • Chemicals & Materials
                                                                • Consumer Goods and Services
                                                                • Energy & Power
                                                                • Financial Services and Investment Intelligence
                                                                • Food & Beverage
                                                                • Home and Property Improvement
                                                                • Hospitality and Tourism
                                                                • Logistics
                                                                • Manufacturing Products and Services
                                                                • Packaging
                                                                • Professional and Commercial Services
                                                                • Real Estate and Construction
                                                                • Retail
                                                                • Technology, Media and Telecom
                                                                • Healthcare
                                                              • Services
                                                              • Contact
                                                              Main Logo
                                                              • Home
                                                              • About Us
                                                              • Industries
                                                                • Aerospace & Defense
                                                                • Agriculture
                                                                • Animal Nutrition & Wellness
                                                                • Automotive
                                                                • Chemicals & Materials
                                                                • Consumer Goods and Services
                                                                • Energy & Power
                                                                • Financial Services and Investment Intelligence
                                                                • Food & Beverage
                                                                • Home and Property Improvement
                                                                • Hospitality and Tourism
                                                                • Logistics
                                                                • Manufacturing Products and Services
                                                                • Packaging
                                                                • Professional and Commercial Services
                                                                • Real Estate and Construction
                                                                • Retail
                                                                • Technology, Media and Telecom
                                                                • Healthcare
                                                              • Services
                                                              • Contact
                                                              +17162654855
                                                              [email protected]

                                                              +17162654855

                                                              [email protected]

                                                              Business Address

                                                              Head Office

                                                              Office no. A 5010, fifth floor, Solitaire Business Hub, Near Phoenix mall, Pune, Maharashtra 411014

                                                              Contact Information

                                                              Craig Francis

                                                              Business Development Head

                                                              +17162654855

                                                              [email protected]

                                                              Connect With Us

                                                              Secure Payment Partners

                                                              payment image
                                                              RetailLogisticsPackagingAutomotiveHealthcareAgricultureEnergy & PowerFood & BeverageAerospace & DefenseChemicals & MaterialsHospitality and TourismAnimal Nutrition & WellnessConsumer Goods and ServicesReal Estate and ConstructionHome and Property ImprovementTechnology, Media and TelecomManufacturing Products and ServicesFinancial Services and Investment Intelligence

                                                              © 2025 All rights reserved


                                                              Privacy Policy
                                                              Terms and Conditions
                                                              FAQ