
Key Insights
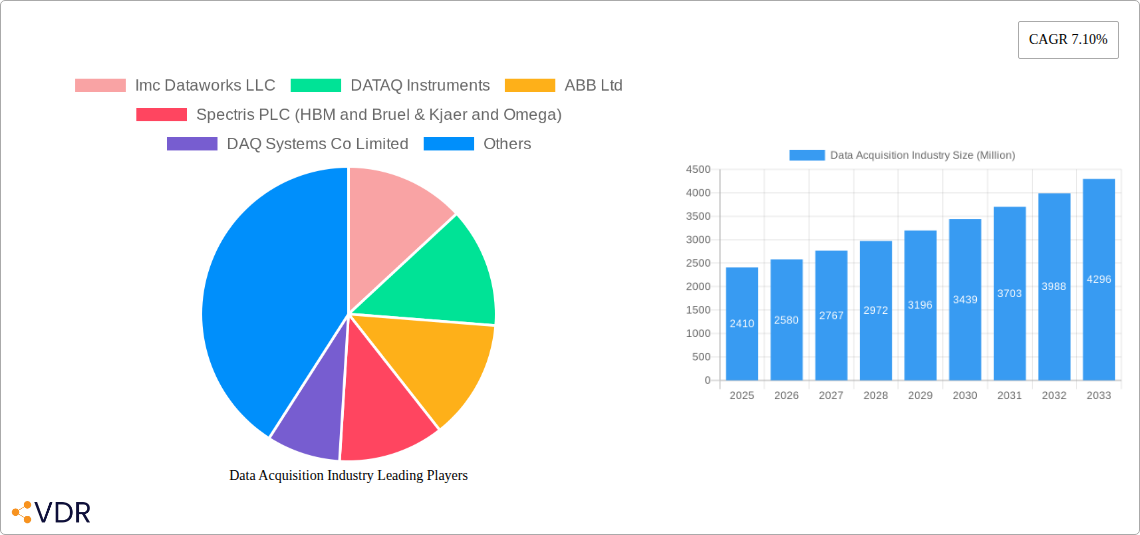
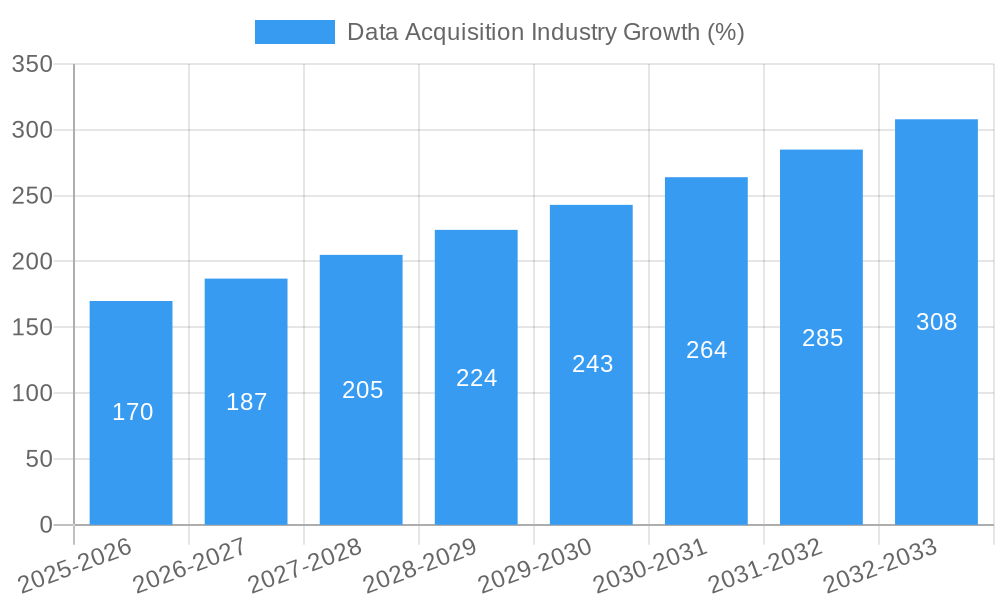
The Data Acquisition (DAQ) industry is experiencing robust growth, projected to reach a market size of $2.41 billion in 2025, expanding at a Compound Annual Growth Rate (CAGR) of 7.10%. This expansion is fueled by several key drivers. Increasing automation across various sectors, including manufacturing, automotive, and energy, necessitates sophisticated data acquisition systems for process optimization, predictive maintenance, and real-time monitoring. The burgeoning adoption of Industry 4.0 and the Internet of Things (IoT) further fuels demand for high-performance DAQ systems capable of handling large volumes of data from diverse sources. Technological advancements, such as the development of more compact, higher-resolution sensors and faster data processing capabilities, are also contributing to market growth. The software segment within DAQ is particularly vibrant, driven by the need for advanced data analytics and visualization tools to extract meaningful insights from acquired data. Growth is further segmented across end-user verticals, with water and waste treatment, power & energy, and automotive showing strong adoption rates due to their need for continuous monitoring and process control.
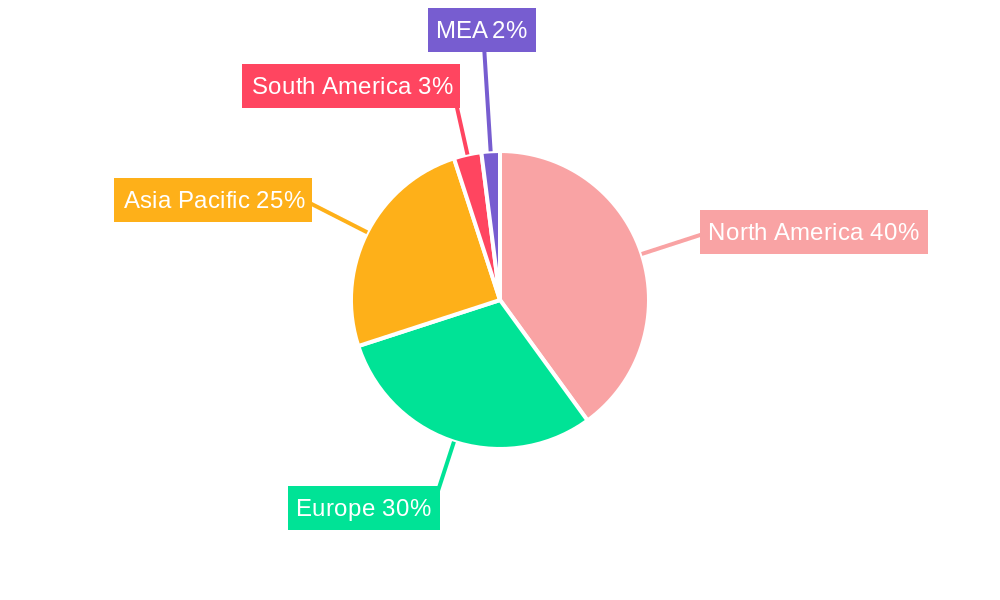
Geographic growth is diverse, with North America currently holding a significant market share due to early adoption and established technological infrastructure. However, Asia-Pacific is anticipated to experience faster growth in the coming years driven by increasing industrialization and infrastructure development in countries like China and India. While the market faces some restraints, such as high initial investment costs for sophisticated systems and the need for specialized expertise in system integration, the overall positive trajectory is supported by the continued demand for improved efficiency, enhanced safety protocols, and data-driven decision-making across numerous industries. The competitive landscape is characterized by the presence of both established players like National Instruments, Siemens, and Yokogawa, and smaller, specialized companies offering niche solutions. This competition fosters innovation and delivers a wide array of solutions catering to various industry needs.
Data Acquisition Industry Market Report: 2019-2033
This comprehensive report provides an in-depth analysis of the Data Acquisition (DAQ) industry, encompassing market dynamics, growth trends, competitive landscape, and future outlook. The study period covers 2019-2033, with 2025 as the base and estimated year. The report segments the market by channel (Less than 32 channels, 32- channels, Greater than 32 channels), type (Hardware, Software), and end-user vertical (Water and Waste Treatment, Power & Energy, Automotive, Education and Research, Aerospace & Defense, Paper and Pulp, Chemicals, Other End-Users), offering a granular understanding of this rapidly evolving sector. The report values are presented in million units.
Data Acquisition Industry Market Dynamics & Structure
The Data Acquisition market is characterized by a moderately consolidated structure, with key players like National Instruments, Keysight Technologies, and Yokogawa Electric holding significant market share. However, the market is dynamic, with continuous technological innovation driving both consolidation and fragmentation. Regulatory frameworks, particularly concerning data security and industrial automation standards, influence market practices. The increasing adoption of Industrial IoT (IIoT) and smart technologies fuels demand, while competitive substitutes, such as cloud-based data analytics platforms, pose challenges. The end-user demographics are diversifying, with growing contributions from sectors like renewable energy and smart city initiatives. M&A activity is moderate, with approximately xx deals recorded annually in the historical period (2019-2024), indicating a strategic focus on expanding capabilities and market reach.
- Market Concentration: Moderately consolidated, with top 5 players holding approximately xx% market share in 2024.
- Technological Innovation: Driven by advancements in sensor technology, high-speed data processing, and cloud computing.
- Regulatory Frameworks: Compliance with data privacy regulations and industry standards (e.g., IEC 61131-3) is crucial.
- Competitive Substitutes: Cloud-based data analytics and software-defined instrumentation pose challenges.
- End-User Demographics: Diversifying, with increasing demand from renewable energy, smart cities, and automation sectors.
- M&A Trends: Moderate activity, focusing on technological integration and market expansion (xx deals/year, 2019-2024).
Data Acquisition Industry Growth Trends & Insights
The global Data Acquisition market is experiencing robust growth, driven by increasing automation across diverse sectors. The market size expanded from xx million units in 2019 to xx million units in 2024, exhibiting a Compound Annual Growth Rate (CAGR) of xx% during this period. This growth is attributable to several factors, including the rising adoption of IIoT, the demand for real-time data analytics, and the expanding application of DAQ systems in diverse industries. Technological disruptions, such as the emergence of high-speed data acquisition systems and AI-powered data analysis tools, are further accelerating market expansion. Consumer behavior is shifting towards more sophisticated, integrated solutions that offer enhanced data visualization and predictive capabilities. Market penetration is expected to reach xx% by 2033.
Dominant Regions, Countries, or Segments in Data Acquisition Industry
North America currently holds the largest market share, followed by Europe and Asia-Pacific. Within these regions, countries like the United States, Germany, China, and Japan are key contributors to market growth. In terms of segments, the Hardware segment dominates the market due to the fundamental need for physical DAQ devices. The Power & Energy and Automotive sectors are the largest end-user verticals, driven by stringent regulatory compliance and the need for process optimization.
- North America: Strong presence of key players and advanced technological infrastructure.
- Europe: High adoption of automation technologies across various industries.
- Asia-Pacific: Rapid industrialization and increasing investment in smart city infrastructure.
- Hardware Segment: Dominates due to the crucial role of physical data acquisition devices.
- Power & Energy and Automotive: Leading end-user verticals due to strong automation and efficiency needs.
Data Acquisition Industry Product Landscape
The Data Acquisition market offers a wide range of products, including modular and standalone DAQ systems, signal conditioning modules, software packages for data acquisition, and analysis. Recent innovations focus on improved data throughput, increased channel density, and enhanced integration with cloud platforms. These advancements enable real-time data acquisition and analysis, empowering better decision-making and process optimization. Key features include advanced signal processing capabilities, increased precision, and improved connectivity options (e.g., Ethernet, USB, wireless).
Key Drivers, Barriers & Challenges in Data Acquisition Industry
Key Drivers: The increasing adoption of Industry 4.0 and IIoT initiatives is a major driver, pushing demand for robust data acquisition solutions across diverse sectors. Government investments in smart city and infrastructure development projects also contribute significantly. Technological advancements, like faster processors and miniaturized sensors, are crucial for innovation.
Key Barriers and Challenges: Supply chain disruptions impacting component availability and escalating costs pose significant hurdles. Stringent data security and privacy regulations increase compliance costs and complexity. Intense competition from established players and emerging entrants leads to price pressure. A lack of skilled personnel to implement and maintain DAQ systems is another concern. These factors could collectively impact market growth by approximately xx% by 2033.
Emerging Opportunities in Data Acquisition Industry
Untapped markets in developing economies, particularly in Southeast Asia and Africa, offer substantial growth opportunities. Innovative applications like precision agriculture, environmental monitoring, and medical diagnostics are driving demand. The rising popularity of edge computing offers opportunities for decentralized data processing and analysis, improving real-time capabilities.
Growth Accelerators in the Data Acquisition Industry
Technological advancements in sensor technology and data analytics are key growth catalysts. Strategic partnerships between DAQ manufacturers and software providers are fostering integrated solutions. Expansion into new markets (e.g., smart cities, renewable energy) is driving market growth.
Key Players Shaping the Data Acquisition Industry Market
- Imc Dataworks LLC
- DATAQ Instruments
- ABB Ltd
- Spectris PLC (HBM and Bruel & Kjaer and Omega)
- DAQ Systems Co Limited
- Keysight Technologies
- National Instruments Corporation
- Yokogawa Electric Co
- Emerson Electric Co
- Siemens AG
- Schneider Electric SE
- Omron Corporation
- General Electric Ltd
- Honeywell International
- Beijing GEMOTECH Intelligent Technology
- ADLINK Technology Inc
- Advantech Co Ltd
- Rockwell Automation Inc
- Curtiss-Wright Corporation
- Tektronix
- Bustec
- AMETEK (VTI Instruments)
Notable Milestones in Data Acquisition Industry Sector
- June 2022: Advantech launched the iDAQ series of modular DAQ modules and chassis, enhancing system flexibility and scalability.
- December 2021: ABB India partnered with Indore smart city development, leveraging SCADA solutions for reliable power supply.
In-Depth Data Acquisition Industry Market Outlook
The Data Acquisition market is poised for continued strong growth, driven by technological innovation, increasing automation across industries, and expansion into new applications. Strategic partnerships and investments in research and development will further fuel market expansion. The increasing adoption of cloud-based data analytics platforms will create opportunities for integrated solutions. The focus will shift towards more sophisticated and intelligent DAQ systems capable of delivering actionable insights in real-time. The market is projected to reach xx million units by 2033.
Data Acquisition Industry Segmentation
-
1. Channel
- 1.1. Less than 32
- 1.2. 32-128
- 1.3. Greater than 128
-
2. Type
- 2.1. Hardware
- 2.2. Software
-
3. End-User Vertical
- 3.1. Water and Waste Treatment
- 3.2. Power & Energy
- 3.3. Automotive
- 3.4. Education and Research
- 3.5. Aerospace & Defense
- 3.6. Paper and Pulp
- 3.7. Chemicals
- 3.8. Other End-Users
Data Acquisition Industry Segmentation By Geography
- 1. North America
- 2. Europe
- 3. Asia Pacific
- 4. Rest of the World
Data Acquisition Industry REPORT HIGHLIGHTS
| Aspects | Details |
|---|---|
| Study Period | 2019-2033 |
| Base Year | 2024 |
| Estimated Year | 2025 |
| Forecast Period | 2025-2033 |
| Historical Period | 2019-2024 |
| Growth Rate | CAGR of 7.10% from 2019-2033 |
| Segmentation |
|
Table of Contents
- 1. Introduction
- 1.1. Research Scope
- 1.2. Market Segmentation
- 1.3. Research Methodology
- 1.4. Definitions and Assumptions
- 2. Executive Summary
- 2.1. Introduction
- 3. Market Dynamics
- 3.1. Introduction
- 3.2. Market Drivers
- 3.2.1. Growing Adoption of Industrial Ethernet Solutions; Increasing Complexity in Manufacturing Establishments is Driving Operators Towards Adoption of DAQ for Design Validation and Testing; Technological Advancements Such as Edge Computing and TSN
- 3.3. Market Restrains
- 3.3.1. Cost Implications and Saturation in Key Markets Could Hinder Growth Over the Forecast Period
- 3.4. Market Trends
- 3.4.1. Aerospace and Defense Accounts for Significant Share in the Market
- 4. Market Factor Analysis
- 4.1. Porters Five Forces
- 4.2. Supply/Value Chain
- 4.3. PESTEL analysis
- 4.4. Market Entropy
- 4.5. Patent/Trademark Analysis
- 5. Global Data Acquisition Industry Analysis, Insights and Forecast, 2019-2031
- 5.1. Market Analysis, Insights and Forecast - by Channel
- 5.1.1. Less than 32
- 5.1.2. 32-128
- 5.1.3. Greater than 128
- 5.2. Market Analysis, Insights and Forecast - by Type
- 5.2.1. Hardware
- 5.2.2. Software
- 5.3. Market Analysis, Insights and Forecast - by End-User Vertical
- 5.3.1. Water and Waste Treatment
- 5.3.2. Power & Energy
- 5.3.3. Automotive
- 5.3.4. Education and Research
- 5.3.5. Aerospace & Defense
- 5.3.6. Paper and Pulp
- 5.3.7. Chemicals
- 5.3.8. Other End-Users
- 5.4. Market Analysis, Insights and Forecast - by Region
- 5.4.1. North America
- 5.4.2. Europe
- 5.4.3. Asia Pacific
- 5.4.4. Rest of the World
- 5.1. Market Analysis, Insights and Forecast - by Channel
- 6. North America Data Acquisition Industry Analysis, Insights and Forecast, 2019-2031
- 6.1. Market Analysis, Insights and Forecast - by Channel
- 6.1.1. Less than 32
- 6.1.2. 32-128
- 6.1.3. Greater than 128
- 6.2. Market Analysis, Insights and Forecast - by Type
- 6.2.1. Hardware
- 6.2.2. Software
- 6.3. Market Analysis, Insights and Forecast - by End-User Vertical
- 6.3.1. Water and Waste Treatment
- 6.3.2. Power & Energy
- 6.3.3. Automotive
- 6.3.4. Education and Research
- 6.3.5. Aerospace & Defense
- 6.3.6. Paper and Pulp
- 6.3.7. Chemicals
- 6.3.8. Other End-Users
- 6.1. Market Analysis, Insights and Forecast - by Channel
- 7. Europe Data Acquisition Industry Analysis, Insights and Forecast, 2019-2031
- 7.1. Market Analysis, Insights and Forecast - by Channel
- 7.1.1. Less than 32
- 7.1.2. 32-128
- 7.1.3. Greater than 128
- 7.2. Market Analysis, Insights and Forecast - by Type
- 7.2.1. Hardware
- 7.2.2. Software
- 7.3. Market Analysis, Insights and Forecast - by End-User Vertical
- 7.3.1. Water and Waste Treatment
- 7.3.2. Power & Energy
- 7.3.3. Automotive
- 7.3.4. Education and Research
- 7.3.5. Aerospace & Defense
- 7.3.6. Paper and Pulp
- 7.3.7. Chemicals
- 7.3.8. Other End-Users
- 7.1. Market Analysis, Insights and Forecast - by Channel
- 8. Asia Pacific Data Acquisition Industry Analysis, Insights and Forecast, 2019-2031
- 8.1. Market Analysis, Insights and Forecast - by Channel
- 8.1.1. Less than 32
- 8.1.2. 32-128
- 8.1.3. Greater than 128
- 8.2. Market Analysis, Insights and Forecast - by Type
- 8.2.1. Hardware
- 8.2.2. Software
- 8.3. Market Analysis, Insights and Forecast - by End-User Vertical
- 8.3.1. Water and Waste Treatment
- 8.3.2. Power & Energy
- 8.3.3. Automotive
- 8.3.4. Education and Research
- 8.3.5. Aerospace & Defense
- 8.3.6. Paper and Pulp
- 8.3.7. Chemicals
- 8.3.8. Other End-Users
- 8.1. Market Analysis, Insights and Forecast - by Channel
- 9. Rest of the World Data Acquisition Industry Analysis, Insights and Forecast, 2019-2031
- 9.1. Market Analysis, Insights and Forecast - by Channel
- 9.1.1. Less than 32
- 9.1.2. 32-128
- 9.1.3. Greater than 128
- 9.2. Market Analysis, Insights and Forecast - by Type
- 9.2.1. Hardware
- 9.2.2. Software
- 9.3. Market Analysis, Insights and Forecast - by End-User Vertical
- 9.3.1. Water and Waste Treatment
- 9.3.2. Power & Energy
- 9.3.3. Automotive
- 9.3.4. Education and Research
- 9.3.5. Aerospace & Defense
- 9.3.6. Paper and Pulp
- 9.3.7. Chemicals
- 9.3.8. Other End-Users
- 9.1. Market Analysis, Insights and Forecast - by Channel
- 10. North America Data Acquisition Industry Analysis, Insights and Forecast, 2019-2031
- 10.1. Market Analysis, Insights and Forecast - By Country/Sub-region
- 10.1.1 United States
- 10.1.2 Canada
- 10.1.3 Mexico
- 11. Europe Data Acquisition Industry Analysis, Insights and Forecast, 2019-2031
- 11.1. Market Analysis, Insights and Forecast - By Country/Sub-region
- 11.1.1 Germany
- 11.1.2 United Kingdom
- 11.1.3 France
- 11.1.4 Spain
- 11.1.5 Italy
- 11.1.6 Spain
- 11.1.7 Belgium
- 11.1.8 Netherland
- 11.1.9 Nordics
- 11.1.10 Rest of Europe
- 12. Asia Pacific Data Acquisition Industry Analysis, Insights and Forecast, 2019-2031
- 12.1. Market Analysis, Insights and Forecast - By Country/Sub-region
- 12.1.1 China
- 12.1.2 Japan
- 12.1.3 India
- 12.1.4 South Korea
- 12.1.5 Southeast Asia
- 12.1.6 Australia
- 12.1.7 Indonesia
- 12.1.8 Phillipes
- 12.1.9 Singapore
- 12.1.10 Thailandc
- 12.1.11 Rest of Asia Pacific
- 13. South America Data Acquisition Industry Analysis, Insights and Forecast, 2019-2031
- 13.1. Market Analysis, Insights and Forecast - By Country/Sub-region
- 13.1.1 Brazil
- 13.1.2 Argentina
- 13.1.3 Peru
- 13.1.4 Chile
- 13.1.5 Colombia
- 13.1.6 Ecuador
- 13.1.7 Venezuela
- 13.1.8 Rest of South America
- 14. North America Data Acquisition Industry Analysis, Insights and Forecast, 2019-2031
- 14.1. Market Analysis, Insights and Forecast - By Country/Sub-region
- 14.1.1 United States
- 14.1.2 Canada
- 14.1.3 Mexico
- 15. MEA Data Acquisition Industry Analysis, Insights and Forecast, 2019-2031
- 15.1. Market Analysis, Insights and Forecast - By Country/Sub-region
- 15.1.1 United Arab Emirates
- 15.1.2 Saudi Arabia
- 15.1.3 South Africa
- 15.1.4 Rest of Middle East and Africa
- 16. Competitive Analysis
- 16.1. Global Market Share Analysis 2024
- 16.2. Company Profiles
- 16.2.1 Imc Dataworks LLC
- 16.2.1.1. Overview
- 16.2.1.2. Products
- 16.2.1.3. SWOT Analysis
- 16.2.1.4. Recent Developments
- 16.2.1.5. Financials (Based on Availability)
- 16.2.2 DATAQ Instruments
- 16.2.2.1. Overview
- 16.2.2.2. Products
- 16.2.2.3. SWOT Analysis
- 16.2.2.4. Recent Developments
- 16.2.2.5. Financials (Based on Availability)
- 16.2.3 ABB Ltd
- 16.2.3.1. Overview
- 16.2.3.2. Products
- 16.2.3.3. SWOT Analysis
- 16.2.3.4. Recent Developments
- 16.2.3.5. Financials (Based on Availability)
- 16.2.4 Spectris PLC (HBM and Bruel & Kjaer and Omega)
- 16.2.4.1. Overview
- 16.2.4.2. Products
- 16.2.4.3. SWOT Analysis
- 16.2.4.4. Recent Developments
- 16.2.4.5. Financials (Based on Availability)
- 16.2.5 DAQ Systems Co Limited
- 16.2.5.1. Overview
- 16.2.5.2. Products
- 16.2.5.3. SWOT Analysis
- 16.2.5.4. Recent Developments
- 16.2.5.5. Financials (Based on Availability)
- 16.2.6 Keysight Technologies
- 16.2.6.1. Overview
- 16.2.6.2. Products
- 16.2.6.3. SWOT Analysis
- 16.2.6.4. Recent Developments
- 16.2.6.5. Financials (Based on Availability)
- 16.2.7 National Instruments Corporation
- 16.2.7.1. Overview
- 16.2.7.2. Products
- 16.2.7.3. SWOT Analysis
- 16.2.7.4. Recent Developments
- 16.2.7.5. Financials (Based on Availability)
- 16.2.8 Yokogawa Electric Co
- 16.2.8.1. Overview
- 16.2.8.2. Products
- 16.2.8.3. SWOT Analysis
- 16.2.8.4. Recent Developments
- 16.2.8.5. Financials (Based on Availability)
- 16.2.9 Emerson Electric Co
- 16.2.9.1. Overview
- 16.2.9.2. Products
- 16.2.9.3. SWOT Analysis
- 16.2.9.4. Recent Developments
- 16.2.9.5. Financials (Based on Availability)
- 16.2.10 Siemens AG
- 16.2.10.1. Overview
- 16.2.10.2. Products
- 16.2.10.3. SWOT Analysis
- 16.2.10.4. Recent Developments
- 16.2.10.5. Financials (Based on Availability)
- 16.2.11 Schneider Electric SE
- 16.2.11.1. Overview
- 16.2.11.2. Products
- 16.2.11.3. SWOT Analysis
- 16.2.11.4. Recent Developments
- 16.2.11.5. Financials (Based on Availability)
- 16.2.12 Omron Corporation
- 16.2.12.1. Overview
- 16.2.12.2. Products
- 16.2.12.3. SWOT Analysis
- 16.2.12.4. Recent Developments
- 16.2.12.5. Financials (Based on Availability)
- 16.2.13 General Electric Ltd
- 16.2.13.1. Overview
- 16.2.13.2. Products
- 16.2.13.3. SWOT Analysis
- 16.2.13.4. Recent Developments
- 16.2.13.5. Financials (Based on Availability)
- 16.2.14 Honeywell International
- 16.2.14.1. Overview
- 16.2.14.2. Products
- 16.2.14.3. SWOT Analysis
- 16.2.14.4. Recent Developments
- 16.2.14.5. Financials (Based on Availability)
- 16.2.15 Beijing GEMOTECH Intelligent Technology
- 16.2.15.1. Overview
- 16.2.15.2. Products
- 16.2.15.3. SWOT Analysis
- 16.2.15.4. Recent Developments
- 16.2.15.5. Financials (Based on Availability)
- 16.2.16 ADLINK Technology Inc
- 16.2.16.1. Overview
- 16.2.16.2. Products
- 16.2.16.3. SWOT Analysis
- 16.2.16.4. Recent Developments
- 16.2.16.5. Financials (Based on Availability)
- 16.2.17 Advantech Co Ltd
- 16.2.17.1. Overview
- 16.2.17.2. Products
- 16.2.17.3. SWOT Analysis
- 16.2.17.4. Recent Developments
- 16.2.17.5. Financials (Based on Availability)
- 16.2.18 Rockwell Automation Inc
- 16.2.18.1. Overview
- 16.2.18.2. Products
- 16.2.18.3. SWOT Analysis
- 16.2.18.4. Recent Developments
- 16.2.18.5. Financials (Based on Availability)
- 16.2.19 Curtiss-Wright Corporation
- 16.2.19.1. Overview
- 16.2.19.2. Products
- 16.2.19.3. SWOT Analysis
- 16.2.19.4. Recent Developments
- 16.2.19.5. Financials (Based on Availability)
- 16.2.20 Tektronix
- 16.2.20.1. Overview
- 16.2.20.2. Products
- 16.2.20.3. SWOT Analysis
- 16.2.20.4. Recent Developments
- 16.2.20.5. Financials (Based on Availability)
- 16.2.21 Bustec
- 16.2.21.1. Overview
- 16.2.21.2. Products
- 16.2.21.3. SWOT Analysis
- 16.2.21.4. Recent Developments
- 16.2.21.5. Financials (Based on Availability)
- 16.2.22 AMETEK (VTI Instruments)
- 16.2.22.1. Overview
- 16.2.22.2. Products
- 16.2.22.3. SWOT Analysis
- 16.2.22.4. Recent Developments
- 16.2.22.5. Financials (Based on Availability)
- 16.2.1 Imc Dataworks LLC
List of Figures
- Figure 1: Global Data Acquisition Industry Revenue Breakdown (Million, %) by Region 2024 & 2032
- Figure 2: Global Data Acquisition Industry Volume Breakdown (K Unit, %) by Region 2024 & 2032
- Figure 3: North America Data Acquisition Industry Revenue (Million), by Country 2024 & 2032
- Figure 4: North America Data Acquisition Industry Volume (K Unit), by Country 2024 & 2032
- Figure 5: North America Data Acquisition Industry Revenue Share (%), by Country 2024 & 2032
- Figure 6: North America Data Acquisition Industry Volume Share (%), by Country 2024 & 2032
- Figure 7: Europe Data Acquisition Industry Revenue (Million), by Country 2024 & 2032
- Figure 8: Europe Data Acquisition Industry Volume (K Unit), by Country 2024 & 2032
- Figure 9: Europe Data Acquisition Industry Revenue Share (%), by Country 2024 & 2032
- Figure 10: Europe Data Acquisition Industry Volume Share (%), by Country 2024 & 2032
- Figure 11: Asia Pacific Data Acquisition Industry Revenue (Million), by Country 2024 & 2032
- Figure 12: Asia Pacific Data Acquisition Industry Volume (K Unit), by Country 2024 & 2032
- Figure 13: Asia Pacific Data Acquisition Industry Revenue Share (%), by Country 2024 & 2032
- Figure 14: Asia Pacific Data Acquisition Industry Volume Share (%), by Country 2024 & 2032
- Figure 15: South America Data Acquisition Industry Revenue (Million), by Country 2024 & 2032
- Figure 16: South America Data Acquisition Industry Volume (K Unit), by Country 2024 & 2032
- Figure 17: South America Data Acquisition Industry Revenue Share (%), by Country 2024 & 2032
- Figure 18: South America Data Acquisition Industry Volume Share (%), by Country 2024 & 2032
- Figure 19: North America Data Acquisition Industry Revenue (Million), by Country 2024 & 2032
- Figure 20: North America Data Acquisition Industry Volume (K Unit), by Country 2024 & 2032
- Figure 21: North America Data Acquisition Industry Revenue Share (%), by Country 2024 & 2032
- Figure 22: North America Data Acquisition Industry Volume Share (%), by Country 2024 & 2032
- Figure 23: MEA Data Acquisition Industry Revenue (Million), by Country 2024 & 2032
- Figure 24: MEA Data Acquisition Industry Volume (K Unit), by Country 2024 & 2032
- Figure 25: MEA Data Acquisition Industry Revenue Share (%), by Country 2024 & 2032
- Figure 26: MEA Data Acquisition Industry Volume Share (%), by Country 2024 & 2032
- Figure 27: North America Data Acquisition Industry Revenue (Million), by Channel 2024 & 2032
- Figure 28: North America Data Acquisition Industry Volume (K Unit), by Channel 2024 & 2032
- Figure 29: North America Data Acquisition Industry Revenue Share (%), by Channel 2024 & 2032
- Figure 30: North America Data Acquisition Industry Volume Share (%), by Channel 2024 & 2032
- Figure 31: North America Data Acquisition Industry Revenue (Million), by Type 2024 & 2032
- Figure 32: North America Data Acquisition Industry Volume (K Unit), by Type 2024 & 2032
- Figure 33: North America Data Acquisition Industry Revenue Share (%), by Type 2024 & 2032
- Figure 34: North America Data Acquisition Industry Volume Share (%), by Type 2024 & 2032
- Figure 35: North America Data Acquisition Industry Revenue (Million), by End-User Vertical 2024 & 2032
- Figure 36: North America Data Acquisition Industry Volume (K Unit), by End-User Vertical 2024 & 2032
- Figure 37: North America Data Acquisition Industry Revenue Share (%), by End-User Vertical 2024 & 2032
- Figure 38: North America Data Acquisition Industry Volume Share (%), by End-User Vertical 2024 & 2032
- Figure 39: North America Data Acquisition Industry Revenue (Million), by Country 2024 & 2032
- Figure 40: North America Data Acquisition Industry Volume (K Unit), by Country 2024 & 2032
- Figure 41: North America Data Acquisition Industry Revenue Share (%), by Country 2024 & 2032
- Figure 42: North America Data Acquisition Industry Volume Share (%), by Country 2024 & 2032
- Figure 43: Europe Data Acquisition Industry Revenue (Million), by Channel 2024 & 2032
- Figure 44: Europe Data Acquisition Industry Volume (K Unit), by Channel 2024 & 2032
- Figure 45: Europe Data Acquisition Industry Revenue Share (%), by Channel 2024 & 2032
- Figure 46: Europe Data Acquisition Industry Volume Share (%), by Channel 2024 & 2032
- Figure 47: Europe Data Acquisition Industry Revenue (Million), by Type 2024 & 2032
- Figure 48: Europe Data Acquisition Industry Volume (K Unit), by Type 2024 & 2032
- Figure 49: Europe Data Acquisition Industry Revenue Share (%), by Type 2024 & 2032
- Figure 50: Europe Data Acquisition Industry Volume Share (%), by Type 2024 & 2032
- Figure 51: Europe Data Acquisition Industry Revenue (Million), by End-User Vertical 2024 & 2032
- Figure 52: Europe Data Acquisition Industry Volume (K Unit), by End-User Vertical 2024 & 2032
- Figure 53: Europe Data Acquisition Industry Revenue Share (%), by End-User Vertical 2024 & 2032
- Figure 54: Europe Data Acquisition Industry Volume Share (%), by End-User Vertical 2024 & 2032
- Figure 55: Europe Data Acquisition Industry Revenue (Million), by Country 2024 & 2032
- Figure 56: Europe Data Acquisition Industry Volume (K Unit), by Country 2024 & 2032
- Figure 57: Europe Data Acquisition Industry Revenue Share (%), by Country 2024 & 2032
- Figure 58: Europe Data Acquisition Industry Volume Share (%), by Country 2024 & 2032
- Figure 59: Asia Pacific Data Acquisition Industry Revenue (Million), by Channel 2024 & 2032
- Figure 60: Asia Pacific Data Acquisition Industry Volume (K Unit), by Channel 2024 & 2032
- Figure 61: Asia Pacific Data Acquisition Industry Revenue Share (%), by Channel 2024 & 2032
- Figure 62: Asia Pacific Data Acquisition Industry Volume Share (%), by Channel 2024 & 2032
- Figure 63: Asia Pacific Data Acquisition Industry Revenue (Million), by Type 2024 & 2032
- Figure 64: Asia Pacific Data Acquisition Industry Volume (K Unit), by Type 2024 & 2032
- Figure 65: Asia Pacific Data Acquisition Industry Revenue Share (%), by Type 2024 & 2032
- Figure 66: Asia Pacific Data Acquisition Industry Volume Share (%), by Type 2024 & 2032
- Figure 67: Asia Pacific Data Acquisition Industry Revenue (Million), by End-User Vertical 2024 & 2032
- Figure 68: Asia Pacific Data Acquisition Industry Volume (K Unit), by End-User Vertical 2024 & 2032
- Figure 69: Asia Pacific Data Acquisition Industry Revenue Share (%), by End-User Vertical 2024 & 2032
- Figure 70: Asia Pacific Data Acquisition Industry Volume Share (%), by End-User Vertical 2024 & 2032
- Figure 71: Asia Pacific Data Acquisition Industry Revenue (Million), by Country 2024 & 2032
- Figure 72: Asia Pacific Data Acquisition Industry Volume (K Unit), by Country 2024 & 2032
- Figure 73: Asia Pacific Data Acquisition Industry Revenue Share (%), by Country 2024 & 2032
- Figure 74: Asia Pacific Data Acquisition Industry Volume Share (%), by Country 2024 & 2032
- Figure 75: Rest of the World Data Acquisition Industry Revenue (Million), by Channel 2024 & 2032
- Figure 76: Rest of the World Data Acquisition Industry Volume (K Unit), by Channel 2024 & 2032
- Figure 77: Rest of the World Data Acquisition Industry Revenue Share (%), by Channel 2024 & 2032
- Figure 78: Rest of the World Data Acquisition Industry Volume Share (%), by Channel 2024 & 2032
- Figure 79: Rest of the World Data Acquisition Industry Revenue (Million), by Type 2024 & 2032
- Figure 80: Rest of the World Data Acquisition Industry Volume (K Unit), by Type 2024 & 2032
- Figure 81: Rest of the World Data Acquisition Industry Revenue Share (%), by Type 2024 & 2032
- Figure 82: Rest of the World Data Acquisition Industry Volume Share (%), by Type 2024 & 2032
- Figure 83: Rest of the World Data Acquisition Industry Revenue (Million), by End-User Vertical 2024 & 2032
- Figure 84: Rest of the World Data Acquisition Industry Volume (K Unit), by End-User Vertical 2024 & 2032
- Figure 85: Rest of the World Data Acquisition Industry Revenue Share (%), by End-User Vertical 2024 & 2032
- Figure 86: Rest of the World Data Acquisition Industry Volume Share (%), by End-User Vertical 2024 & 2032
- Figure 87: Rest of the World Data Acquisition Industry Revenue (Million), by Country 2024 & 2032
- Figure 88: Rest of the World Data Acquisition Industry Volume (K Unit), by Country 2024 & 2032
- Figure 89: Rest of the World Data Acquisition Industry Revenue Share (%), by Country 2024 & 2032
- Figure 90: Rest of the World Data Acquisition Industry Volume Share (%), by Country 2024 & 2032
List of Tables
- Table 1: Global Data Acquisition Industry Revenue Million Forecast, by Region 2019 & 2032
- Table 2: Global Data Acquisition Industry Volume K Unit Forecast, by Region 2019 & 2032
- Table 3: Global Data Acquisition Industry Revenue Million Forecast, by Channel 2019 & 2032
- Table 4: Global Data Acquisition Industry Volume K Unit Forecast, by Channel 2019 & 2032
- Table 5: Global Data Acquisition Industry Revenue Million Forecast, by Type 2019 & 2032
- Table 6: Global Data Acquisition Industry Volume K Unit Forecast, by Type 2019 & 2032
- Table 7: Global Data Acquisition Industry Revenue Million Forecast, by End-User Vertical 2019 & 2032
- Table 8: Global Data Acquisition Industry Volume K Unit Forecast, by End-User Vertical 2019 & 2032
- Table 9: Global Data Acquisition Industry Revenue Million Forecast, by Region 2019 & 2032
- Table 10: Global Data Acquisition Industry Volume K Unit Forecast, by Region 2019 & 2032
- Table 11: Global Data Acquisition Industry Revenue Million Forecast, by Country 2019 & 2032
- Table 12: Global Data Acquisition Industry Volume K Unit Forecast, by Country 2019 & 2032
- Table 13: United States Data Acquisition Industry Revenue (Million) Forecast, by Application 2019 & 2032
- Table 14: United States Data Acquisition Industry Volume (K Unit) Forecast, by Application 2019 & 2032
- Table 15: Canada Data Acquisition Industry Revenue (Million) Forecast, by Application 2019 & 2032
- Table 16: Canada Data Acquisition Industry Volume (K Unit) Forecast, by Application 2019 & 2032
- Table 17: Mexico Data Acquisition Industry Revenue (Million) Forecast, by Application 2019 & 2032
- Table 18: Mexico Data Acquisition Industry Volume (K Unit) Forecast, by Application 2019 & 2032
- Table 19: Global Data Acquisition Industry Revenue Million Forecast, by Country 2019 & 2032
- Table 20: Global Data Acquisition Industry Volume K Unit Forecast, by Country 2019 & 2032
- Table 21: Germany Data Acquisition Industry Revenue (Million) Forecast, by Application 2019 & 2032
- Table 22: Germany Data Acquisition Industry Volume (K Unit) Forecast, by Application 2019 & 2032
- Table 23: United Kingdom Data Acquisition Industry Revenue (Million) Forecast, by Application 2019 & 2032
- Table 24: United Kingdom Data Acquisition Industry Volume (K Unit) Forecast, by Application 2019 & 2032
- Table 25: France Data Acquisition Industry Revenue (Million) Forecast, by Application 2019 & 2032
- Table 26: France Data Acquisition Industry Volume (K Unit) Forecast, by Application 2019 & 2032
- Table 27: Spain Data Acquisition Industry Revenue (Million) Forecast, by Application 2019 & 2032
- Table 28: Spain Data Acquisition Industry Volume (K Unit) Forecast, by Application 2019 & 2032
- Table 29: Italy Data Acquisition Industry Revenue (Million) Forecast, by Application 2019 & 2032
- Table 30: Italy Data Acquisition Industry Volume (K Unit) Forecast, by Application 2019 & 2032
- Table 31: Spain Data Acquisition Industry Revenue (Million) Forecast, by Application 2019 & 2032
- Table 32: Spain Data Acquisition Industry Volume (K Unit) Forecast, by Application 2019 & 2032
- Table 33: Belgium Data Acquisition Industry Revenue (Million) Forecast, by Application 2019 & 2032
- Table 34: Belgium Data Acquisition Industry Volume (K Unit) Forecast, by Application 2019 & 2032
- Table 35: Netherland Data Acquisition Industry Revenue (Million) Forecast, by Application 2019 & 2032
- Table 36: Netherland Data Acquisition Industry Volume (K Unit) Forecast, by Application 2019 & 2032
- Table 37: Nordics Data Acquisition Industry Revenue (Million) Forecast, by Application 2019 & 2032
- Table 38: Nordics Data Acquisition Industry Volume (K Unit) Forecast, by Application 2019 & 2032
- Table 39: Rest of Europe Data Acquisition Industry Revenue (Million) Forecast, by Application 2019 & 2032
- Table 40: Rest of Europe Data Acquisition Industry Volume (K Unit) Forecast, by Application 2019 & 2032
- Table 41: Global Data Acquisition Industry Revenue Million Forecast, by Country 2019 & 2032
- Table 42: Global Data Acquisition Industry Volume K Unit Forecast, by Country 2019 & 2032
- Table 43: China Data Acquisition Industry Revenue (Million) Forecast, by Application 2019 & 2032
- Table 44: China Data Acquisition Industry Volume (K Unit) Forecast, by Application 2019 & 2032
- Table 45: Japan Data Acquisition Industry Revenue (Million) Forecast, by Application 2019 & 2032
- Table 46: Japan Data Acquisition Industry Volume (K Unit) Forecast, by Application 2019 & 2032
- Table 47: India Data Acquisition Industry Revenue (Million) Forecast, by Application 2019 & 2032
- Table 48: India Data Acquisition Industry Volume (K Unit) Forecast, by Application 2019 & 2032
- Table 49: South Korea Data Acquisition Industry Revenue (Million) Forecast, by Application 2019 & 2032
- Table 50: South Korea Data Acquisition Industry Volume (K Unit) Forecast, by Application 2019 & 2032
- Table 51: Southeast Asia Data Acquisition Industry Revenue (Million) Forecast, by Application 2019 & 2032
- Table 52: Southeast Asia Data Acquisition Industry Volume (K Unit) Forecast, by Application 2019 & 2032
- Table 53: Australia Data Acquisition Industry Revenue (Million) Forecast, by Application 2019 & 2032
- Table 54: Australia Data Acquisition Industry Volume (K Unit) Forecast, by Application 2019 & 2032
- Table 55: Indonesia Data Acquisition Industry Revenue (Million) Forecast, by Application 2019 & 2032
- Table 56: Indonesia Data Acquisition Industry Volume (K Unit) Forecast, by Application 2019 & 2032
- Table 57: Phillipes Data Acquisition Industry Revenue (Million) Forecast, by Application 2019 & 2032
- Table 58: Phillipes Data Acquisition Industry Volume (K Unit) Forecast, by Application 2019 & 2032
- Table 59: Singapore Data Acquisition Industry Revenue (Million) Forecast, by Application 2019 & 2032
- Table 60: Singapore Data Acquisition Industry Volume (K Unit) Forecast, by Application 2019 & 2032
- Table 61: Thailandc Data Acquisition Industry Revenue (Million) Forecast, by Application 2019 & 2032
- Table 62: Thailandc Data Acquisition Industry Volume (K Unit) Forecast, by Application 2019 & 2032
- Table 63: Rest of Asia Pacific Data Acquisition Industry Revenue (Million) Forecast, by Application 2019 & 2032
- Table 64: Rest of Asia Pacific Data Acquisition Industry Volume (K Unit) Forecast, by Application 2019 & 2032
- Table 65: Global Data Acquisition Industry Revenue Million Forecast, by Country 2019 & 2032
- Table 66: Global Data Acquisition Industry Volume K Unit Forecast, by Country 2019 & 2032
- Table 67: Brazil Data Acquisition Industry Revenue (Million) Forecast, by Application 2019 & 2032
- Table 68: Brazil Data Acquisition Industry Volume (K Unit) Forecast, by Application 2019 & 2032
- Table 69: Argentina Data Acquisition Industry Revenue (Million) Forecast, by Application 2019 & 2032
- Table 70: Argentina Data Acquisition Industry Volume (K Unit) Forecast, by Application 2019 & 2032
- Table 71: Peru Data Acquisition Industry Revenue (Million) Forecast, by Application 2019 & 2032
- Table 72: Peru Data Acquisition Industry Volume (K Unit) Forecast, by Application 2019 & 2032
- Table 73: Chile Data Acquisition Industry Revenue (Million) Forecast, by Application 2019 & 2032
- Table 74: Chile Data Acquisition Industry Volume (K Unit) Forecast, by Application 2019 & 2032
- Table 75: Colombia Data Acquisition Industry Revenue (Million) Forecast, by Application 2019 & 2032
- Table 76: Colombia Data Acquisition Industry Volume (K Unit) Forecast, by Application 2019 & 2032
- Table 77: Ecuador Data Acquisition Industry Revenue (Million) Forecast, by Application 2019 & 2032
- Table 78: Ecuador Data Acquisition Industry Volume (K Unit) Forecast, by Application 2019 & 2032
- Table 79: Venezuela Data Acquisition Industry Revenue (Million) Forecast, by Application 2019 & 2032
- Table 80: Venezuela Data Acquisition Industry Volume (K Unit) Forecast, by Application 2019 & 2032
- Table 81: Rest of South America Data Acquisition Industry Revenue (Million) Forecast, by Application 2019 & 2032
- Table 82: Rest of South America Data Acquisition Industry Volume (K Unit) Forecast, by Application 2019 & 2032
- Table 83: Global Data Acquisition Industry Revenue Million Forecast, by Country 2019 & 2032
- Table 84: Global Data Acquisition Industry Volume K Unit Forecast, by Country 2019 & 2032
- Table 85: United States Data Acquisition Industry Revenue (Million) Forecast, by Application 2019 & 2032
- Table 86: United States Data Acquisition Industry Volume (K Unit) Forecast, by Application 2019 & 2032
- Table 87: Canada Data Acquisition Industry Revenue (Million) Forecast, by Application 2019 & 2032
- Table 88: Canada Data Acquisition Industry Volume (K Unit) Forecast, by Application 2019 & 2032
- Table 89: Mexico Data Acquisition Industry Revenue (Million) Forecast, by Application 2019 & 2032
- Table 90: Mexico Data Acquisition Industry Volume (K Unit) Forecast, by Application 2019 & 2032
- Table 91: Global Data Acquisition Industry Revenue Million Forecast, by Country 2019 & 2032
- Table 92: Global Data Acquisition Industry Volume K Unit Forecast, by Country 2019 & 2032
- Table 93: United Arab Emirates Data Acquisition Industry Revenue (Million) Forecast, by Application 2019 & 2032
- Table 94: United Arab Emirates Data Acquisition Industry Volume (K Unit) Forecast, by Application 2019 & 2032
- Table 95: Saudi Arabia Data Acquisition Industry Revenue (Million) Forecast, by Application 2019 & 2032
- Table 96: Saudi Arabia Data Acquisition Industry Volume (K Unit) Forecast, by Application 2019 & 2032
- Table 97: South Africa Data Acquisition Industry Revenue (Million) Forecast, by Application 2019 & 2032
- Table 98: South Africa Data Acquisition Industry Volume (K Unit) Forecast, by Application 2019 & 2032
- Table 99: Rest of Middle East and Africa Data Acquisition Industry Revenue (Million) Forecast, by Application 2019 & 2032
- Table 100: Rest of Middle East and Africa Data Acquisition Industry Volume (K Unit) Forecast, by Application 2019 & 2032
- Table 101: Global Data Acquisition Industry Revenue Million Forecast, by Channel 2019 & 2032
- Table 102: Global Data Acquisition Industry Volume K Unit Forecast, by Channel 2019 & 2032
- Table 103: Global Data Acquisition Industry Revenue Million Forecast, by Type 2019 & 2032
- Table 104: Global Data Acquisition Industry Volume K Unit Forecast, by Type 2019 & 2032
- Table 105: Global Data Acquisition Industry Revenue Million Forecast, by End-User Vertical 2019 & 2032
- Table 106: Global Data Acquisition Industry Volume K Unit Forecast, by End-User Vertical 2019 & 2032
- Table 107: Global Data Acquisition Industry Revenue Million Forecast, by Country 2019 & 2032
- Table 108: Global Data Acquisition Industry Volume K Unit Forecast, by Country 2019 & 2032
- Table 109: Global Data Acquisition Industry Revenue Million Forecast, by Channel 2019 & 2032
- Table 110: Global Data Acquisition Industry Volume K Unit Forecast, by Channel 2019 & 2032
- Table 111: Global Data Acquisition Industry Revenue Million Forecast, by Type 2019 & 2032
- Table 112: Global Data Acquisition Industry Volume K Unit Forecast, by Type 2019 & 2032
- Table 113: Global Data Acquisition Industry Revenue Million Forecast, by End-User Vertical 2019 & 2032
- Table 114: Global Data Acquisition Industry Volume K Unit Forecast, by End-User Vertical 2019 & 2032
- Table 115: Global Data Acquisition Industry Revenue Million Forecast, by Country 2019 & 2032
- Table 116: Global Data Acquisition Industry Volume K Unit Forecast, by Country 2019 & 2032
- Table 117: Global Data Acquisition Industry Revenue Million Forecast, by Channel 2019 & 2032
- Table 118: Global Data Acquisition Industry Volume K Unit Forecast, by Channel 2019 & 2032
- Table 119: Global Data Acquisition Industry Revenue Million Forecast, by Type 2019 & 2032
- Table 120: Global Data Acquisition Industry Volume K Unit Forecast, by Type 2019 & 2032
- Table 121: Global Data Acquisition Industry Revenue Million Forecast, by End-User Vertical 2019 & 2032
- Table 122: Global Data Acquisition Industry Volume K Unit Forecast, by End-User Vertical 2019 & 2032
- Table 123: Global Data Acquisition Industry Revenue Million Forecast, by Country 2019 & 2032
- Table 124: Global Data Acquisition Industry Volume K Unit Forecast, by Country 2019 & 2032
- Table 125: Global Data Acquisition Industry Revenue Million Forecast, by Channel 2019 & 2032
- Table 126: Global Data Acquisition Industry Volume K Unit Forecast, by Channel 2019 & 2032
- Table 127: Global Data Acquisition Industry Revenue Million Forecast, by Type 2019 & 2032
- Table 128: Global Data Acquisition Industry Volume K Unit Forecast, by Type 2019 & 2032
- Table 129: Global Data Acquisition Industry Revenue Million Forecast, by End-User Vertical 2019 & 2032
- Table 130: Global Data Acquisition Industry Volume K Unit Forecast, by End-User Vertical 2019 & 2032
- Table 131: Global Data Acquisition Industry Revenue Million Forecast, by Country 2019 & 2032
- Table 132: Global Data Acquisition Industry Volume K Unit Forecast, by Country 2019 & 2032
Frequently Asked Questions
1. What is the projected Compound Annual Growth Rate (CAGR) of the Data Acquisition Industry?
The projected CAGR is approximately 7.10%.
2. Which companies are prominent players in the Data Acquisition Industry?
Key companies in the market include Imc Dataworks LLC, DATAQ Instruments, ABB Ltd, Spectris PLC (HBM and Bruel & Kjaer and Omega), DAQ Systems Co Limited, Keysight Technologies, National Instruments Corporation, Yokogawa Electric Co, Emerson Electric Co, Siemens AG, Schneider Electric SE, Omron Corporation, General Electric Ltd, Honeywell International, Beijing GEMOTECH Intelligent Technology, ADLINK Technology Inc, Advantech Co Ltd, Rockwell Automation Inc, Curtiss-Wright Corporation, Tektronix, Bustec, AMETEK (VTI Instruments).
3. What are the main segments of the Data Acquisition Industry?
The market segments include Channel, Type, End-User Vertical.
4. Can you provide details about the market size?
The market size is estimated to be USD 2.41 Million as of 2022.
5. What are some drivers contributing to market growth?
Growing Adoption of Industrial Ethernet Solutions; Increasing Complexity in Manufacturing Establishments is Driving Operators Towards Adoption of DAQ for Design Validation and Testing; Technological Advancements Such as Edge Computing and TSN.
6. What are the notable trends driving market growth?
Aerospace and Defense Accounts for Significant Share in the Market.
7. Are there any restraints impacting market growth?
Cost Implications and Saturation in Key Markets Could Hinder Growth Over the Forecast Period.
8. Can you provide examples of recent developments in the market?
June 2022 - Advantech announced the launch of a new series of data acquisition modules - iDAQ series. The iDAQ series is a new series of modular DAQ modules and chassis, including the iDAQ-900 series chassis and iDAQ-700 and 800 series DAQ modules.
9. What pricing options are available for accessing the report?
Pricing options include single-user, multi-user, and enterprise licenses priced at USD 4750, USD 5250, and USD 8750 respectively.
10. Is the market size provided in terms of value or volume?
The market size is provided in terms of value, measured in Million and volume, measured in K Unit.
11. Are there any specific market keywords associated with the report?
Yes, the market keyword associated with the report is "Data Acquisition Industry," which aids in identifying and referencing the specific market segment covered.
12. How do I determine which pricing option suits my needs best?
The pricing options vary based on user requirements and access needs. Individual users may opt for single-user licenses, while businesses requiring broader access may choose multi-user or enterprise licenses for cost-effective access to the report.
13. Are there any additional resources or data provided in the Data Acquisition Industry report?
While the report offers comprehensive insights, it's advisable to review the specific contents or supplementary materials provided to ascertain if additional resources or data are available.
14. How can I stay updated on further developments or reports in the Data Acquisition Industry?
To stay informed about further developments, trends, and reports in the Data Acquisition Industry, consider subscribing to industry newsletters, following relevant companies and organizations, or regularly checking reputable industry news sources and publications.
Methodology
Step 1 - Identification of Relevant Samples Size from Population Database


Step 2 - Approaches for Defining Global Market Size (Value, Volume* & Price*)

Note*: In applicable scenarios
Step 3 - Data Sources
Primary Research
- Web Analytics
- Survey Reports
- Research Institute
- Latest Research Reports
- Opinion Leaders
Secondary Research
- Annual Reports
- White Paper
- Latest Press Release
- Industry Association
- Paid Database
- Investor Presentations

Step 4 - Data Triangulation
Involves using different sources of information in order to increase the validity of a study
These sources are likely to be stakeholders in a program - participants, other researchers, program staff, other community members, and so on.
Then we put all data in single framework & apply various statistical tools to find out the dynamic on the market.
During the analysis stage, feedback from the stakeholder groups would be compared to determine areas of agreement as well as areas of divergence


