

Key Insights
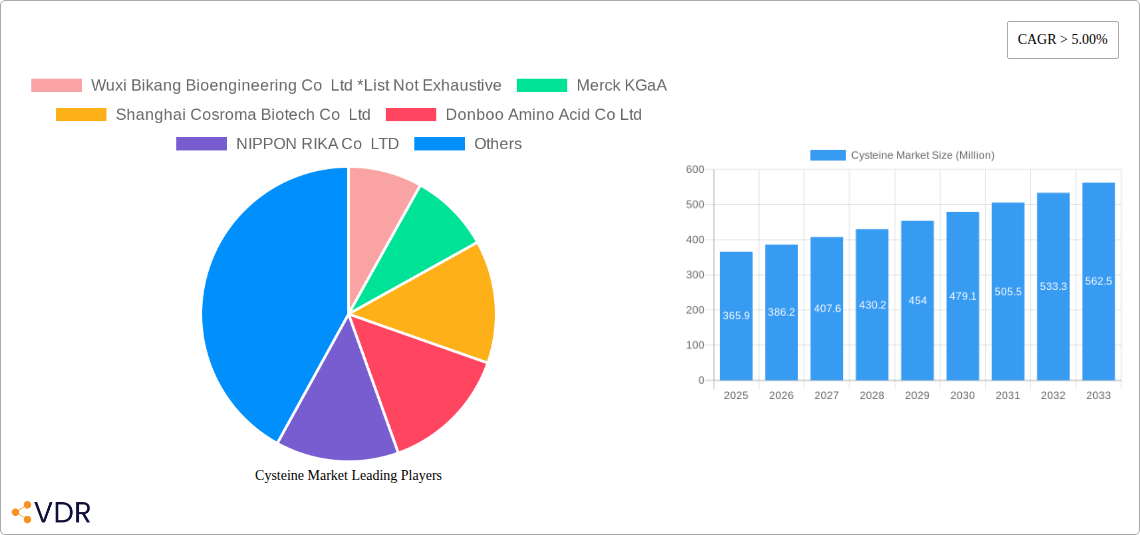
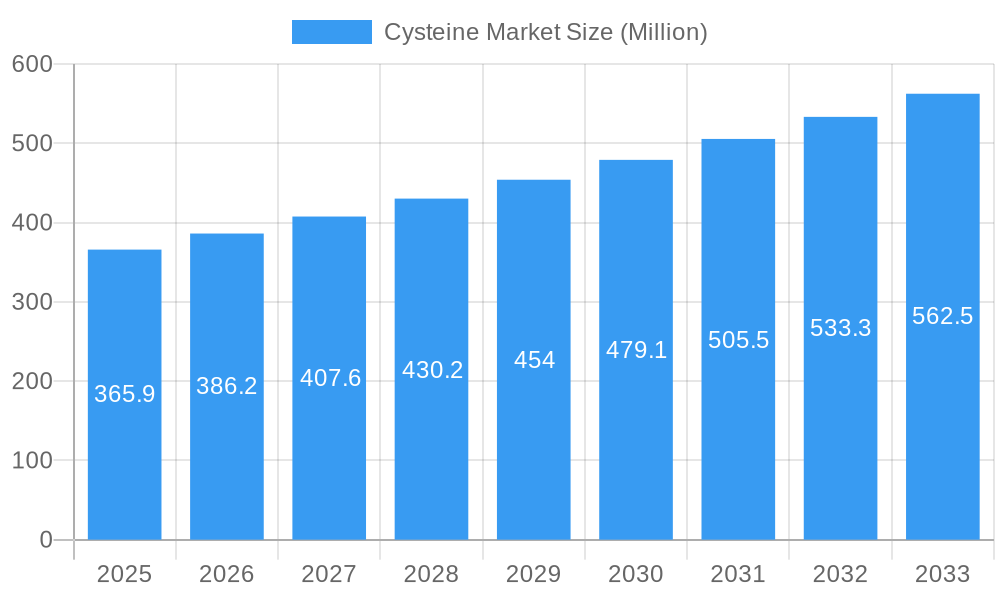
The global cysteine market, valued at $365.9 million in 2025, is projected to experience robust growth, exceeding a 5% CAGR throughout the forecast period (2025-2033). This expansion is fueled by increasing demand across diverse sectors. The pharmaceutical industry's reliance on cysteine for drug production, particularly human insulin, is a major driver. Simultaneously, the food and animal feed industries utilize cysteine as a flavor enhancer, conditioner, and reducing agent, contributing significantly to market growth. The burgeoning popularity of cysteine in anti-aging products within the "other applications" segment further enhances market potential. While the specific production process (natural vs. synthetic) market share isn't provided, both methods contribute substantially. The market is geographically diverse, with Asia Pacific (particularly China and India), North America, and Europe representing key regions. Competitive dynamics are characterized by a mix of established players like Ajinomoto Co Inc and Merck KGaA, along with regional companies such as Wuxi Bikang Bioengineering Co Ltd, indicating a blend of global and localized competition. Growth may be influenced by factors such as fluctuating raw material prices and regulatory approvals for specific applications.
Cysteine Market Market Size (In Million)
Continued expansion in the cysteine market is anticipated due to several key factors. Technological advancements in the production process are likely to increase efficiency and reduce costs, making cysteine a more accessible and cost-effective ingredient. Furthermore, growing awareness of the health benefits of cysteine, coupled with increasing research in related applications like anti-aging therapies, will stimulate demand. However, potential restraints might include the volatility in raw material prices and stringent regulatory frameworks surrounding pharmaceutical applications, which could influence the market's overall growth trajectory. The market segmentation by application reveals promising opportunities in specific sectors, notably pharmaceuticals and food additives, which will likely drive future investments and innovations within the cysteine market. Competition is expected to intensify as new players enter the market.
Cysteine Market Company Market Share
Cysteine Market: A Comprehensive Report (2019-2033)
This comprehensive report provides an in-depth analysis of the global cysteine market, encompassing market dynamics, growth trends, regional segmentation, product landscape, and key player activities. The study period covers 2019-2033, with 2025 as the base and estimated year, and a forecast period of 2025-2033. The report offers valuable insights for industry professionals, investors, and stakeholders seeking to understand the current market landscape and future opportunities within the amino acid and pharmaceutical markets. The market size is projected to reach xx Million by 2033.
Cysteine Market Dynamics & Structure
The cysteine market is characterized by a moderately consolidated structure, with key players such as Ajinomoto Co. Inc., Merck KGaA, and Wacker Chemie AG holding significant market share. Technological innovations, particularly in fermentation processes, are driving market growth, while stringent regulatory frameworks impact production and distribution. The market witnesses consistent M&A activity, reflecting the strategic importance of cysteine in various applications. Competitive substitutes, such as other amino acids, exist, but cysteine's unique properties maintain its demand. End-user demographics show strong growth in the food and pharmaceutical sectors, driving market expansion.
- Market Concentration: Moderately consolidated, with top players holding xx% market share (2024).
- Technological Innovation: Focus on fermentation and synthetic production to reduce costs and enhance sustainability.
- Regulatory Framework: Stringent regulations in food and pharmaceutical applications influence market dynamics.
- Competitive Substitutes: Limited, given cysteine's unique biochemical properties.
- End-User Demographics: Growing demand from food and pharmaceutical industries.
- M&A Trends: Significant M&A activity in the recent past, indicating strategic market consolidation. xx M&A deals were recorded between 2019-2024.
Cysteine Market Growth Trends & Insights
The global cysteine market exhibits robust growth, driven by increasing demand across various applications. The market witnessed a CAGR of xx% during 2019-2024 and is projected to grow at a CAGR of xx% from 2025 to 2033. This growth is attributed to rising demand from the pharmaceutical and food industries, coupled with technological advancements leading to cost-effective production methods. Consumer preference for healthier food products and increasing adoption of cysteine in pharmaceutical applications are further fueling market expansion. Market penetration in emerging economies is also expected to drive future growth. Technological disruptions, specifically the development of more efficient and sustainable fermentation processes, are significantly impacting production costs and market dynamics.
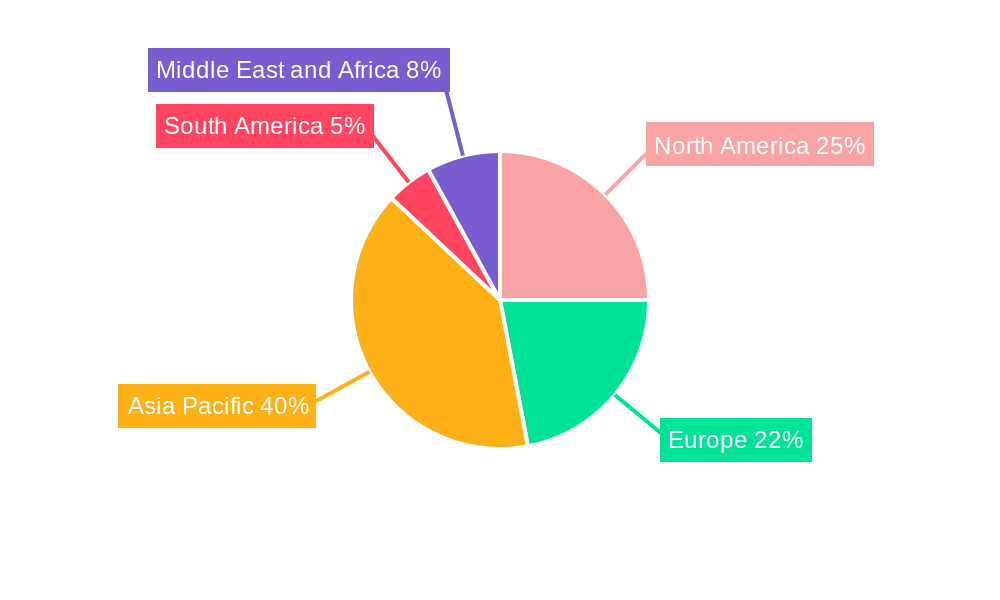
Dominant Regions, Countries, or Segments in Cysteine Market
The Asia-Pacific region dominates the global cysteine market, driven by robust economic growth, expanding food and pharmaceutical industries, and increasing consumer demand. China and Japan are key contributors to regional dominance. Within application segments, the pharmaceutical industry commands the largest market share due to cysteine's crucial role in insulin production and other therapeutic applications. The synthetic production process holds a larger share compared to natural extraction owing to its cost-effectiveness and scalability.
- Leading Region: Asia-Pacific (xx% market share in 2024).
- Key Countries: China, Japan, and India.
- Dominant Application Segment: Pharmaceutical (xx% market share in 2024).
- Dominant Production Process: Synthetic (xx% market share in 2024).
- Key Growth Drivers: Strong economic growth in Asia-Pacific, increasing healthcare expenditure, rising demand for functional foods.
Cysteine Market Product Landscape
The cysteine market offers a range of products, including L-cysteine, L-cysteine hydrochloride, and N-acetyl-L-cysteine (NAC), each catering to specific applications. Technological advancements focus on improving production efficiency and purity, while new formulations enhance bioavailability and efficacy. The market is witnessing the development of novel cysteine derivatives with improved functionalities and tailored applications. Unique selling propositions include high purity, cost-effectiveness, and consistent quality.
Key Drivers, Barriers & Challenges in Cysteine Market
Key Drivers:
- Growing demand from the pharmaceutical industry (insulin production, dietary supplements).
- Increasing demand for functional foods and nutritional supplements.
- Technological advancements in cost-effective production methods.
- Expanding applications in animal feed and cosmetics.
Key Challenges & Restraints:
- Fluctuations in raw material prices.
- Stringent regulatory requirements for pharmaceutical applications.
- Intense competition among established players.
- Potential supply chain disruptions.
- Environmental concerns related to certain production processes.
Emerging Opportunities in Cysteine Market
- Untapped markets in developing economies.
- Growth in the dietary supplement market.
- Development of novel applications in cosmetics and personal care.
- Increasing demand for high-purity cysteine in research and development.
- Exploring innovative applications in biotechnology and agriculture.
Growth Accelerators in the Cysteine Market Industry
Strategic partnerships and collaborations among industry players are boosting market growth. Technological breakthroughs in production efficiency and cost reduction are creating new opportunities for market expansion. The exploration of new applications in emerging sectors like cosmetics and animal feed is expected to fuel future growth. Increased investments in research and development aimed at optimizing cysteine production and developing innovative applications are key growth drivers.
Key Players Shaping the Cysteine Market Market
- Wuxi Bikang Bioengineering Co Ltd
- Merck KGaA
- Shanghai Cosroma Biotech Co Ltd
- Donboo Amino Acid Co Ltd
- NIPPON RIKA Co LTD
- Ajinomoto Co Inc
- Wuhan Grand Hoyo Co Ltd
- Shine Star (Hubei) Biological Engineering Co Ltd
- Wacker Chemie AG
- CJ CHEILJEDANG CORP
Notable Milestones in Cysteine Market Sector
- December 2022: Wacker Chemie AG announces plans to expand its cysteine production capacity in China.
- October 2021: Merck KGaA acquires Sigma-Aldrich, a leading supplier of cysteine.
- March 2020: Ajinomoto Co. Inc. develops a new fermentation process for cysteine production, reducing production costs and environmental impact.
In-Depth Cysteine Market Market Outlook
The future of the cysteine market looks promising, driven by sustained growth in key end-user industries and ongoing technological advancements. The market is poised for significant expansion, particularly in emerging economies and novel applications. Strategic partnerships, investments in research and development, and focus on sustainable production methods will shape future market dynamics. The market is expected to see continued consolidation through M&A activities and further development of innovative cysteine-based products.
Cysteine Market Segmentation
-
1. Production Process
- 1.1. Natural
- 1.2. Synthetic
-
2. Application
- 2.1. Conditioner
- 2.2. Flavor Enhancer
- 2.3. Reducing Agent
- 2.4. Production of Human Insulin
- 2.5. Other Applications (Anti-aging Agent)
-
3. End-user Industry
- 3.1. Food
- 3.2. Pharmaceutical
- 3.3. Animal Feed
- 3.4. Other End-user Industries (Marine)
Cysteine Market Segmentation By Geography
-
1. Asia Pacific
- 1.1. China
- 1.2. India
- 1.3. Japan
- 1.4. South Korea
- 1.5. ASEAN Countries
- 1.6. Rest of Asia Pacific
-
2. North America
- 2.1. United States
- 2.2. Canada
- 2.3. Mexico
-
3. Europe
- 3.1. Germany
- 3.2. United Kingdom
- 3.3. France
- 3.4. Italy
- 3.5. Russia
- 3.6. Nordic Countries
- 3.7. Rest of Europe
-
4. South America
- 4.1. Brazil
- 4.2. Argentina
- 4.3. Rest of South America
-
5. Middle East and Africa
- 5.1. GCC Countries
- 5.2. South Africa
- 5.3. Rest of Middle East and Africa
Cysteine Market Regional Market Share
Geographic Coverage of Cysteine Market
Cysteine Market REPORT HIGHLIGHTS
| Aspects | Details |
|---|---|
| Study Period | 2020-2034 |
| Base Year | 2025 |
| Estimated Year | 2026 |
| Forecast Period | 2026-2034 |
| Historical Period | 2020-2025 |
| Growth Rate | CAGR of > 5.00% from 2020-2034 |
| Segmentation |
|
Table of Contents
- 1. Introduction
- 1.1. Research Scope
- 1.2. Market Segmentation
- 1.3. Research Objective
- 1.4. Definitions and Assumptions
- 2. Executive Summary
- 2.1. Market Snapshot
- 3. Market Dynamics
- 3.1. Market Drivers
- 3.2. Market Restrains
- 3.3. Market Trends
- 3.4. Market Opportunities
- 4. Market Factor Analysis
- 4.1. Porters Five Forces
- 4.1.1. Bargaining Power of Suppliers
- 4.1.2. Bargaining Power of Buyers
- 4.1.3. Threat of New Entrants
- 4.1.4. Threat of Substitutes
- 4.1.5. Competitive Rivalry
- 4.2. PESTEL analysis
- 4.3. BCG Analysis
- 4.3.1. Stars (High Growth, High Market Share)
- 4.3.2. Cash Cows (Low Growth, High Market Share)
- 4.3.3. Question Mark (High Growth, Low Market Share)
- 4.3.4. Dogs (Low Growth, Low Market Share)
- 4.4. Ansoff Matrix Analysis
- 4.5. Supply Chain Analysis
- 4.6. Regulatory Landscape
- 4.7. Current Market Potential and Opportunity Assessment (TAM–SAM–SOM Framework)
- 4.8. VDR Analyst Note
- 4.1. Porters Five Forces
- 5. Market Analysis, Insights and Forecast 2021-2033
- 5.1. Market Analysis, Insights and Forecast - by Production Process
- 5.1.1. Natural
- 5.1.2. Synthetic
- 5.2. Market Analysis, Insights and Forecast - by Application
- 5.2.1. Conditioner
- 5.2.2. Flavor Enhancer
- 5.2.3. Reducing Agent
- 5.2.4. Production of Human Insulin
- 5.2.5. Other Applications (Anti-aging Agent)
- 5.3. Market Analysis, Insights and Forecast - by End-user Industry
- 5.3.1. Food
- 5.3.2. Pharmaceutical
- 5.3.3. Animal Feed
- 5.3.4. Other End-user Industries (Marine)
- 5.4. Market Analysis, Insights and Forecast - by Region
- 5.4.1. Asia Pacific
- 5.4.2. North America
- 5.4.3. Europe
- 5.4.4. South America
- 5.4.5. Middle East and Africa
- 5.1. Market Analysis, Insights and Forecast - by Production Process
- 6. Global Cysteine Market Analysis, Insights and Forecast, 2021-2033
- 6.1. Market Analysis, Insights and Forecast - by Production Process
- 6.1.1. Natural
- 6.1.2. Synthetic
- 6.2. Market Analysis, Insights and Forecast - by Application
- 6.2.1. Conditioner
- 6.2.2. Flavor Enhancer
- 6.2.3. Reducing Agent
- 6.2.4. Production of Human Insulin
- 6.2.5. Other Applications (Anti-aging Agent)
- 6.3. Market Analysis, Insights and Forecast - by End-user Industry
- 6.3.1. Food
- 6.3.2. Pharmaceutical
- 6.3.3. Animal Feed
- 6.3.4. Other End-user Industries (Marine)
- 6.1. Market Analysis, Insights and Forecast - by Production Process
- 7. Asia Pacific Cysteine Market Analysis, Insights and Forecast, 2021-2033
- 7.1. Market Analysis, Insights and Forecast - by Production Process
- 7.1.1. Natural
- 7.1.2. Synthetic
- 7.2. Market Analysis, Insights and Forecast - by Application
- 7.2.1. Conditioner
- 7.2.2. Flavor Enhancer
- 7.2.3. Reducing Agent
- 7.2.4. Production of Human Insulin
- 7.2.5. Other Applications (Anti-aging Agent)
- 7.3. Market Analysis, Insights and Forecast - by End-user Industry
- 7.3.1. Food
- 7.3.2. Pharmaceutical
- 7.3.3. Animal Feed
- 7.3.4. Other End-user Industries (Marine)
- 7.1. Market Analysis, Insights and Forecast - by Production Process
- 8. North America Cysteine Market Analysis, Insights and Forecast, 2021-2033
- 8.1. Market Analysis, Insights and Forecast - by Production Process
- 8.1.1. Natural
- 8.1.2. Synthetic
- 8.2. Market Analysis, Insights and Forecast - by Application
- 8.2.1. Conditioner
- 8.2.2. Flavor Enhancer
- 8.2.3. Reducing Agent
- 8.2.4. Production of Human Insulin
- 8.2.5. Other Applications (Anti-aging Agent)
- 8.3. Market Analysis, Insights and Forecast - by End-user Industry
- 8.3.1. Food
- 8.3.2. Pharmaceutical
- 8.3.3. Animal Feed
- 8.3.4. Other End-user Industries (Marine)
- 8.1. Market Analysis, Insights and Forecast - by Production Process
- 9. Europe Cysteine Market Analysis, Insights and Forecast, 2021-2033
- 9.1. Market Analysis, Insights and Forecast - by Production Process
- 9.1.1. Natural
- 9.1.2. Synthetic
- 9.2. Market Analysis, Insights and Forecast - by Application
- 9.2.1. Conditioner
- 9.2.2. Flavor Enhancer
- 9.2.3. Reducing Agent
- 9.2.4. Production of Human Insulin
- 9.2.5. Other Applications (Anti-aging Agent)
- 9.3. Market Analysis, Insights and Forecast - by End-user Industry
- 9.3.1. Food
- 9.3.2. Pharmaceutical
- 9.3.3. Animal Feed
- 9.3.4. Other End-user Industries (Marine)
- 9.1. Market Analysis, Insights and Forecast - by Production Process
- 10. South America Cysteine Market Analysis, Insights and Forecast, 2021-2033
- 10.1. Market Analysis, Insights and Forecast - by Production Process
- 10.1.1. Natural
- 10.1.2. Synthetic
- 10.2. Market Analysis, Insights and Forecast - by Application
- 10.2.1. Conditioner
- 10.2.2. Flavor Enhancer
- 10.2.3. Reducing Agent
- 10.2.4. Production of Human Insulin
- 10.2.5. Other Applications (Anti-aging Agent)
- 10.3. Market Analysis, Insights and Forecast - by End-user Industry
- 10.3.1. Food
- 10.3.2. Pharmaceutical
- 10.3.3. Animal Feed
- 10.3.4. Other End-user Industries (Marine)
- 10.1. Market Analysis, Insights and Forecast - by Production Process
- 11. Middle East and Africa Cysteine Market Analysis, Insights and Forecast, 2021-2033
- 11.1. Market Analysis, Insights and Forecast - by Production Process
- 11.1.1. Natural
- 11.1.2. Synthetic
- 11.2. Market Analysis, Insights and Forecast - by Application
- 11.2.1. Conditioner
- 11.2.2. Flavor Enhancer
- 11.2.3. Reducing Agent
- 11.2.4. Production of Human Insulin
- 11.2.5. Other Applications (Anti-aging Agent)
- 11.3. Market Analysis, Insights and Forecast - by End-user Industry
- 11.3.1. Food
- 11.3.2. Pharmaceutical
- 11.3.3. Animal Feed
- 11.3.4. Other End-user Industries (Marine)
- 11.1. Market Analysis, Insights and Forecast - by Production Process
- 12. Competitive Analysis
- 12.1. Company Profiles
- 12.1.1 Wuxi Bikang Bioengineering Co Ltd *List Not Exhaustive
- 12.1.1.1. Company Overview
- 12.1.1.2. Products
- 12.1.1.3. Company Financials
- 12.1.1.4. SWOT Analysis
- 12.1.2 Merck KGaA
- 12.1.2.1. Company Overview
- 12.1.2.2. Products
- 12.1.2.3. Company Financials
- 12.1.2.4. SWOT Analysis
- 12.1.3 Shanghai Cosroma Biotech Co Ltd
- 12.1.3.1. Company Overview
- 12.1.3.2. Products
- 12.1.3.3. Company Financials
- 12.1.3.4. SWOT Analysis
- 12.1.4 Donboo Amino Acid Co Ltd
- 12.1.4.1. Company Overview
- 12.1.4.2. Products
- 12.1.4.3. Company Financials
- 12.1.4.4. SWOT Analysis
- 12.1.5 NIPPON RIKA Co LTD
- 12.1.5.1. Company Overview
- 12.1.5.2. Products
- 12.1.5.3. Company Financials
- 12.1.5.4. SWOT Analysis
- 12.1.6 Ajinomoto Co Inc
- 12.1.6.1. Company Overview
- 12.1.6.2. Products
- 12.1.6.3. Company Financials
- 12.1.6.4. SWOT Analysis
- 12.1.7 Wuhan Grand Hoyo Co Ltd
- 12.1.7.1. Company Overview
- 12.1.7.2. Products
- 12.1.7.3. Company Financials
- 12.1.7.4. SWOT Analysis
- 12.1.8 Shine Star (Hubei) Biological Engineering Co Ltd
- 12.1.8.1. Company Overview
- 12.1.8.2. Products
- 12.1.8.3. Company Financials
- 12.1.8.4. SWOT Analysis
- 12.1.9 Wacker Chemie AG
- 12.1.9.1. Company Overview
- 12.1.9.2. Products
- 12.1.9.3. Company Financials
- 12.1.9.4. SWOT Analysis
- 12.1.10 CJ CHEILJEDANG CORP
- 12.1.10.1. Company Overview
- 12.1.10.2. Products
- 12.1.10.3. Company Financials
- 12.1.10.4. SWOT Analysis
- 12.1.1 Wuxi Bikang Bioengineering Co Ltd *List Not Exhaustive
- 12.2. Market Entropy
- 12.2.1 Company's Key Areas Served
- 12.2.2 Recent Developments
- 12.3. Company Market Share Analysis 2025
- 12.3.1 Top 5 Companies Market Share Analysis
- 12.3.2 Top 3 Companies Market Share Analysis
- 12.4. List of Potential Customers
- 13. Research Methodology
List of Figures
- Figure 1: Global Cysteine Market Revenue Breakdown (Million, %) by Region 2025 & 2033
- Figure 2: Global Cysteine Market Volume Breakdown (kilotons, %) by Region 2025 & 2033
- Figure 3: Asia Pacific Cysteine Market Revenue (Million), by Production Process 2025 & 2033
- Figure 4: Asia Pacific Cysteine Market Volume (kilotons), by Production Process 2025 & 2033
- Figure 5: Asia Pacific Cysteine Market Revenue Share (%), by Production Process 2025 & 2033
- Figure 6: Asia Pacific Cysteine Market Volume Share (%), by Production Process 2025 & 2033
- Figure 7: Asia Pacific Cysteine Market Revenue (Million), by Application 2025 & 2033
- Figure 8: Asia Pacific Cysteine Market Volume (kilotons), by Application 2025 & 2033
- Figure 9: Asia Pacific Cysteine Market Revenue Share (%), by Application 2025 & 2033
- Figure 10: Asia Pacific Cysteine Market Volume Share (%), by Application 2025 & 2033
- Figure 11: Asia Pacific Cysteine Market Revenue (Million), by End-user Industry 2025 & 2033
- Figure 12: Asia Pacific Cysteine Market Volume (kilotons), by End-user Industry 2025 & 2033
- Figure 13: Asia Pacific Cysteine Market Revenue Share (%), by End-user Industry 2025 & 2033
- Figure 14: Asia Pacific Cysteine Market Volume Share (%), by End-user Industry 2025 & 2033
- Figure 15: Asia Pacific Cysteine Market Revenue (Million), by Country 2025 & 2033
- Figure 16: Asia Pacific Cysteine Market Volume (kilotons), by Country 2025 & 2033
- Figure 17: Asia Pacific Cysteine Market Revenue Share (%), by Country 2025 & 2033
- Figure 18: Asia Pacific Cysteine Market Volume Share (%), by Country 2025 & 2033
- Figure 19: North America Cysteine Market Revenue (Million), by Production Process 2025 & 2033
- Figure 20: North America Cysteine Market Volume (kilotons), by Production Process 2025 & 2033
- Figure 21: North America Cysteine Market Revenue Share (%), by Production Process 2025 & 2033
- Figure 22: North America Cysteine Market Volume Share (%), by Production Process 2025 & 2033
- Figure 23: North America Cysteine Market Revenue (Million), by Application 2025 & 2033
- Figure 24: North America Cysteine Market Volume (kilotons), by Application 2025 & 2033
- Figure 25: North America Cysteine Market Revenue Share (%), by Application 2025 & 2033
- Figure 26: North America Cysteine Market Volume Share (%), by Application 2025 & 2033
- Figure 27: North America Cysteine Market Revenue (Million), by End-user Industry 2025 & 2033
- Figure 28: North America Cysteine Market Volume (kilotons), by End-user Industry 2025 & 2033
- Figure 29: North America Cysteine Market Revenue Share (%), by End-user Industry 2025 & 2033
- Figure 30: North America Cysteine Market Volume Share (%), by End-user Industry 2025 & 2033
- Figure 31: North America Cysteine Market Revenue (Million), by Country 2025 & 2033
- Figure 32: North America Cysteine Market Volume (kilotons), by Country 2025 & 2033
- Figure 33: North America Cysteine Market Revenue Share (%), by Country 2025 & 2033
- Figure 34: North America Cysteine Market Volume Share (%), by Country 2025 & 2033
- Figure 35: Europe Cysteine Market Revenue (Million), by Production Process 2025 & 2033
- Figure 36: Europe Cysteine Market Volume (kilotons), by Production Process 2025 & 2033
- Figure 37: Europe Cysteine Market Revenue Share (%), by Production Process 2025 & 2033
- Figure 38: Europe Cysteine Market Volume Share (%), by Production Process 2025 & 2033
- Figure 39: Europe Cysteine Market Revenue (Million), by Application 2025 & 2033
- Figure 40: Europe Cysteine Market Volume (kilotons), by Application 2025 & 2033
- Figure 41: Europe Cysteine Market Revenue Share (%), by Application 2025 & 2033
- Figure 42: Europe Cysteine Market Volume Share (%), by Application 2025 & 2033
- Figure 43: Europe Cysteine Market Revenue (Million), by End-user Industry 2025 & 2033
- Figure 44: Europe Cysteine Market Volume (kilotons), by End-user Industry 2025 & 2033
- Figure 45: Europe Cysteine Market Revenue Share (%), by End-user Industry 2025 & 2033
- Figure 46: Europe Cysteine Market Volume Share (%), by End-user Industry 2025 & 2033
- Figure 47: Europe Cysteine Market Revenue (Million), by Country 2025 & 2033
- Figure 48: Europe Cysteine Market Volume (kilotons), by Country 2025 & 2033
- Figure 49: Europe Cysteine Market Revenue Share (%), by Country 2025 & 2033
- Figure 50: Europe Cysteine Market Volume Share (%), by Country 2025 & 2033
- Figure 51: South America Cysteine Market Revenue (Million), by Production Process 2025 & 2033
- Figure 52: South America Cysteine Market Volume (kilotons), by Production Process 2025 & 2033
- Figure 53: South America Cysteine Market Revenue Share (%), by Production Process 2025 & 2033
- Figure 54: South America Cysteine Market Volume Share (%), by Production Process 2025 & 2033
- Figure 55: South America Cysteine Market Revenue (Million), by Application 2025 & 2033
- Figure 56: South America Cysteine Market Volume (kilotons), by Application 2025 & 2033
- Figure 57: South America Cysteine Market Revenue Share (%), by Application 2025 & 2033
- Figure 58: South America Cysteine Market Volume Share (%), by Application 2025 & 2033
- Figure 59: South America Cysteine Market Revenue (Million), by End-user Industry 2025 & 2033
- Figure 60: South America Cysteine Market Volume (kilotons), by End-user Industry 2025 & 2033
- Figure 61: South America Cysteine Market Revenue Share (%), by End-user Industry 2025 & 2033
- Figure 62: South America Cysteine Market Volume Share (%), by End-user Industry 2025 & 2033
- Figure 63: South America Cysteine Market Revenue (Million), by Country 2025 & 2033
- Figure 64: South America Cysteine Market Volume (kilotons), by Country 2025 & 2033
- Figure 65: South America Cysteine Market Revenue Share (%), by Country 2025 & 2033
- Figure 66: South America Cysteine Market Volume Share (%), by Country 2025 & 2033
- Figure 67: Middle East and Africa Cysteine Market Revenue (Million), by Production Process 2025 & 2033
- Figure 68: Middle East and Africa Cysteine Market Volume (kilotons), by Production Process 2025 & 2033
- Figure 69: Middle East and Africa Cysteine Market Revenue Share (%), by Production Process 2025 & 2033
- Figure 70: Middle East and Africa Cysteine Market Volume Share (%), by Production Process 2025 & 2033
- Figure 71: Middle East and Africa Cysteine Market Revenue (Million), by Application 2025 & 2033
- Figure 72: Middle East and Africa Cysteine Market Volume (kilotons), by Application 2025 & 2033
- Figure 73: Middle East and Africa Cysteine Market Revenue Share (%), by Application 2025 & 2033
- Figure 74: Middle East and Africa Cysteine Market Volume Share (%), by Application 2025 & 2033
- Figure 75: Middle East and Africa Cysteine Market Revenue (Million), by End-user Industry 2025 & 2033
- Figure 76: Middle East and Africa Cysteine Market Volume (kilotons), by End-user Industry 2025 & 2033
- Figure 77: Middle East and Africa Cysteine Market Revenue Share (%), by End-user Industry 2025 & 2033
- Figure 78: Middle East and Africa Cysteine Market Volume Share (%), by End-user Industry 2025 & 2033
- Figure 79: Middle East and Africa Cysteine Market Revenue (Million), by Country 2025 & 2033
- Figure 80: Middle East and Africa Cysteine Market Volume (kilotons), by Country 2025 & 2033
- Figure 81: Middle East and Africa Cysteine Market Revenue Share (%), by Country 2025 & 2033
- Figure 82: Middle East and Africa Cysteine Market Volume Share (%), by Country 2025 & 2033
List of Tables
- Table 1: Global Cysteine Market Revenue Million Forecast, by Production Process 2020 & 2033
- Table 2: Global Cysteine Market Volume kilotons Forecast, by Production Process 2020 & 2033
- Table 3: Global Cysteine Market Revenue Million Forecast, by Application 2020 & 2033
- Table 4: Global Cysteine Market Volume kilotons Forecast, by Application 2020 & 2033
- Table 5: Global Cysteine Market Revenue Million Forecast, by End-user Industry 2020 & 2033
- Table 6: Global Cysteine Market Volume kilotons Forecast, by End-user Industry 2020 & 2033
- Table 7: Global Cysteine Market Revenue Million Forecast, by Region 2020 & 2033
- Table 8: Global Cysteine Market Volume kilotons Forecast, by Region 2020 & 2033
- Table 9: Global Cysteine Market Revenue Million Forecast, by Production Process 2020 & 2033
- Table 10: Global Cysteine Market Volume kilotons Forecast, by Production Process 2020 & 2033
- Table 11: Global Cysteine Market Revenue Million Forecast, by Application 2020 & 2033
- Table 12: Global Cysteine Market Volume kilotons Forecast, by Application 2020 & 2033
- Table 13: Global Cysteine Market Revenue Million Forecast, by End-user Industry 2020 & 2033
- Table 14: Global Cysteine Market Volume kilotons Forecast, by End-user Industry 2020 & 2033
- Table 15: Global Cysteine Market Revenue Million Forecast, by Country 2020 & 2033
- Table 16: Global Cysteine Market Volume kilotons Forecast, by Country 2020 & 2033
- Table 17: China Cysteine Market Revenue (Million) Forecast, by Application 2020 & 2033
- Table 18: China Cysteine Market Volume (kilotons) Forecast, by Application 2020 & 2033
- Table 19: India Cysteine Market Revenue (Million) Forecast, by Application 2020 & 2033
- Table 20: India Cysteine Market Volume (kilotons) Forecast, by Application 2020 & 2033
- Table 21: Japan Cysteine Market Revenue (Million) Forecast, by Application 2020 & 2033
- Table 22: Japan Cysteine Market Volume (kilotons) Forecast, by Application 2020 & 2033
- Table 23: South Korea Cysteine Market Revenue (Million) Forecast, by Application 2020 & 2033
- Table 24: South Korea Cysteine Market Volume (kilotons) Forecast, by Application 2020 & 2033
- Table 25: ASEAN Countries Cysteine Market Revenue (Million) Forecast, by Application 2020 & 2033
- Table 26: ASEAN Countries Cysteine Market Volume (kilotons) Forecast, by Application 2020 & 2033
- Table 27: Rest of Asia Pacific Cysteine Market Revenue (Million) Forecast, by Application 2020 & 2033
- Table 28: Rest of Asia Pacific Cysteine Market Volume (kilotons) Forecast, by Application 2020 & 2033
- Table 29: Global Cysteine Market Revenue Million Forecast, by Production Process 2020 & 2033
- Table 30: Global Cysteine Market Volume kilotons Forecast, by Production Process 2020 & 2033
- Table 31: Global Cysteine Market Revenue Million Forecast, by Application 2020 & 2033
- Table 32: Global Cysteine Market Volume kilotons Forecast, by Application 2020 & 2033
- Table 33: Global Cysteine Market Revenue Million Forecast, by End-user Industry 2020 & 2033
- Table 34: Global Cysteine Market Volume kilotons Forecast, by End-user Industry 2020 & 2033
- Table 35: Global Cysteine Market Revenue Million Forecast, by Country 2020 & 2033
- Table 36: Global Cysteine Market Volume kilotons Forecast, by Country 2020 & 2033
- Table 37: United States Cysteine Market Revenue (Million) Forecast, by Application 2020 & 2033
- Table 38: United States Cysteine Market Volume (kilotons) Forecast, by Application 2020 & 2033
- Table 39: Canada Cysteine Market Revenue (Million) Forecast, by Application 2020 & 2033
- Table 40: Canada Cysteine Market Volume (kilotons) Forecast, by Application 2020 & 2033
- Table 41: Mexico Cysteine Market Revenue (Million) Forecast, by Application 2020 & 2033
- Table 42: Mexico Cysteine Market Volume (kilotons) Forecast, by Application 2020 & 2033
- Table 43: Global Cysteine Market Revenue Million Forecast, by Production Process 2020 & 2033
- Table 44: Global Cysteine Market Volume kilotons Forecast, by Production Process 2020 & 2033
- Table 45: Global Cysteine Market Revenue Million Forecast, by Application 2020 & 2033
- Table 46: Global Cysteine Market Volume kilotons Forecast, by Application 2020 & 2033
- Table 47: Global Cysteine Market Revenue Million Forecast, by End-user Industry 2020 & 2033
- Table 48: Global Cysteine Market Volume kilotons Forecast, by End-user Industry 2020 & 2033
- Table 49: Global Cysteine Market Revenue Million Forecast, by Country 2020 & 2033
- Table 50: Global Cysteine Market Volume kilotons Forecast, by Country 2020 & 2033
- Table 51: Germany Cysteine Market Revenue (Million) Forecast, by Application 2020 & 2033
- Table 52: Germany Cysteine Market Volume (kilotons) Forecast, by Application 2020 & 2033
- Table 53: United Kingdom Cysteine Market Revenue (Million) Forecast, by Application 2020 & 2033
- Table 54: United Kingdom Cysteine Market Volume (kilotons) Forecast, by Application 2020 & 2033
- Table 55: France Cysteine Market Revenue (Million) Forecast, by Application 2020 & 2033
- Table 56: France Cysteine Market Volume (kilotons) Forecast, by Application 2020 & 2033
- Table 57: Italy Cysteine Market Revenue (Million) Forecast, by Application 2020 & 2033
- Table 58: Italy Cysteine Market Volume (kilotons) Forecast, by Application 2020 & 2033
- Table 59: Russia Cysteine Market Revenue (Million) Forecast, by Application 2020 & 2033
- Table 60: Russia Cysteine Market Volume (kilotons) Forecast, by Application 2020 & 2033
- Table 61: Nordic Countries Cysteine Market Revenue (Million) Forecast, by Application 2020 & 2033
- Table 62: Nordic Countries Cysteine Market Volume (kilotons) Forecast, by Application 2020 & 2033
- Table 63: Rest of Europe Cysteine Market Revenue (Million) Forecast, by Application 2020 & 2033
- Table 64: Rest of Europe Cysteine Market Volume (kilotons) Forecast, by Application 2020 & 2033
- Table 65: Global Cysteine Market Revenue Million Forecast, by Production Process 2020 & 2033
- Table 66: Global Cysteine Market Volume kilotons Forecast, by Production Process 2020 & 2033
- Table 67: Global Cysteine Market Revenue Million Forecast, by Application 2020 & 2033
- Table 68: Global Cysteine Market Volume kilotons Forecast, by Application 2020 & 2033
- Table 69: Global Cysteine Market Revenue Million Forecast, by End-user Industry 2020 & 2033
- Table 70: Global Cysteine Market Volume kilotons Forecast, by End-user Industry 2020 & 2033
- Table 71: Global Cysteine Market Revenue Million Forecast, by Country 2020 & 2033
- Table 72: Global Cysteine Market Volume kilotons Forecast, by Country 2020 & 2033
- Table 73: Brazil Cysteine Market Revenue (Million) Forecast, by Application 2020 & 2033
- Table 74: Brazil Cysteine Market Volume (kilotons) Forecast, by Application 2020 & 2033
- Table 75: Argentina Cysteine Market Revenue (Million) Forecast, by Application 2020 & 2033
- Table 76: Argentina Cysteine Market Volume (kilotons) Forecast, by Application 2020 & 2033
- Table 77: Rest of South America Cysteine Market Revenue (Million) Forecast, by Application 2020 & 2033
- Table 78: Rest of South America Cysteine Market Volume (kilotons) Forecast, by Application 2020 & 2033
- Table 79: Global Cysteine Market Revenue Million Forecast, by Production Process 2020 & 2033
- Table 80: Global Cysteine Market Volume kilotons Forecast, by Production Process 2020 & 2033
- Table 81: Global Cysteine Market Revenue Million Forecast, by Application 2020 & 2033
- Table 82: Global Cysteine Market Volume kilotons Forecast, by Application 2020 & 2033
- Table 83: Global Cysteine Market Revenue Million Forecast, by End-user Industry 2020 & 2033
- Table 84: Global Cysteine Market Volume kilotons Forecast, by End-user Industry 2020 & 2033
- Table 85: Global Cysteine Market Revenue Million Forecast, by Country 2020 & 2033
- Table 86: Global Cysteine Market Volume kilotons Forecast, by Country 2020 & 2033
- Table 87: GCC Countries Cysteine Market Revenue (Million) Forecast, by Application 2020 & 2033
- Table 88: GCC Countries Cysteine Market Volume (kilotons) Forecast, by Application 2020 & 2033
- Table 89: South Africa Cysteine Market Revenue (Million) Forecast, by Application 2020 & 2033
- Table 90: South Africa Cysteine Market Volume (kilotons) Forecast, by Application 2020 & 2033
- Table 91: Rest of Middle East and Africa Cysteine Market Revenue (Million) Forecast, by Application 2020 & 2033
- Table 92: Rest of Middle East and Africa Cysteine Market Volume (kilotons) Forecast, by Application 2020 & 2033
Frequently Asked Questions
1. What is the projected Compound Annual Growth Rate (CAGR) of the Cysteine Market?
The projected CAGR is approximately > 5.00%.
2. Which companies are prominent players in the Cysteine Market?
Key companies in the market include Wuxi Bikang Bioengineering Co Ltd *List Not Exhaustive, Merck KGaA, Shanghai Cosroma Biotech Co Ltd, Donboo Amino Acid Co Ltd, NIPPON RIKA Co LTD, Ajinomoto Co Inc, Wuhan Grand Hoyo Co Ltd, Shine Star (Hubei) Biological Engineering Co Ltd, Wacker Chemie AG, CJ CHEILJEDANG CORP.
3. What are the main segments of the Cysteine Market?
The market segments include Production Process, Application, End-user Industry.
4. Can you provide details about the market size?
The market size is estimated to be USD 365.9 Million as of 2022.
5. What are some drivers contributing to market growth?
Increasing Demand from the Bakery Industry; Rising Demand from Pharmaceutical Industry.
6. What are the notable trends driving market growth?
Food Industry to Dominate the Market.
7. Are there any restraints impacting market growth?
Increasing Concerns Related to Animal-sourced Cysteine; Harmful Effects of Cysteine on Human Body.
8. Can you provide examples of recent developments in the market?
2022: Wacker Chemie AG announces plans to expand its cysteine production capacity in China
9. What pricing options are available for accessing the report?
Pricing options include single-user, multi-user, and enterprise licenses priced at USD 4750, USD 5250, and USD 8750 respectively.
10. Is the market size provided in terms of value or volume?
The market size is provided in terms of value, measured in Million and volume, measured in kilotons.
11. Are there any specific market keywords associated with the report?
Yes, the market keyword associated with the report is "Cysteine Market," which aids in identifying and referencing the specific market segment covered.
12. How do I determine which pricing option suits my needs best?
The pricing options vary based on user requirements and access needs. Individual users may opt for single-user licenses, while businesses requiring broader access may choose multi-user or enterprise licenses for cost-effective access to the report.
13. Are there any additional resources or data provided in the Cysteine Market report?
While the report offers comprehensive insights, it's advisable to review the specific contents or supplementary materials provided to ascertain if additional resources or data are available.
14. How can I stay updated on further developments or reports in the Cysteine Market?
To stay informed about further developments, trends, and reports in the Cysteine Market, consider subscribing to industry newsletters, following relevant companies and organizations, or regularly checking reputable industry news sources and publications.
Methodology
Step 1 - Identification of Relevant Samples Size from Population Database


Step 2 - Approaches for Defining Global Market Size (Value, Volume* & Price*)

Note*: In applicable scenarios
Step 3 - Data Sources
Primary Research
- Web Analytics
- Survey Reports
- Research Institute
- Latest Research Reports
- Opinion Leaders
Secondary Research
- Annual Reports
- White Paper
- Latest Press Release
- Industry Association
- Paid Database
- Investor Presentations

Step 4 - Data Triangulation
Involves using different sources of information in order to increase the validity of a study
These sources are likely to be stakeholders in a program - participants, other researchers, program staff, other community members, and so on.
Then we put all data in single framework & apply various statistical tools to find out the dynamic on the market.
During the analysis stage, feedback from the stakeholder groups would be compared to determine areas of agreement as well as areas of divergence