


Key Insights
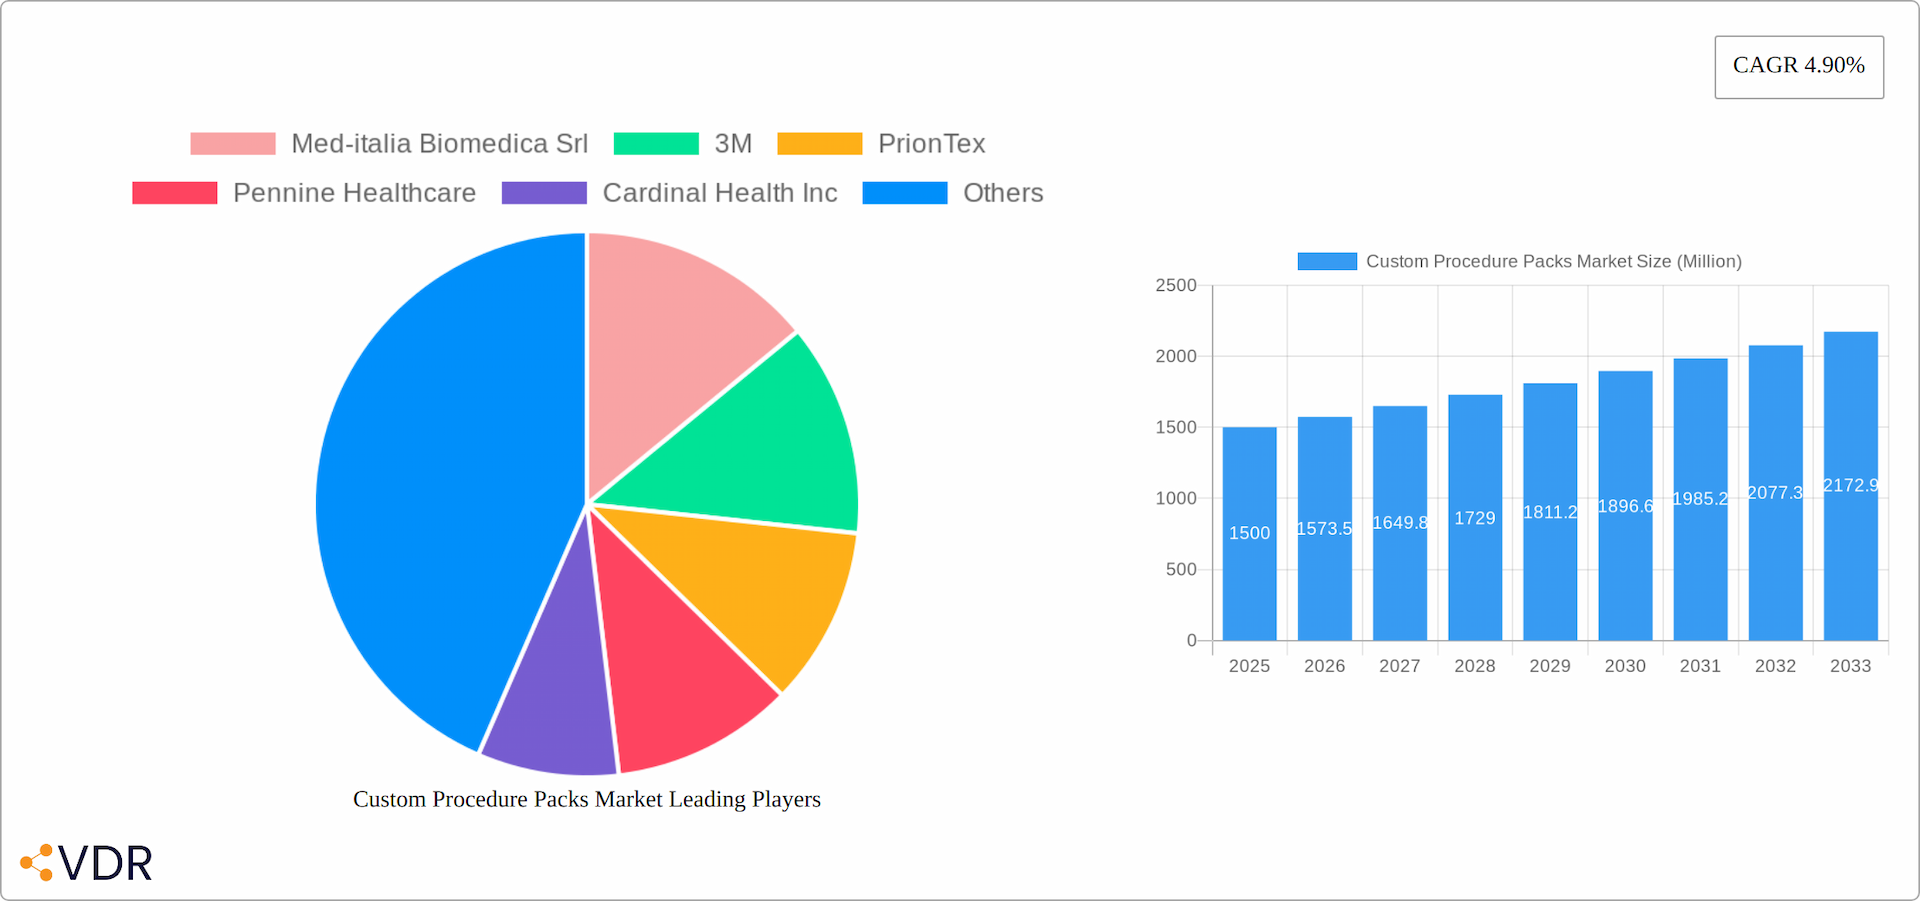
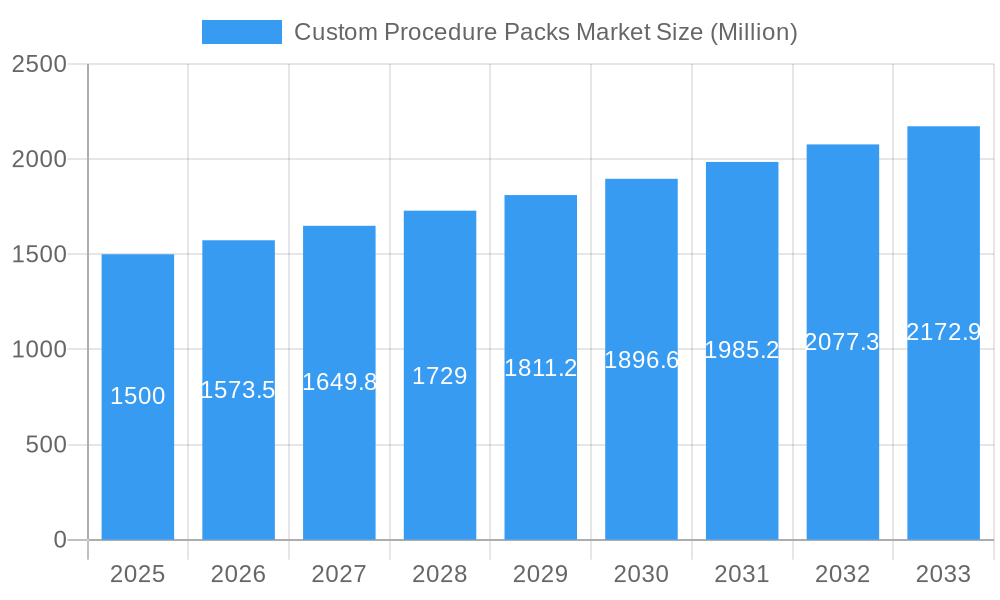
The Custom Procedure Packs market, valued at approximately $8.01 billion in 2025, is projected for robust expansion, exhibiting a Compound Annual Growth Rate (CAGR) of 4.7% from 2025 to 2033. This growth is driven by increasing global surgical volumes, a rising demand for efficient surgical workflows, and enhanced patient safety through pre-packaged, customized solutions. Hospitals and ambulatory surgical centers are adopting these packs to optimize operations and improve patient outcomes. The proliferation of minimally invasive surgeries and the growing prevalence of chronic diseases requiring surgical intervention further propel market growth. Technological innovations in specialized procedure packs also contribute significantly.
Custom Procedure Packs Market Market Size (In Billion)

Segmentation highlights cardiovascular and orthopedic surgery packs as key market segments due to high procedure volumes. While reusable packs are gaining traction for cost-effectiveness, single-use packs remain dominant, addressing sterilization and cross-contamination concerns.
Custom Procedure Packs Market Company Market Share
Geographically, North America leads the market, supported by substantial healthcare spending and advanced infrastructure. The Asia-Pacific region is anticipated to experience rapid growth, driven by rising disposable incomes, expanding healthcare facilities, and an increasing geriatric population necessitating more surgical interventions.
Despite a positive growth trajectory, market challenges include stringent regulatory approvals and raw material price volatility. However, ongoing innovation in packaging and sterilization, alongside advanced supply chain management, is expected to counter these restraints and ensure sustained market growth. Intensified competition among established players such as 3M, Cardinal Health, and Mölnlycke Health Care, alongside emerging regional entities, is anticipated to foster innovation and market consolidation.
Custom Procedure Packs Market: A Comprehensive Market Report (2019-2033)
This in-depth report provides a comprehensive analysis of the Custom Procedure Packs Market, encompassing market dynamics, growth trends, regional dominance, product landscape, key players, and future outlook. The study period covers 2019-2033, with 2025 serving as the base and estimated year. The report segments the market by Use (Single Use, Reusable), Product (Cardiovascular Surgery Packs, Cosmetic Surgery Packs, General Surgery Packs, Orthopedic Surgery Packs, Other Products), and End-User (Hospitals, Clinics, Ambulatory Surgical Centers). The market size is presented in million units.
Custom Procedure Packs Market Dynamics & Structure
The Custom Procedure Packs market is characterized by a moderately concentrated landscape with key players like 3M, Cardinal Health Inc., and Molnlycke Health Care AB holding significant market share (xx%). Technological advancements, particularly in minimally invasive surgery and sterilization techniques, are major drivers. Stringent regulatory frameworks, such as the Medical Devices Regulation (MDR) in Europe, significantly impact market dynamics. The market experiences competition from manufacturers of individual surgical instruments, though procedure packs offer convenience and cost-effectiveness. The market is witnessing a rise in M&A activity, with xx deals recorded between 2019 and 2024, mostly driven by strategic acquisitions to expand product portfolios and geographical reach.
- Market Concentration: Moderately concentrated, with top 5 players holding xx% market share.
- Technological Innovation: Focus on minimally invasive surgery, improved sterilization, and customized pack configurations.
- Regulatory Landscape: Stringent regulations (e.g., MDR) impacting product development and market entry.
- Competitive Substitutes: Individual surgical instruments.
- End-User Demographics: Growing aging population and increasing prevalence of chronic diseases drive demand.
- M&A Activity: xx deals between 2019 and 2024, primarily driven by expansion strategies.
Custom Procedure Packs Market Growth Trends & Insights
The Custom Procedure Packs market has demonstrated robust and consistent growth over the historical period (2019-2024), registering a Compound Annual Growth Rate (CAGR) of approximately xx%. This upward trajectory is underpinned by a confluence of critical factors. The escalating global prevalence of chronic diseases, leading to a surge in surgical interventions, remains a primary catalyst. Furthermore, the industry is witnessing a significant shift towards the adoption of minimally invasive surgical techniques, which often necessitate the use of precisely configured procedure packs. Healthcare providers are increasingly recognizing the inherent advantages of these packs, including enhanced efficiency, improved patient safety, and substantial cost-effectiveness. Looking ahead, the market is poised for sustained expansion during the forecast period (2025-2033), with an anticipated CAGR of around xx%. This future growth will be propelled by ongoing technological advancements, a burgeoning demand for highly customized and specialized procedure packs tailored to specific surgical needs, and the strategic expansion of market reach into burgeoning economies. Market penetration is projected to reach an impressive xx% by 2033. The landscape of custom procedure packs is also being significantly reshaped by disruptive technological innovations, such as the integration of surgical robotics and the burgeoning field of AI-assisted surgery. These advancements will not only influence the configuration of procedure packs but also drive the demand for novel and specialized instrumentation.
Dominant Regions, Countries, or Segments in Custom Procedure Packs Market
North America currently commands the largest share of the Custom Procedure Packs market. This dominance is attributed to its exceptionally high healthcare expenditure, well-established and advanced healthcare infrastructure, and a consistently high volume of surgical procedures performed annually. Following closely is Europe, which represents another significant market, bolstered by stringent regulatory frameworks and a deeply entrenched and well-developed healthcare sector. Within the market's segmentation, the Single-Use segment stands out as the most dominant. This preference is driven by the inherent advantages of single-use packs, including unparalleled convenience, enhanced hygiene, and significant cost-effectiveness, particularly in their role of mitigating the risk of hospital-acquired infections and cross-contamination. In terms of product categories, General Surgery Packs hold the largest share, reflecting their widespread applicability across a vast spectrum of surgical interventions. Consequently, Hospitals emerge as the primary end-users, due to their substantial and consistent surgical volumes.
- Key Drivers in North America: Substantial healthcare spending, sophisticated infrastructure, and a high incidence of chronic diseases necessitating surgical interventions.
- Key Drivers in Europe: Robust regulatory oversight, a mature and highly developed healthcare ecosystem.
- Single-Use Segment Dominance: Emphasizes convenience, superior hygiene standards, and cost efficiencies in infection control.
- General Surgery Packs Dominance: Characterized by their broad utility across a diverse range of surgical procedures.
- Hospitals as Primary End-Users: Driven by the sheer volume of surgical procedures conducted within these institutions.
Custom Procedure Packs Market Product Landscape
Custom procedure packs are designed to streamline surgical workflows by providing pre-sterilized and customized assortments of instruments and supplies tailored to specific procedures. Innovations focus on enhanced sterility, improved material compatibility, and ergonomic design features. Unique selling propositions emphasize convenience, efficiency, and cost-effectiveness. Technological advancements like incorporating smart sensors for real-time inventory management and traceability systems for improved supply chain efficiency are reshaping the market.
Key Drivers, Barriers & Challenges in Custom Procedure Packs Market
Key Drivers: The increasing prevalence of chronic diseases, the rising demand for minimally invasive surgical procedures, and the growing need for cost-effective healthcare solutions are driving the growth of the Custom Procedure Packs Market. Technological advancements in sterilization techniques and pack configuration also contribute to market expansion.
Key Challenges: Regulatory hurdles, including stringent compliance requirements and certification processes, pose a significant challenge. Supply chain disruptions, particularly those impacting raw material availability and transportation, can impact production and delivery. Intense competition among established players also creates a challenging market environment. xx% of manufacturers faced supply chain disruptions in 2024 leading to xx% increase in production costs.
Emerging Opportunities in Custom Procedure Packs Market
Significant untapped potential lies within developing economies that are experiencing rapid advancements in healthcare infrastructure. The burgeoning adoption of telehealth and the nascent stages of remote surgery present a compelling frontier for the development of specialized custom procedure packs specifically designed for these evolving modalities. Furthermore, the increasing global emphasis on personalized medicine is creating fertile ground for innovation, paving the way for the development of highly bespoke procedure packs meticulously tailored to the unique physiological and clinical needs of individual patients. This trend signifies a paradigm shift towards more targeted and patient-centric surgical solutions.
Growth Accelerators in the Custom Procedure Packs Market Industry
Technological breakthroughs in surgical techniques, such as robotic surgery, will fuel demand for specialized procedure packs. Strategic partnerships between manufacturers and healthcare providers to ensure customized solutions will drive market growth. Expansion into new geographical markets and the development of innovative pack configurations will accelerate market expansion.
Key Players Shaping the Custom Procedure Packs Market Market
- Med-italia Biomedica Srl
- 3M
- PrionTex
- Pennine Healthcare
- Cardinal Health Inc
- Molnlycke Health Care AB
- Owens & Minor Inc
- Unisurge International Ltd
- Kimal Group
- B Braun SE
- Medline Industries Inc
Notable Milestones in Custom Procedure Packs Market Sector
- August 2022: Pennine Healthcare achieved crucial Medical Devices Regulation (MDR) Certification for its Class I Sterile products, Class IIa devices, and its comprehensive range of Procedure Packs. This certification is a significant enabler, substantially expanding their market access and operational capabilities within the European Union.
- April 2022: Merit Medical Systems made a significant contribution to the market with the launch of its innovative ReSolve Thoracostomy Tray. This launch underscores advancements in minimally invasive procedures and is a direct driver for increased demand for specialized and advanced procedure packs designed for such interventions.
In-Depth Custom Procedure Packs Market Market Outlook
The Custom Procedure Packs market is poised for continued growth driven by ongoing technological advancements, increasing surgical volumes, and the growing preference for efficient healthcare solutions. Strategic partnerships, market expansions into developing economies, and the development of innovative product offerings will create substantial opportunities for market players in the coming years. The market is expected to witness a significant increase in the demand for customized and specialized procedure packs, tailored to the specific needs of different surgical procedures and healthcare settings.
Custom Procedure Packs Market Segmentation
-
1. Use
- 1.1. Single Use
- 1.2. Reusable
-
2. Product
- 2.1. Cardiovascular Surgery Packs
- 2.2. Cosmetic Surgery Packs
- 2.3. General Surgery Packs
- 2.4. Orthopedic Surgery Packs
- 2.5. Other Products
-
3. End-User
- 3.1. Hospitals
- 3.2. Clinics
- 3.3. Ambulatory Surgical Centers
Custom Procedure Packs Market Segmentation By Geography
-
1. North America
- 1.1. United States
- 1.2. Canada
- 1.3. Mexico
-
2. Europe
- 2.1. Germany
- 2.2. United Kingdom
- 2.3. France
- 2.4. Italy
- 2.5. Spain
- 2.6. Rest of Europe
-
3. Asia Pacific
- 3.1. China
- 3.2. Japan
- 3.3. India
- 3.4. Australia
- 3.5. South Korea
- 3.6. Rest of Asia Pacific
-
4. Middle East and Africa
- 4.1. GCC
- 4.2. South Africa
- 4.3. Rest of Middle East and Africa
-
5. South America
- 5.1. Brazil
- 5.2. Argentina
- 5.3. Rest of South America
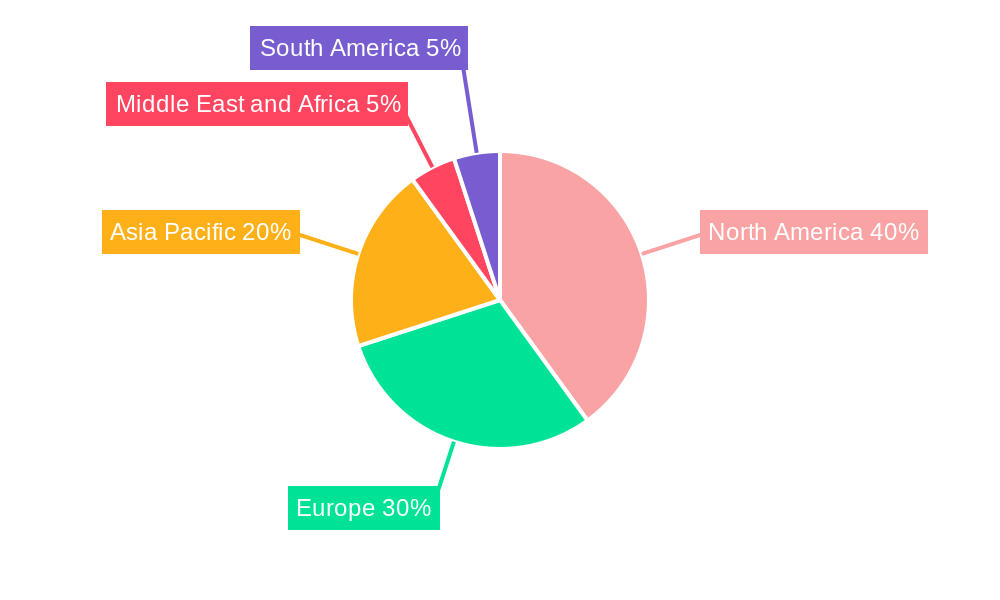
Custom Procedure Packs Market Regional Market Share
Geographic Coverage of Custom Procedure Packs Market
Custom Procedure Packs Market REPORT HIGHLIGHTS
| Aspects | Details |
|---|---|
| Study Period | 2020-2034 |
| Base Year | 2025 |
| Estimated Year | 2026 |
| Forecast Period | 2026-2034 |
| Historical Period | 2020-2025 |
| Growth Rate | CAGR of 4.7% from 2020-2034 |
| Segmentation |
|
Table of Contents
- 1. Introduction
- 1.1. Research Scope
- 1.2. Market Segmentation
- 1.3. Research Methodology
- 1.4. Definitions and Assumptions
- 2. Executive Summary
- 2.1. Introduction
- 3. Market Dynamics
- 3.1. Introduction
- 3.2. Market Drivers
- 3.2.1. Increasing Volume of Surgical Procedures; Rising Development and Launches of Innovative Tools
- 3.3. Market Restrains
- 3.3.1. Presence of Faulty and Unnecessary Devices along with the Procedure Packs
- 3.4. Market Trends
- 3.4.1. Cosmetic Surgery Packs Segment is Expected to Register a Significant Market Share Over the Forecast Period
- 4. Market Factor Analysis
- 4.1. Porters Five Forces
- 4.2. Supply/Value Chain
- 4.3. PESTEL analysis
- 4.4. Market Entropy
- 4.5. Patent/Trademark Analysis
- 5. Global Custom Procedure Packs Market Analysis, Insights and Forecast, 2020-2032
- 5.1. Market Analysis, Insights and Forecast - by Use
- 5.1.1. Single Use
- 5.1.2. Reusable
- 5.2. Market Analysis, Insights and Forecast - by Product
- 5.2.1. Cardiovascular Surgery Packs
- 5.2.2. Cosmetic Surgery Packs
- 5.2.3. General Surgery Packs
- 5.2.4. Orthopedic Surgery Packs
- 5.2.5. Other Products
- 5.3. Market Analysis, Insights and Forecast - by End-User
- 5.3.1. Hospitals
- 5.3.2. Clinics
- 5.3.3. Ambulatory Surgical Centers
- 5.4. Market Analysis, Insights and Forecast - by Region
- 5.4.1. North America
- 5.4.2. Europe
- 5.4.3. Asia Pacific
- 5.4.4. Middle East and Africa
- 5.4.5. South America
- 5.1. Market Analysis, Insights and Forecast - by Use
- 6. North America Custom Procedure Packs Market Analysis, Insights and Forecast, 2020-2032
- 6.1. Market Analysis, Insights and Forecast - by Use
- 6.1.1. Single Use
- 6.1.2. Reusable
- 6.2. Market Analysis, Insights and Forecast - by Product
- 6.2.1. Cardiovascular Surgery Packs
- 6.2.2. Cosmetic Surgery Packs
- 6.2.3. General Surgery Packs
- 6.2.4. Orthopedic Surgery Packs
- 6.2.5. Other Products
- 6.3. Market Analysis, Insights and Forecast - by End-User
- 6.3.1. Hospitals
- 6.3.2. Clinics
- 6.3.3. Ambulatory Surgical Centers
- 6.1. Market Analysis, Insights and Forecast - by Use
- 7. Europe Custom Procedure Packs Market Analysis, Insights and Forecast, 2020-2032
- 7.1. Market Analysis, Insights and Forecast - by Use
- 7.1.1. Single Use
- 7.1.2. Reusable
- 7.2. Market Analysis, Insights and Forecast - by Product
- 7.2.1. Cardiovascular Surgery Packs
- 7.2.2. Cosmetic Surgery Packs
- 7.2.3. General Surgery Packs
- 7.2.4. Orthopedic Surgery Packs
- 7.2.5. Other Products
- 7.3. Market Analysis, Insights and Forecast - by End-User
- 7.3.1. Hospitals
- 7.3.2. Clinics
- 7.3.3. Ambulatory Surgical Centers
- 7.1. Market Analysis, Insights and Forecast - by Use
- 8. Asia Pacific Custom Procedure Packs Market Analysis, Insights and Forecast, 2020-2032
- 8.1. Market Analysis, Insights and Forecast - by Use
- 8.1.1. Single Use
- 8.1.2. Reusable
- 8.2. Market Analysis, Insights and Forecast - by Product
- 8.2.1. Cardiovascular Surgery Packs
- 8.2.2. Cosmetic Surgery Packs
- 8.2.3. General Surgery Packs
- 8.2.4. Orthopedic Surgery Packs
- 8.2.5. Other Products
- 8.3. Market Analysis, Insights and Forecast - by End-User
- 8.3.1. Hospitals
- 8.3.2. Clinics
- 8.3.3. Ambulatory Surgical Centers
- 8.1. Market Analysis, Insights and Forecast - by Use
- 9. Middle East and Africa Custom Procedure Packs Market Analysis, Insights and Forecast, 2020-2032
- 9.1. Market Analysis, Insights and Forecast - by Use
- 9.1.1. Single Use
- 9.1.2. Reusable
- 9.2. Market Analysis, Insights and Forecast - by Product
- 9.2.1. Cardiovascular Surgery Packs
- 9.2.2. Cosmetic Surgery Packs
- 9.2.3. General Surgery Packs
- 9.2.4. Orthopedic Surgery Packs
- 9.2.5. Other Products
- 9.3. Market Analysis, Insights and Forecast - by End-User
- 9.3.1. Hospitals
- 9.3.2. Clinics
- 9.3.3. Ambulatory Surgical Centers
- 9.1. Market Analysis, Insights and Forecast - by Use
- 10. South America Custom Procedure Packs Market Analysis, Insights and Forecast, 2020-2032
- 10.1. Market Analysis, Insights and Forecast - by Use
- 10.1.1. Single Use
- 10.1.2. Reusable
- 10.2. Market Analysis, Insights and Forecast - by Product
- 10.2.1. Cardiovascular Surgery Packs
- 10.2.2. Cosmetic Surgery Packs
- 10.2.3. General Surgery Packs
- 10.2.4. Orthopedic Surgery Packs
- 10.2.5. Other Products
- 10.3. Market Analysis, Insights and Forecast - by End-User
- 10.3.1. Hospitals
- 10.3.2. Clinics
- 10.3.3. Ambulatory Surgical Centers
- 10.1. Market Analysis, Insights and Forecast - by Use
- 11. Competitive Analysis
- 11.1. Global Market Share Analysis 2025
- 11.2. Company Profiles
- 11.2.1 Med-italia Biomedica Srl
- 11.2.1.1. Overview
- 11.2.1.2. Products
- 11.2.1.3. SWOT Analysis
- 11.2.1.4. Recent Developments
- 11.2.1.5. Financials (Based on Availability)
- 11.2.2 3M
- 11.2.2.1. Overview
- 11.2.2.2. Products
- 11.2.2.3. SWOT Analysis
- 11.2.2.4. Recent Developments
- 11.2.2.5. Financials (Based on Availability)
- 11.2.3 PrionTex
- 11.2.3.1. Overview
- 11.2.3.2. Products
- 11.2.3.3. SWOT Analysis
- 11.2.3.4. Recent Developments
- 11.2.3.5. Financials (Based on Availability)
- 11.2.4 Pennine Healthcare
- 11.2.4.1. Overview
- 11.2.4.2. Products
- 11.2.4.3. SWOT Analysis
- 11.2.4.4. Recent Developments
- 11.2.4.5. Financials (Based on Availability)
- 11.2.5 Cardinal Health Inc
- 11.2.5.1. Overview
- 11.2.5.2. Products
- 11.2.5.3. SWOT Analysis
- 11.2.5.4. Recent Developments
- 11.2.5.5. Financials (Based on Availability)
- 11.2.6 Molnlycke Health Care AB
- 11.2.6.1. Overview
- 11.2.6.2. Products
- 11.2.6.3. SWOT Analysis
- 11.2.6.4. Recent Developments
- 11.2.6.5. Financials (Based on Availability)
- 11.2.7 Owens & Minor Inc
- 11.2.7.1. Overview
- 11.2.7.2. Products
- 11.2.7.3. SWOT Analysis
- 11.2.7.4. Recent Developments
- 11.2.7.5. Financials (Based on Availability)
- 11.2.8 Unisurge International Ltd
- 11.2.8.1. Overview
- 11.2.8.2. Products
- 11.2.8.3. SWOT Analysis
- 11.2.8.4. Recent Developments
- 11.2.8.5. Financials (Based on Availability)
- 11.2.9 Kimal Group
- 11.2.9.1. Overview
- 11.2.9.2. Products
- 11.2.9.3. SWOT Analysis
- 11.2.9.4. Recent Developments
- 11.2.9.5. Financials (Based on Availability)
- 11.2.10 B Braun SE
- 11.2.10.1. Overview
- 11.2.10.2. Products
- 11.2.10.3. SWOT Analysis
- 11.2.10.4. Recent Developments
- 11.2.10.5. Financials (Based on Availability)
- 11.2.11 Medline Industries Inc
- 11.2.11.1. Overview
- 11.2.11.2. Products
- 11.2.11.3. SWOT Analysis
- 11.2.11.4. Recent Developments
- 11.2.11.5. Financials (Based on Availability)
- 11.2.1 Med-italia Biomedica Srl
List of Figures
- Figure 1: Global Custom Procedure Packs Market Revenue Breakdown (billion, %) by Region 2025 & 2033
- Figure 2: Global Custom Procedure Packs Market Volume Breakdown (K Unit, %) by Region 2025 & 2033
- Figure 3: North America Custom Procedure Packs Market Revenue (billion), by Use 2025 & 2033
- Figure 4: North America Custom Procedure Packs Market Volume (K Unit), by Use 2025 & 2033
- Figure 5: North America Custom Procedure Packs Market Revenue Share (%), by Use 2025 & 2033
- Figure 6: North America Custom Procedure Packs Market Volume Share (%), by Use 2025 & 2033
- Figure 7: North America Custom Procedure Packs Market Revenue (billion), by Product 2025 & 2033
- Figure 8: North America Custom Procedure Packs Market Volume (K Unit), by Product 2025 & 2033
- Figure 9: North America Custom Procedure Packs Market Revenue Share (%), by Product 2025 & 2033
- Figure 10: North America Custom Procedure Packs Market Volume Share (%), by Product 2025 & 2033
- Figure 11: North America Custom Procedure Packs Market Revenue (billion), by End-User 2025 & 2033
- Figure 12: North America Custom Procedure Packs Market Volume (K Unit), by End-User 2025 & 2033
- Figure 13: North America Custom Procedure Packs Market Revenue Share (%), by End-User 2025 & 2033
- Figure 14: North America Custom Procedure Packs Market Volume Share (%), by End-User 2025 & 2033
- Figure 15: North America Custom Procedure Packs Market Revenue (billion), by Country 2025 & 2033
- Figure 16: North America Custom Procedure Packs Market Volume (K Unit), by Country 2025 & 2033
- Figure 17: North America Custom Procedure Packs Market Revenue Share (%), by Country 2025 & 2033
- Figure 18: North America Custom Procedure Packs Market Volume Share (%), by Country 2025 & 2033
- Figure 19: Europe Custom Procedure Packs Market Revenue (billion), by Use 2025 & 2033
- Figure 20: Europe Custom Procedure Packs Market Volume (K Unit), by Use 2025 & 2033
- Figure 21: Europe Custom Procedure Packs Market Revenue Share (%), by Use 2025 & 2033
- Figure 22: Europe Custom Procedure Packs Market Volume Share (%), by Use 2025 & 2033
- Figure 23: Europe Custom Procedure Packs Market Revenue (billion), by Product 2025 & 2033
- Figure 24: Europe Custom Procedure Packs Market Volume (K Unit), by Product 2025 & 2033
- Figure 25: Europe Custom Procedure Packs Market Revenue Share (%), by Product 2025 & 2033
- Figure 26: Europe Custom Procedure Packs Market Volume Share (%), by Product 2025 & 2033
- Figure 27: Europe Custom Procedure Packs Market Revenue (billion), by End-User 2025 & 2033
- Figure 28: Europe Custom Procedure Packs Market Volume (K Unit), by End-User 2025 & 2033
- Figure 29: Europe Custom Procedure Packs Market Revenue Share (%), by End-User 2025 & 2033
- Figure 30: Europe Custom Procedure Packs Market Volume Share (%), by End-User 2025 & 2033
- Figure 31: Europe Custom Procedure Packs Market Revenue (billion), by Country 2025 & 2033
- Figure 32: Europe Custom Procedure Packs Market Volume (K Unit), by Country 2025 & 2033
- Figure 33: Europe Custom Procedure Packs Market Revenue Share (%), by Country 2025 & 2033
- Figure 34: Europe Custom Procedure Packs Market Volume Share (%), by Country 2025 & 2033
- Figure 35: Asia Pacific Custom Procedure Packs Market Revenue (billion), by Use 2025 & 2033
- Figure 36: Asia Pacific Custom Procedure Packs Market Volume (K Unit), by Use 2025 & 2033
- Figure 37: Asia Pacific Custom Procedure Packs Market Revenue Share (%), by Use 2025 & 2033
- Figure 38: Asia Pacific Custom Procedure Packs Market Volume Share (%), by Use 2025 & 2033
- Figure 39: Asia Pacific Custom Procedure Packs Market Revenue (billion), by Product 2025 & 2033
- Figure 40: Asia Pacific Custom Procedure Packs Market Volume (K Unit), by Product 2025 & 2033
- Figure 41: Asia Pacific Custom Procedure Packs Market Revenue Share (%), by Product 2025 & 2033
- Figure 42: Asia Pacific Custom Procedure Packs Market Volume Share (%), by Product 2025 & 2033
- Figure 43: Asia Pacific Custom Procedure Packs Market Revenue (billion), by End-User 2025 & 2033
- Figure 44: Asia Pacific Custom Procedure Packs Market Volume (K Unit), by End-User 2025 & 2033
- Figure 45: Asia Pacific Custom Procedure Packs Market Revenue Share (%), by End-User 2025 & 2033
- Figure 46: Asia Pacific Custom Procedure Packs Market Volume Share (%), by End-User 2025 & 2033
- Figure 47: Asia Pacific Custom Procedure Packs Market Revenue (billion), by Country 2025 & 2033
- Figure 48: Asia Pacific Custom Procedure Packs Market Volume (K Unit), by Country 2025 & 2033
- Figure 49: Asia Pacific Custom Procedure Packs Market Revenue Share (%), by Country 2025 & 2033
- Figure 50: Asia Pacific Custom Procedure Packs Market Volume Share (%), by Country 2025 & 2033
- Figure 51: Middle East and Africa Custom Procedure Packs Market Revenue (billion), by Use 2025 & 2033
- Figure 52: Middle East and Africa Custom Procedure Packs Market Volume (K Unit), by Use 2025 & 2033
- Figure 53: Middle East and Africa Custom Procedure Packs Market Revenue Share (%), by Use 2025 & 2033
- Figure 54: Middle East and Africa Custom Procedure Packs Market Volume Share (%), by Use 2025 & 2033
- Figure 55: Middle East and Africa Custom Procedure Packs Market Revenue (billion), by Product 2025 & 2033
- Figure 56: Middle East and Africa Custom Procedure Packs Market Volume (K Unit), by Product 2025 & 2033
- Figure 57: Middle East and Africa Custom Procedure Packs Market Revenue Share (%), by Product 2025 & 2033
- Figure 58: Middle East and Africa Custom Procedure Packs Market Volume Share (%), by Product 2025 & 2033
- Figure 59: Middle East and Africa Custom Procedure Packs Market Revenue (billion), by End-User 2025 & 2033
- Figure 60: Middle East and Africa Custom Procedure Packs Market Volume (K Unit), by End-User 2025 & 2033
- Figure 61: Middle East and Africa Custom Procedure Packs Market Revenue Share (%), by End-User 2025 & 2033
- Figure 62: Middle East and Africa Custom Procedure Packs Market Volume Share (%), by End-User 2025 & 2033
- Figure 63: Middle East and Africa Custom Procedure Packs Market Revenue (billion), by Country 2025 & 2033
- Figure 64: Middle East and Africa Custom Procedure Packs Market Volume (K Unit), by Country 2025 & 2033
- Figure 65: Middle East and Africa Custom Procedure Packs Market Revenue Share (%), by Country 2025 & 2033
- Figure 66: Middle East and Africa Custom Procedure Packs Market Volume Share (%), by Country 2025 & 2033
- Figure 67: South America Custom Procedure Packs Market Revenue (billion), by Use 2025 & 2033
- Figure 68: South America Custom Procedure Packs Market Volume (K Unit), by Use 2025 & 2033
- Figure 69: South America Custom Procedure Packs Market Revenue Share (%), by Use 2025 & 2033
- Figure 70: South America Custom Procedure Packs Market Volume Share (%), by Use 2025 & 2033
- Figure 71: South America Custom Procedure Packs Market Revenue (billion), by Product 2025 & 2033
- Figure 72: South America Custom Procedure Packs Market Volume (K Unit), by Product 2025 & 2033
- Figure 73: South America Custom Procedure Packs Market Revenue Share (%), by Product 2025 & 2033
- Figure 74: South America Custom Procedure Packs Market Volume Share (%), by Product 2025 & 2033
- Figure 75: South America Custom Procedure Packs Market Revenue (billion), by End-User 2025 & 2033
- Figure 76: South America Custom Procedure Packs Market Volume (K Unit), by End-User 2025 & 2033
- Figure 77: South America Custom Procedure Packs Market Revenue Share (%), by End-User 2025 & 2033
- Figure 78: South America Custom Procedure Packs Market Volume Share (%), by End-User 2025 & 2033
- Figure 79: South America Custom Procedure Packs Market Revenue (billion), by Country 2025 & 2033
- Figure 80: South America Custom Procedure Packs Market Volume (K Unit), by Country 2025 & 2033
- Figure 81: South America Custom Procedure Packs Market Revenue Share (%), by Country 2025 & 2033
- Figure 82: South America Custom Procedure Packs Market Volume Share (%), by Country 2025 & 2033
List of Tables
- Table 1: Global Custom Procedure Packs Market Revenue billion Forecast, by Use 2020 & 2033
- Table 2: Global Custom Procedure Packs Market Volume K Unit Forecast, by Use 2020 & 2033
- Table 3: Global Custom Procedure Packs Market Revenue billion Forecast, by Product 2020 & 2033
- Table 4: Global Custom Procedure Packs Market Volume K Unit Forecast, by Product 2020 & 2033
- Table 5: Global Custom Procedure Packs Market Revenue billion Forecast, by End-User 2020 & 2033
- Table 6: Global Custom Procedure Packs Market Volume K Unit Forecast, by End-User 2020 & 2033
- Table 7: Global Custom Procedure Packs Market Revenue billion Forecast, by Region 2020 & 2033
- Table 8: Global Custom Procedure Packs Market Volume K Unit Forecast, by Region 2020 & 2033
- Table 9: Global Custom Procedure Packs Market Revenue billion Forecast, by Use 2020 & 2033
- Table 10: Global Custom Procedure Packs Market Volume K Unit Forecast, by Use 2020 & 2033
- Table 11: Global Custom Procedure Packs Market Revenue billion Forecast, by Product 2020 & 2033
- Table 12: Global Custom Procedure Packs Market Volume K Unit Forecast, by Product 2020 & 2033
- Table 13: Global Custom Procedure Packs Market Revenue billion Forecast, by End-User 2020 & 2033
- Table 14: Global Custom Procedure Packs Market Volume K Unit Forecast, by End-User 2020 & 2033
- Table 15: Global Custom Procedure Packs Market Revenue billion Forecast, by Country 2020 & 2033
- Table 16: Global Custom Procedure Packs Market Volume K Unit Forecast, by Country 2020 & 2033
- Table 17: United States Custom Procedure Packs Market Revenue (billion) Forecast, by Application 2020 & 2033
- Table 18: United States Custom Procedure Packs Market Volume (K Unit) Forecast, by Application 2020 & 2033
- Table 19: Canada Custom Procedure Packs Market Revenue (billion) Forecast, by Application 2020 & 2033
- Table 20: Canada Custom Procedure Packs Market Volume (K Unit) Forecast, by Application 2020 & 2033
- Table 21: Mexico Custom Procedure Packs Market Revenue (billion) Forecast, by Application 2020 & 2033
- Table 22: Mexico Custom Procedure Packs Market Volume (K Unit) Forecast, by Application 2020 & 2033
- Table 23: Global Custom Procedure Packs Market Revenue billion Forecast, by Use 2020 & 2033
- Table 24: Global Custom Procedure Packs Market Volume K Unit Forecast, by Use 2020 & 2033
- Table 25: Global Custom Procedure Packs Market Revenue billion Forecast, by Product 2020 & 2033
- Table 26: Global Custom Procedure Packs Market Volume K Unit Forecast, by Product 2020 & 2033
- Table 27: Global Custom Procedure Packs Market Revenue billion Forecast, by End-User 2020 & 2033
- Table 28: Global Custom Procedure Packs Market Volume K Unit Forecast, by End-User 2020 & 2033
- Table 29: Global Custom Procedure Packs Market Revenue billion Forecast, by Country 2020 & 2033
- Table 30: Global Custom Procedure Packs Market Volume K Unit Forecast, by Country 2020 & 2033
- Table 31: Germany Custom Procedure Packs Market Revenue (billion) Forecast, by Application 2020 & 2033
- Table 32: Germany Custom Procedure Packs Market Volume (K Unit) Forecast, by Application 2020 & 2033
- Table 33: United Kingdom Custom Procedure Packs Market Revenue (billion) Forecast, by Application 2020 & 2033
- Table 34: United Kingdom Custom Procedure Packs Market Volume (K Unit) Forecast, by Application 2020 & 2033
- Table 35: France Custom Procedure Packs Market Revenue (billion) Forecast, by Application 2020 & 2033
- Table 36: France Custom Procedure Packs Market Volume (K Unit) Forecast, by Application 2020 & 2033
- Table 37: Italy Custom Procedure Packs Market Revenue (billion) Forecast, by Application 2020 & 2033
- Table 38: Italy Custom Procedure Packs Market Volume (K Unit) Forecast, by Application 2020 & 2033
- Table 39: Spain Custom Procedure Packs Market Revenue (billion) Forecast, by Application 2020 & 2033
- Table 40: Spain Custom Procedure Packs Market Volume (K Unit) Forecast, by Application 2020 & 2033
- Table 41: Rest of Europe Custom Procedure Packs Market Revenue (billion) Forecast, by Application 2020 & 2033
- Table 42: Rest of Europe Custom Procedure Packs Market Volume (K Unit) Forecast, by Application 2020 & 2033
- Table 43: Global Custom Procedure Packs Market Revenue billion Forecast, by Use 2020 & 2033
- Table 44: Global Custom Procedure Packs Market Volume K Unit Forecast, by Use 2020 & 2033
- Table 45: Global Custom Procedure Packs Market Revenue billion Forecast, by Product 2020 & 2033
- Table 46: Global Custom Procedure Packs Market Volume K Unit Forecast, by Product 2020 & 2033
- Table 47: Global Custom Procedure Packs Market Revenue billion Forecast, by End-User 2020 & 2033
- Table 48: Global Custom Procedure Packs Market Volume K Unit Forecast, by End-User 2020 & 2033
- Table 49: Global Custom Procedure Packs Market Revenue billion Forecast, by Country 2020 & 2033
- Table 50: Global Custom Procedure Packs Market Volume K Unit Forecast, by Country 2020 & 2033
- Table 51: China Custom Procedure Packs Market Revenue (billion) Forecast, by Application 2020 & 2033
- Table 52: China Custom Procedure Packs Market Volume (K Unit) Forecast, by Application 2020 & 2033
- Table 53: Japan Custom Procedure Packs Market Revenue (billion) Forecast, by Application 2020 & 2033
- Table 54: Japan Custom Procedure Packs Market Volume (K Unit) Forecast, by Application 2020 & 2033
- Table 55: India Custom Procedure Packs Market Revenue (billion) Forecast, by Application 2020 & 2033
- Table 56: India Custom Procedure Packs Market Volume (K Unit) Forecast, by Application 2020 & 2033
- Table 57: Australia Custom Procedure Packs Market Revenue (billion) Forecast, by Application 2020 & 2033
- Table 58: Australia Custom Procedure Packs Market Volume (K Unit) Forecast, by Application 2020 & 2033
- Table 59: South Korea Custom Procedure Packs Market Revenue (billion) Forecast, by Application 2020 & 2033
- Table 60: South Korea Custom Procedure Packs Market Volume (K Unit) Forecast, by Application 2020 & 2033
- Table 61: Rest of Asia Pacific Custom Procedure Packs Market Revenue (billion) Forecast, by Application 2020 & 2033
- Table 62: Rest of Asia Pacific Custom Procedure Packs Market Volume (K Unit) Forecast, by Application 2020 & 2033
- Table 63: Global Custom Procedure Packs Market Revenue billion Forecast, by Use 2020 & 2033
- Table 64: Global Custom Procedure Packs Market Volume K Unit Forecast, by Use 2020 & 2033
- Table 65: Global Custom Procedure Packs Market Revenue billion Forecast, by Product 2020 & 2033
- Table 66: Global Custom Procedure Packs Market Volume K Unit Forecast, by Product 2020 & 2033
- Table 67: Global Custom Procedure Packs Market Revenue billion Forecast, by End-User 2020 & 2033
- Table 68: Global Custom Procedure Packs Market Volume K Unit Forecast, by End-User 2020 & 2033
- Table 69: Global Custom Procedure Packs Market Revenue billion Forecast, by Country 2020 & 2033
- Table 70: Global Custom Procedure Packs Market Volume K Unit Forecast, by Country 2020 & 2033
- Table 71: GCC Custom Procedure Packs Market Revenue (billion) Forecast, by Application 2020 & 2033
- Table 72: GCC Custom Procedure Packs Market Volume (K Unit) Forecast, by Application 2020 & 2033
- Table 73: South Africa Custom Procedure Packs Market Revenue (billion) Forecast, by Application 2020 & 2033
- Table 74: South Africa Custom Procedure Packs Market Volume (K Unit) Forecast, by Application 2020 & 2033
- Table 75: Rest of Middle East and Africa Custom Procedure Packs Market Revenue (billion) Forecast, by Application 2020 & 2033
- Table 76: Rest of Middle East and Africa Custom Procedure Packs Market Volume (K Unit) Forecast, by Application 2020 & 2033
- Table 77: Global Custom Procedure Packs Market Revenue billion Forecast, by Use 2020 & 2033
- Table 78: Global Custom Procedure Packs Market Volume K Unit Forecast, by Use 2020 & 2033
- Table 79: Global Custom Procedure Packs Market Revenue billion Forecast, by Product 2020 & 2033
- Table 80: Global Custom Procedure Packs Market Volume K Unit Forecast, by Product 2020 & 2033
- Table 81: Global Custom Procedure Packs Market Revenue billion Forecast, by End-User 2020 & 2033
- Table 82: Global Custom Procedure Packs Market Volume K Unit Forecast, by End-User 2020 & 2033
- Table 83: Global Custom Procedure Packs Market Revenue billion Forecast, by Country 2020 & 2033
- Table 84: Global Custom Procedure Packs Market Volume K Unit Forecast, by Country 2020 & 2033
- Table 85: Brazil Custom Procedure Packs Market Revenue (billion) Forecast, by Application 2020 & 2033
- Table 86: Brazil Custom Procedure Packs Market Volume (K Unit) Forecast, by Application 2020 & 2033
- Table 87: Argentina Custom Procedure Packs Market Revenue (billion) Forecast, by Application 2020 & 2033
- Table 88: Argentina Custom Procedure Packs Market Volume (K Unit) Forecast, by Application 2020 & 2033
- Table 89: Rest of South America Custom Procedure Packs Market Revenue (billion) Forecast, by Application 2020 & 2033
- Table 90: Rest of South America Custom Procedure Packs Market Volume (K Unit) Forecast, by Application 2020 & 2033
Frequently Asked Questions
1. What is the projected Compound Annual Growth Rate (CAGR) of the Custom Procedure Packs Market?
The projected CAGR is approximately 4.7%.
2. Which companies are prominent players in the Custom Procedure Packs Market?
Key companies in the market include Med-italia Biomedica Srl, 3M, PrionTex, Pennine Healthcare, Cardinal Health Inc, Molnlycke Health Care AB, Owens & Minor Inc, Unisurge International Ltd, Kimal Group, B Braun SE, Medline Industries Inc.
3. What are the main segments of the Custom Procedure Packs Market?
The market segments include Use, Product, End-User.
4. Can you provide details about the market size?
The market size is estimated to be USD 8.01 billion as of 2022.
5. What are some drivers contributing to market growth?
Increasing Volume of Surgical Procedures; Rising Development and Launches of Innovative Tools.
6. What are the notable trends driving market growth?
Cosmetic Surgery Packs Segment is Expected to Register a Significant Market Share Over the Forecast Period.
7. Are there any restraints impacting market growth?
Presence of Faulty and Unnecessary Devices along with the Procedure Packs.
8. Can you provide examples of recent developments in the market?
August 2022: Pennine Healthcare was awarded the Medical Devices Regulation (MDR) Certification for its Class I Sterile, Class IIa, and Procedure Packs.
9. What pricing options are available for accessing the report?
Pricing options include single-user, multi-user, and enterprise licenses priced at USD 4750, USD 5250, and USD 8750 respectively.
10. Is the market size provided in terms of value or volume?
The market size is provided in terms of value, measured in billion and volume, measured in K Unit.
11. Are there any specific market keywords associated with the report?
Yes, the market keyword associated with the report is "Custom Procedure Packs Market," which aids in identifying and referencing the specific market segment covered.
12. How do I determine which pricing option suits my needs best?
The pricing options vary based on user requirements and access needs. Individual users may opt for single-user licenses, while businesses requiring broader access may choose multi-user or enterprise licenses for cost-effective access to the report.
13. Are there any additional resources or data provided in the Custom Procedure Packs Market report?
While the report offers comprehensive insights, it's advisable to review the specific contents or supplementary materials provided to ascertain if additional resources or data are available.
14. How can I stay updated on further developments or reports in the Custom Procedure Packs Market?
To stay informed about further developments, trends, and reports in the Custom Procedure Packs Market, consider subscribing to industry newsletters, following relevant companies and organizations, or regularly checking reputable industry news sources and publications.
Methodology
Step 1 - Identification of Relevant Samples Size from Population Database


Step 2 - Approaches for Defining Global Market Size (Value, Volume* & Price*)

Note*: In applicable scenarios
Step 3 - Data Sources
Primary Research
- Web Analytics
- Survey Reports
- Research Institute
- Latest Research Reports
- Opinion Leaders
Secondary Research
- Annual Reports
- White Paper
- Latest Press Release
- Industry Association
- Paid Database
- Investor Presentations

Step 4 - Data Triangulation
Involves using different sources of information in order to increase the validity of a study
These sources are likely to be stakeholders in a program - participants, other researchers, program staff, other community members, and so on.
Then we put all data in single framework & apply various statistical tools to find out the dynamic on the market.
During the analysis stage, feedback from the stakeholder groups would be compared to determine areas of agreement as well as areas of divergence