

Key Insights
The cryogenic valves market is poised for significant expansion, fueled by escalating demand for liquefied natural gas (LNG), the robust growth of the petrochemical sector, and the increasing adoption of cryogenic technologies across healthcare and food processing. This dynamic market is projected to achieve a compound annual growth rate (CAGR) of 14.59%. The estimated market size for 2025 is valued at $8.02 billion. Key growth drivers include the imperative for secure and efficient cryogenic fluid management, stringent environmental regulations, and continuous innovation in valve design and performance. Leading industry contributors include Baker Hughes, Emerson Electric, and Flowserve, whose established expertise and product innovation significantly influence market dynamics. Nevertheless, substantial initial investment costs and the requirement for specialized operational and maintenance skills present ongoing market challenges.
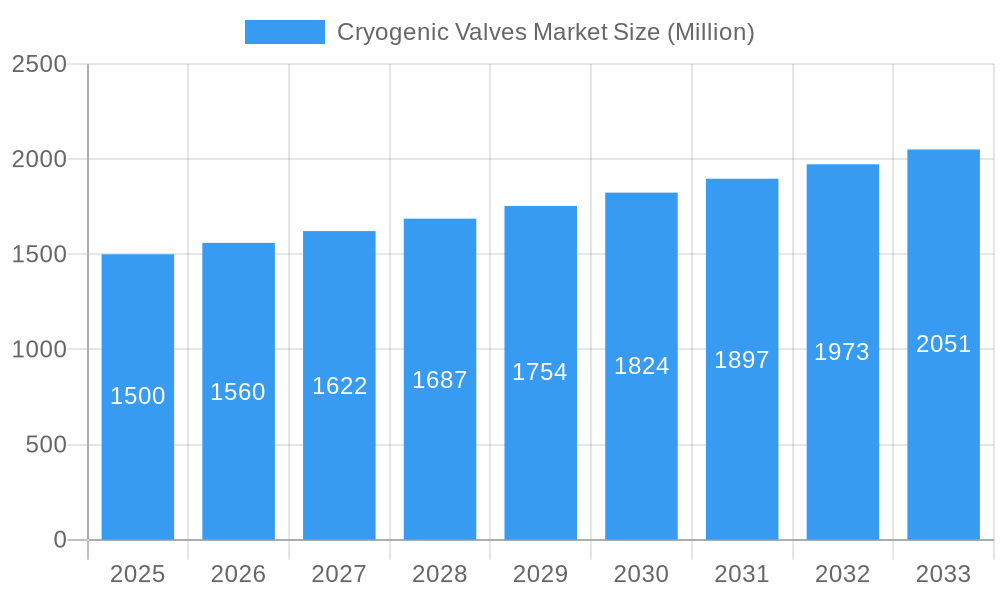
Cryogenic Valves Market Market Size (In Billion)
Market segmentation is vital for a comprehensive understanding of the cryogenic valves industry. The market is typically segmented by valve type (e.g., ball, gate, globe), material composition (e.g., stainless steel, nickel alloys), application (e.g., LNG, petrochemical, medical), and geographical region. The Asia-Pacific region is expected to exhibit exceptional growth, driven by extensive industrial development and infrastructure projects in China and India. North America and Europe are anticipated to retain significant market shares, underpinned by a mature cryogenic infrastructure and a strong presence of key manufacturers. The forecast period from 2025 to 2033 indicates sustained market growth, offering promising opportunities for forward-thinking companies to leverage emerging technologies and evolving market demands within this specialized sector.
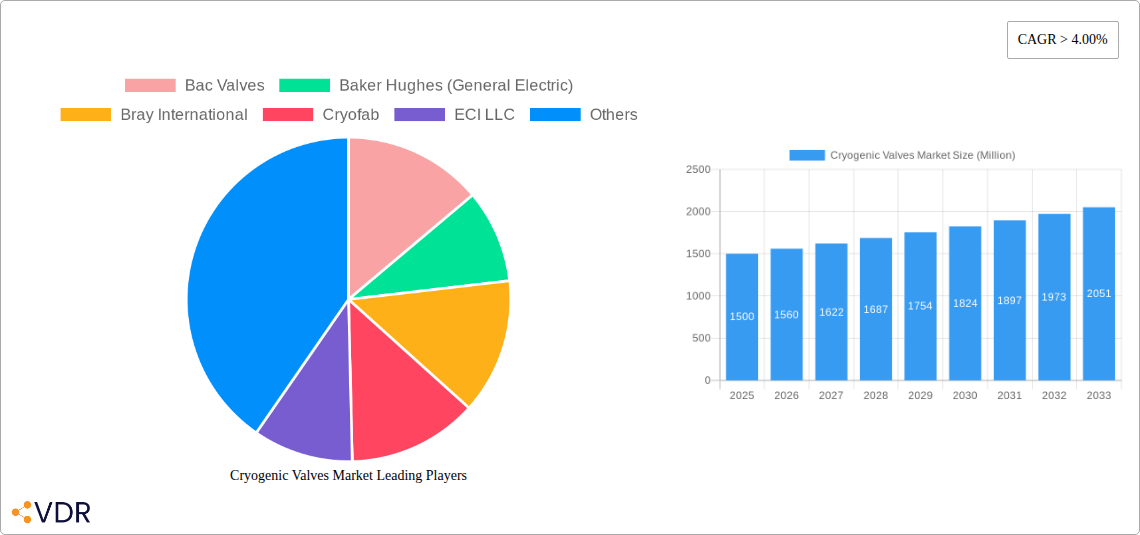
Cryogenic Valves Market Company Market Share
Cryogenic Valves Market: A Comprehensive Report (2019-2033)
This in-depth report provides a comprehensive analysis of the Cryogenic Valves Market, encompassing market dynamics, growth trends, regional performance, product landscape, key players, and future outlook. The study covers the period 2019-2033, with 2025 as the base year and estimated year. The parent market is the Industrial Valves Market, and the child market is specifically Cryogenic Valves, catering to various industries requiring extremely low-temperature fluid control. The market size is projected to reach xx Million units by 2033.
This report is designed for industry professionals, investors, and strategic decision-makers seeking actionable insights into this specialized market.
Cryogenic Valves Market Market Dynamics & Structure
The Cryogenic Valves Market is characterized by moderate concentration, with several key players holding significant market share. Technological innovation, primarily driven by the demand for enhanced efficiency, reliability, and safety in cryogenic applications, is a major growth driver. Stringent regulatory frameworks concerning safety and environmental impact influence market dynamics, while the emergence of substitute materials and technologies poses competitive pressure. The end-user demographics are diverse, encompassing energy, healthcare, and industrial gas sectors, shaping specific application demands. M&A activity has been moderate, with approximately xx deals recorded during the historical period, contributing to market consolidation and technological integration.
- Market Concentration: Moderately Concentrated, with top 5 players holding approximately xx% market share in 2024.
- Technological Innovation: Focus on material science (e.g., advanced alloys), improved sealing technologies, and automated control systems.
- Regulatory Landscape: Stringent safety and environmental regulations, particularly concerning leakage prevention and emissions.
- Competitive Substitutes: Emerging materials and designs challenge traditional valve technologies.
- End-User Demographics: Strong demand from LNG, industrial gas, and medical sectors.
- M&A Trends: xx M&A deals observed between 2019 and 2024, primarily focused on expanding product portfolios and geographical reach.
Cryogenic Valves Market Growth Trends & Insights
The Cryogenic Valves Market exhibits a steady growth trajectory, fueled by increasing demand from diverse industries. The market witnessed a CAGR of xx% during the historical period (2019-2024) and is projected to grow at a CAGR of xx% during the forecast period (2025-2033). This growth is driven by several factors, including increasing investments in LNG infrastructure, expansion of the industrial gas sector, and rising adoption of cryogenic technologies in healthcare. Technological disruptions, such as the development of advanced materials and smart valve technologies, are further accelerating market growth. Consumer behavior shifts towards eco-friendly and energy-efficient solutions are also playing a significant role. Market penetration of advanced cryogenic valves is expected to reach xx% by 2033.
Dominant Regions, Countries, or Segments in Cryogenic Valves Market
North America and Asia-Pacific are currently the dominant regions in the Cryogenic Valves Market. North America's dominance is attributed to strong LNG infrastructure development and the presence of major market players. Asia-Pacific's rapid growth is primarily driven by the expanding industrial gas sector and rising demand for energy-efficient technologies. Within these regions, specific countries like the USA, China, and Japan demonstrate strong growth potential.
- North America: Strong LNG infrastructure, established industrial base, and presence of major manufacturers drive market growth.
- Asia-Pacific: Rapid industrialization, burgeoning industrial gas sector, and increasing energy demand fuel market expansion.
- Europe: Moderate growth, influenced by energy transition policies and stringent environmental regulations.
- Key Growth Drivers: Government incentives for LNG infrastructure development, increasing investments in industrial gas facilities, and rising demand for cryogenic medical applications.
Cryogenic Valves Market Product Landscape
Cryogenic valves are characterized by their ability to operate reliably at extremely low temperatures, often below -150°C. Product innovations focus on improved sealing mechanisms, materials resistant to cryogenic embrittlement, and enhanced control systems to optimize performance and prevent leaks. Applications span across various sectors including LNG liquefaction and transportation, industrial gas processing, and cryogenic medical equipment. Unique selling propositions include enhanced durability, leak-proof operation, and precise control over cryogenic fluids. Technological advancements concentrate on smart valve technologies with remote monitoring capabilities, contributing to improved operational efficiency and reduced maintenance costs.
Key Drivers, Barriers & Challenges in Cryogenic Valves Market
Key Drivers:
- Rising demand for natural gas and LNG globally.
- Expansion of industrial gas production and distribution.
- Growing adoption of cryogenic technologies in healthcare and other industries.
- Technological advancements leading to improved valve performance and efficiency.
Key Challenges & Restraints:
- High initial investment costs for advanced cryogenic valve technologies.
- Stringent safety regulations and compliance requirements.
- Potential for supply chain disruptions due to material scarcity or geopolitical factors.
- Intense competition among established and emerging players.
Emerging Opportunities in Cryogenic Valves Market
Emerging opportunities include the development of smart cryogenic valves with advanced control and monitoring capabilities. Untapped markets in developing economies, coupled with the increasing adoption of cryogenic technologies in new sectors such as energy storage and quantum computing, present significant growth potential. Innovations focusing on enhanced material properties, reduced leakage rates, and improved sustainability offer new avenues for market expansion. Evolving consumer preferences towards environmentally friendly and energy-efficient solutions drive the demand for optimized cryogenic valve technologies.
Growth Accelerators in the Cryogenic Valves Market Industry
Technological breakthroughs in material science and automation are significant growth catalysts. Strategic partnerships between valve manufacturers and end-users enable the co-development of customized solutions. Market expansion strategies, such as entering new geographical regions and targeting underserved sectors, are crucial for long-term growth. Investments in research and development are crucial for staying ahead of the competition and meeting the evolving demands of the cryogenic industry.
Key Players Shaping the Cryogenic Valves Market Market
Notable Milestones in Cryogenic Valves Market Sector
- 2021: Emerson Electric Co. launched a new line of cryogenic valves featuring advanced sealing technology.
- 2022: Parker Hannifin Corp. acquired a smaller cryogenic valve manufacturer, expanding its product portfolio.
- 2023: Several key players announced investments in R&D focused on improving the efficiency and reliability of cryogenic valves. (Specific details are in the full report).
In-Depth Cryogenic Valves Market Market Outlook
The Cryogenic Valves Market is poised for continued growth, driven by long-term trends in energy consumption, industrial gas production, and advancements in cryogenic technologies. Strategic partnerships, technological innovations, and market expansion into new applications will be crucial in shaping the future of the market. Opportunities lie in developing sustainable and energy-efficient solutions, further solidifying the industry's position in a rapidly evolving global landscape. The market is projected to experience significant growth, presenting lucrative opportunities for established players and new entrants alike.
Cryogenic Valves Market Segmentation
-
1. Product Type
- 1.1. Ball Valve
- 1.2. Check Valve
- 1.3. Gate Valve
- 1.4. Globe Valve
- 1.5. Other Product Types
-
2. Gas
- 2.1. Liquid Nitrogen
- 2.2. Liquid Helium
- 2.3. Hydrogen
- 2.4. Oxygen
- 2.5. Other Gases
-
3. End-user Industry
- 3.1. Chemicals
- 3.2. Oil and Gas
- 3.3. Energy and Power
- 3.4. Food and Beverage
- 3.5. Medical
- 3.6. Other End-user Industries
Cryogenic Valves Market Segmentation By Geography
-
1. Asia Pacific
- 1.1. China
- 1.2. India
- 1.3. Japan
- 1.4. South Korea
- 1.5. Rest of Asia Pacific
-
2. North America
- 2.1. United States
- 2.2. Canada
- 2.3. Mexico
-
3. Europe
- 3.1. Germany
- 3.2. United Kingdom
- 3.3. Italy
- 3.4. France
- 3.5. Rest of Europe
-
4. South America
- 4.1. Brazil
- 4.2. Argentina
- 4.3. Rest of South America
-
5. Middle East and Africa
- 5.1. Saudi Arabia
- 5.2. South Africa
- 5.3. Rest of Middle East and Africa
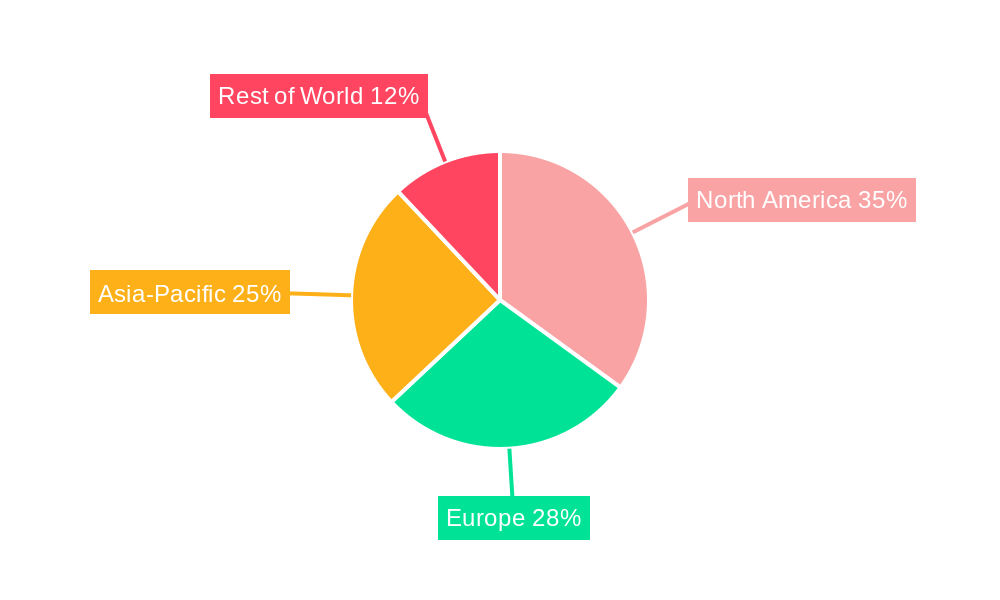
Cryogenic Valves Market Regional Market Share
Geographic Coverage of Cryogenic Valves Market
Cryogenic Valves Market REPORT HIGHLIGHTS
| Aspects | Details |
|---|---|
| Study Period | 2020-2034 |
| Base Year | 2025 |
| Estimated Year | 2026 |
| Forecast Period | 2026-2034 |
| Historical Period | 2020-2025 |
| Growth Rate | CAGR of 14.59% from 2020-2034 |
| Segmentation |
|
Table of Contents
- 1. Introduction
- 1.1. Research Scope
- 1.2. Market Segmentation
- 1.3. Research Objective
- 1.4. Definitions and Assumptions
- 2. Executive Summary
- 2.1. Market Snapshot
- 3. Market Dynamics
- 3.1. Market Drivers
- 3.2. Market Restrains
- 3.3. Market Trends
- 3.4. Market Opportunities
- 4. Market Factor Analysis
- 4.1. Porters Five Forces
- 4.1.1. Bargaining Power of Suppliers
- 4.1.2. Bargaining Power of Buyers
- 4.1.3. Threat of New Entrants
- 4.1.4. Threat of Substitutes
- 4.1.5. Competitive Rivalry
- 4.2. PESTEL analysis
- 4.3. BCG Analysis
- 4.3.1. Stars (High Growth, High Market Share)
- 4.3.2. Cash Cows (Low Growth, High Market Share)
- 4.3.3. Question Mark (High Growth, Low Market Share)
- 4.3.4. Dogs (Low Growth, Low Market Share)
- 4.4. Ansoff Matrix Analysis
- 4.5. Supply Chain Analysis
- 4.6. Regulatory Landscape
- 4.7. Current Market Potential and Opportunity Assessment (TAM–SAM–SOM Framework)
- 4.8. VDR Analyst Note
- 4.1. Porters Five Forces
- 5. Market Analysis, Insights and Forecast 2021-2033
- 5.1. Market Analysis, Insights and Forecast - by Product Type
- 5.1.1. Ball Valve
- 5.1.2. Check Valve
- 5.1.3. Gate Valve
- 5.1.4. Globe Valve
- 5.1.5. Other Product Types
- 5.2. Market Analysis, Insights and Forecast - by Gas
- 5.2.1. Liquid Nitrogen
- 5.2.2. Liquid Helium
- 5.2.3. Hydrogen
- 5.2.4. Oxygen
- 5.2.5. Other Gases
- 5.3. Market Analysis, Insights and Forecast - by End-user Industry
- 5.3.1. Chemicals
- 5.3.2. Oil and Gas
- 5.3.3. Energy and Power
- 5.3.4. Food and Beverage
- 5.3.5. Medical
- 5.3.6. Other End-user Industries
- 5.4. Market Analysis, Insights and Forecast - by Region
- 5.4.1. Asia Pacific
- 5.4.2. North America
- 5.4.3. Europe
- 5.4.4. South America
- 5.4.5. Middle East and Africa
- 5.1. Market Analysis, Insights and Forecast - by Product Type
- 6. Global Cryogenic Valves Market Analysis, Insights and Forecast, 2021-2033
- 6.1. Market Analysis, Insights and Forecast - by Product Type
- 6.1.1. Ball Valve
- 6.1.2. Check Valve
- 6.1.3. Gate Valve
- 6.1.4. Globe Valve
- 6.1.5. Other Product Types
- 6.2. Market Analysis, Insights and Forecast - by Gas
- 6.2.1. Liquid Nitrogen
- 6.2.2. Liquid Helium
- 6.2.3. Hydrogen
- 6.2.4. Oxygen
- 6.2.5. Other Gases
- 6.3. Market Analysis, Insights and Forecast - by End-user Industry
- 6.3.1. Chemicals
- 6.3.2. Oil and Gas
- 6.3.3. Energy and Power
- 6.3.4. Food and Beverage
- 6.3.5. Medical
- 6.3.6. Other End-user Industries
- 6.1. Market Analysis, Insights and Forecast - by Product Type
- 7. Asia Pacific Cryogenic Valves Market Analysis, Insights and Forecast, 2021-2033
- 7.1. Market Analysis, Insights and Forecast - by Product Type
- 7.1.1. Ball Valve
- 7.1.2. Check Valve
- 7.1.3. Gate Valve
- 7.1.4. Globe Valve
- 7.1.5. Other Product Types
- 7.2. Market Analysis, Insights and Forecast - by Gas
- 7.2.1. Liquid Nitrogen
- 7.2.2. Liquid Helium
- 7.2.3. Hydrogen
- 7.2.4. Oxygen
- 7.2.5. Other Gases
- 7.3. Market Analysis, Insights and Forecast - by End-user Industry
- 7.3.1. Chemicals
- 7.3.2. Oil and Gas
- 7.3.3. Energy and Power
- 7.3.4. Food and Beverage
- 7.3.5. Medical
- 7.3.6. Other End-user Industries
- 7.1. Market Analysis, Insights and Forecast - by Product Type
- 8. North America Cryogenic Valves Market Analysis, Insights and Forecast, 2021-2033
- 8.1. Market Analysis, Insights and Forecast - by Product Type
- 8.1.1. Ball Valve
- 8.1.2. Check Valve
- 8.1.3. Gate Valve
- 8.1.4. Globe Valve
- 8.1.5. Other Product Types
- 8.2. Market Analysis, Insights and Forecast - by Gas
- 8.2.1. Liquid Nitrogen
- 8.2.2. Liquid Helium
- 8.2.3. Hydrogen
- 8.2.4. Oxygen
- 8.2.5. Other Gases
- 8.3. Market Analysis, Insights and Forecast - by End-user Industry
- 8.3.1. Chemicals
- 8.3.2. Oil and Gas
- 8.3.3. Energy and Power
- 8.3.4. Food and Beverage
- 8.3.5. Medical
- 8.3.6. Other End-user Industries
- 8.1. Market Analysis, Insights and Forecast - by Product Type
- 9. Europe Cryogenic Valves Market Analysis, Insights and Forecast, 2021-2033
- 9.1. Market Analysis, Insights and Forecast - by Product Type
- 9.1.1. Ball Valve
- 9.1.2. Check Valve
- 9.1.3. Gate Valve
- 9.1.4. Globe Valve
- 9.1.5. Other Product Types
- 9.2. Market Analysis, Insights and Forecast - by Gas
- 9.2.1. Liquid Nitrogen
- 9.2.2. Liquid Helium
- 9.2.3. Hydrogen
- 9.2.4. Oxygen
- 9.2.5. Other Gases
- 9.3. Market Analysis, Insights and Forecast - by End-user Industry
- 9.3.1. Chemicals
- 9.3.2. Oil and Gas
- 9.3.3. Energy and Power
- 9.3.4. Food and Beverage
- 9.3.5. Medical
- 9.3.6. Other End-user Industries
- 9.1. Market Analysis, Insights and Forecast - by Product Type
- 10. South America Cryogenic Valves Market Analysis, Insights and Forecast, 2021-2033
- 10.1. Market Analysis, Insights and Forecast - by Product Type
- 10.1.1. Ball Valve
- 10.1.2. Check Valve
- 10.1.3. Gate Valve
- 10.1.4. Globe Valve
- 10.1.5. Other Product Types
- 10.2. Market Analysis, Insights and Forecast - by Gas
- 10.2.1. Liquid Nitrogen
- 10.2.2. Liquid Helium
- 10.2.3. Hydrogen
- 10.2.4. Oxygen
- 10.2.5. Other Gases
- 10.3. Market Analysis, Insights and Forecast - by End-user Industry
- 10.3.1. Chemicals
- 10.3.2. Oil and Gas
- 10.3.3. Energy and Power
- 10.3.4. Food and Beverage
- 10.3.5. Medical
- 10.3.6. Other End-user Industries
- 10.1. Market Analysis, Insights and Forecast - by Product Type
- 11. Middle East and Africa Cryogenic Valves Market Analysis, Insights and Forecast, 2021-2033
- 11.1. Market Analysis, Insights and Forecast - by Product Type
- 11.1.1. Ball Valve
- 11.1.2. Check Valve
- 11.1.3. Gate Valve
- 11.1.4. Globe Valve
- 11.1.5. Other Product Types
- 11.2. Market Analysis, Insights and Forecast - by Gas
- 11.2.1. Liquid Nitrogen
- 11.2.2. Liquid Helium
- 11.2.3. Hydrogen
- 11.2.4. Oxygen
- 11.2.5. Other Gases
- 11.3. Market Analysis, Insights and Forecast - by End-user Industry
- 11.3.1. Chemicals
- 11.3.2. Oil and Gas
- 11.3.3. Energy and Power
- 11.3.4. Food and Beverage
- 11.3.5. Medical
- 11.3.6. Other End-user Industries
- 11.1. Market Analysis, Insights and Forecast - by Product Type
- 12. Competitive Analysis
- 12.1. Company Profiles
- 12.1.1 Bac Valves
- 12.1.1.1. Company Overview
- 12.1.1.2. Products
- 12.1.1.3. Company Financials
- 12.1.1.4. SWOT Analysis
- 12.1.2 Baker Hughes (General Electric)
- 12.1.2.1. Company Overview
- 12.1.2.2. Products
- 12.1.2.3. Company Financials
- 12.1.2.4. SWOT Analysis
- 12.1.3 Bray International
- 12.1.3.1. Company Overview
- 12.1.3.2. Products
- 12.1.3.3. Company Financials
- 12.1.3.4. SWOT Analysis
- 12.1.4 Cryofab
- 12.1.4.1. Company Overview
- 12.1.4.2. Products
- 12.1.4.3. Company Financials
- 12.1.4.4. SWOT Analysis
- 12.1.5 ECI LLC
- 12.1.5.1. Company Overview
- 12.1.5.2. Products
- 12.1.5.3. Company Financials
- 12.1.5.4. SWOT Analysis
- 12.1.6 Emerson Electric Co
- 12.1.6.1. Company Overview
- 12.1.6.2. Products
- 12.1.6.3. Company Financials
- 12.1.6.4. SWOT Analysis
- 12.1.7 Flowserve Corporation
- 12.1.7.1. Company Overview
- 12.1.7.2. Products
- 12.1.7.3. Company Financials
- 12.1.7.4. SWOT Analysis
- 12.1.8 Habonim Industrial Valves & Actuators Ltd
- 12.1.8.1. Company Overview
- 12.1.8.2. Products
- 12.1.8.3. Company Financials
- 12.1.8.4. SWOT Analysis
- 12.1.9 Herose GmbH
- 12.1.9.1. Company Overview
- 12.1.9.2. Products
- 12.1.9.3. Company Financials
- 12.1.9.4. SWOT Analysis
- 12.1.10 L&T Valves Limited
- 12.1.10.1. Company Overview
- 12.1.10.2. Products
- 12.1.10.3. Company Financials
- 12.1.10.4. SWOT Analysis
- 12.1.11 Meca-Inox
- 12.1.11.1. Company Overview
- 12.1.11.2. Products
- 12.1.11.3. Company Financials
- 12.1.11.4. SWOT Analysis
- 12.1.12 Parker Hannifin Corp
- 12.1.12.1. Company Overview
- 12.1.12.2. Products
- 12.1.12.3. Company Financials
- 12.1.12.4. SWOT Analysis
- 12.1.13 Powell Valves
- 12.1.13.1. Company Overview
- 12.1.13.2. Products
- 12.1.13.3. Company Financials
- 12.1.13.4. SWOT Analysis
- 12.1.14 Samson AG
- 12.1.14.1. Company Overview
- 12.1.14.2. Products
- 12.1.14.3. Company Financials
- 12.1.14.4. SWOT Analysis
- 12.1.15 Velan Inc *List Not Exhaustive
- 12.1.15.1. Company Overview
- 12.1.15.2. Products
- 12.1.15.3. Company Financials
- 12.1.15.4. SWOT Analysis
- 12.1.1 Bac Valves
- 12.2. Market Entropy
- 12.2.1 Company's Key Areas Served
- 12.2.2 Recent Developments
- 12.3. Company Market Share Analysis 2025
- 12.3.1 Top 5 Companies Market Share Analysis
- 12.3.2 Top 3 Companies Market Share Analysis
- 12.4. List of Potential Customers
- 13. Research Methodology
List of Figures
- Figure 1: Global Cryogenic Valves Market Revenue Breakdown (billion, %) by Region 2025 & 2033
- Figure 2: Asia Pacific Cryogenic Valves Market Revenue (billion), by Product Type 2025 & 2033
- Figure 3: Asia Pacific Cryogenic Valves Market Revenue Share (%), by Product Type 2025 & 2033
- Figure 4: Asia Pacific Cryogenic Valves Market Revenue (billion), by Gas 2025 & 2033
- Figure 5: Asia Pacific Cryogenic Valves Market Revenue Share (%), by Gas 2025 & 2033
- Figure 6: Asia Pacific Cryogenic Valves Market Revenue (billion), by End-user Industry 2025 & 2033
- Figure 7: Asia Pacific Cryogenic Valves Market Revenue Share (%), by End-user Industry 2025 & 2033
- Figure 8: Asia Pacific Cryogenic Valves Market Revenue (billion), by Country 2025 & 2033
- Figure 9: Asia Pacific Cryogenic Valves Market Revenue Share (%), by Country 2025 & 2033
- Figure 10: North America Cryogenic Valves Market Revenue (billion), by Product Type 2025 & 2033
- Figure 11: North America Cryogenic Valves Market Revenue Share (%), by Product Type 2025 & 2033
- Figure 12: North America Cryogenic Valves Market Revenue (billion), by Gas 2025 & 2033
- Figure 13: North America Cryogenic Valves Market Revenue Share (%), by Gas 2025 & 2033
- Figure 14: North America Cryogenic Valves Market Revenue (billion), by End-user Industry 2025 & 2033
- Figure 15: North America Cryogenic Valves Market Revenue Share (%), by End-user Industry 2025 & 2033
- Figure 16: North America Cryogenic Valves Market Revenue (billion), by Country 2025 & 2033
- Figure 17: North America Cryogenic Valves Market Revenue Share (%), by Country 2025 & 2033
- Figure 18: Europe Cryogenic Valves Market Revenue (billion), by Product Type 2025 & 2033
- Figure 19: Europe Cryogenic Valves Market Revenue Share (%), by Product Type 2025 & 2033
- Figure 20: Europe Cryogenic Valves Market Revenue (billion), by Gas 2025 & 2033
- Figure 21: Europe Cryogenic Valves Market Revenue Share (%), by Gas 2025 & 2033
- Figure 22: Europe Cryogenic Valves Market Revenue (billion), by End-user Industry 2025 & 2033
- Figure 23: Europe Cryogenic Valves Market Revenue Share (%), by End-user Industry 2025 & 2033
- Figure 24: Europe Cryogenic Valves Market Revenue (billion), by Country 2025 & 2033
- Figure 25: Europe Cryogenic Valves Market Revenue Share (%), by Country 2025 & 2033
- Figure 26: South America Cryogenic Valves Market Revenue (billion), by Product Type 2025 & 2033
- Figure 27: South America Cryogenic Valves Market Revenue Share (%), by Product Type 2025 & 2033
- Figure 28: South America Cryogenic Valves Market Revenue (billion), by Gas 2025 & 2033
- Figure 29: South America Cryogenic Valves Market Revenue Share (%), by Gas 2025 & 2033
- Figure 30: South America Cryogenic Valves Market Revenue (billion), by End-user Industry 2025 & 2033
- Figure 31: South America Cryogenic Valves Market Revenue Share (%), by End-user Industry 2025 & 2033
- Figure 32: South America Cryogenic Valves Market Revenue (billion), by Country 2025 & 2033
- Figure 33: South America Cryogenic Valves Market Revenue Share (%), by Country 2025 & 2033
- Figure 34: Middle East and Africa Cryogenic Valves Market Revenue (billion), by Product Type 2025 & 2033
- Figure 35: Middle East and Africa Cryogenic Valves Market Revenue Share (%), by Product Type 2025 & 2033
- Figure 36: Middle East and Africa Cryogenic Valves Market Revenue (billion), by Gas 2025 & 2033
- Figure 37: Middle East and Africa Cryogenic Valves Market Revenue Share (%), by Gas 2025 & 2033
- Figure 38: Middle East and Africa Cryogenic Valves Market Revenue (billion), by End-user Industry 2025 & 2033
- Figure 39: Middle East and Africa Cryogenic Valves Market Revenue Share (%), by End-user Industry 2025 & 2033
- Figure 40: Middle East and Africa Cryogenic Valves Market Revenue (billion), by Country 2025 & 2033
- Figure 41: Middle East and Africa Cryogenic Valves Market Revenue Share (%), by Country 2025 & 2033
List of Tables
- Table 1: Global Cryogenic Valves Market Revenue billion Forecast, by Product Type 2020 & 2033
- Table 2: Global Cryogenic Valves Market Revenue billion Forecast, by Gas 2020 & 2033
- Table 3: Global Cryogenic Valves Market Revenue billion Forecast, by End-user Industry 2020 & 2033
- Table 4: Global Cryogenic Valves Market Revenue billion Forecast, by Region 2020 & 2033
- Table 5: Global Cryogenic Valves Market Revenue billion Forecast, by Product Type 2020 & 2033
- Table 6: Global Cryogenic Valves Market Revenue billion Forecast, by Gas 2020 & 2033
- Table 7: Global Cryogenic Valves Market Revenue billion Forecast, by End-user Industry 2020 & 2033
- Table 8: Global Cryogenic Valves Market Revenue billion Forecast, by Country 2020 & 2033
- Table 9: China Cryogenic Valves Market Revenue (billion) Forecast, by Application 2020 & 2033
- Table 10: India Cryogenic Valves Market Revenue (billion) Forecast, by Application 2020 & 2033
- Table 11: Japan Cryogenic Valves Market Revenue (billion) Forecast, by Application 2020 & 2033
- Table 12: South Korea Cryogenic Valves Market Revenue (billion) Forecast, by Application 2020 & 2033
- Table 13: Rest of Asia Pacific Cryogenic Valves Market Revenue (billion) Forecast, by Application 2020 & 2033
- Table 14: Global Cryogenic Valves Market Revenue billion Forecast, by Product Type 2020 & 2033
- Table 15: Global Cryogenic Valves Market Revenue billion Forecast, by Gas 2020 & 2033
- Table 16: Global Cryogenic Valves Market Revenue billion Forecast, by End-user Industry 2020 & 2033
- Table 17: Global Cryogenic Valves Market Revenue billion Forecast, by Country 2020 & 2033
- Table 18: United States Cryogenic Valves Market Revenue (billion) Forecast, by Application 2020 & 2033
- Table 19: Canada Cryogenic Valves Market Revenue (billion) Forecast, by Application 2020 & 2033
- Table 20: Mexico Cryogenic Valves Market Revenue (billion) Forecast, by Application 2020 & 2033
- Table 21: Global Cryogenic Valves Market Revenue billion Forecast, by Product Type 2020 & 2033
- Table 22: Global Cryogenic Valves Market Revenue billion Forecast, by Gas 2020 & 2033
- Table 23: Global Cryogenic Valves Market Revenue billion Forecast, by End-user Industry 2020 & 2033
- Table 24: Global Cryogenic Valves Market Revenue billion Forecast, by Country 2020 & 2033
- Table 25: Germany Cryogenic Valves Market Revenue (billion) Forecast, by Application 2020 & 2033
- Table 26: United Kingdom Cryogenic Valves Market Revenue (billion) Forecast, by Application 2020 & 2033
- Table 27: Italy Cryogenic Valves Market Revenue (billion) Forecast, by Application 2020 & 2033
- Table 28: France Cryogenic Valves Market Revenue (billion) Forecast, by Application 2020 & 2033
- Table 29: Rest of Europe Cryogenic Valves Market Revenue (billion) Forecast, by Application 2020 & 2033
- Table 30: Global Cryogenic Valves Market Revenue billion Forecast, by Product Type 2020 & 2033
- Table 31: Global Cryogenic Valves Market Revenue billion Forecast, by Gas 2020 & 2033
- Table 32: Global Cryogenic Valves Market Revenue billion Forecast, by End-user Industry 2020 & 2033
- Table 33: Global Cryogenic Valves Market Revenue billion Forecast, by Country 2020 & 2033
- Table 34: Brazil Cryogenic Valves Market Revenue (billion) Forecast, by Application 2020 & 2033
- Table 35: Argentina Cryogenic Valves Market Revenue (billion) Forecast, by Application 2020 & 2033
- Table 36: Rest of South America Cryogenic Valves Market Revenue (billion) Forecast, by Application 2020 & 2033
- Table 37: Global Cryogenic Valves Market Revenue billion Forecast, by Product Type 2020 & 2033
- Table 38: Global Cryogenic Valves Market Revenue billion Forecast, by Gas 2020 & 2033
- Table 39: Global Cryogenic Valves Market Revenue billion Forecast, by End-user Industry 2020 & 2033
- Table 40: Global Cryogenic Valves Market Revenue billion Forecast, by Country 2020 & 2033
- Table 41: Saudi Arabia Cryogenic Valves Market Revenue (billion) Forecast, by Application 2020 & 2033
- Table 42: South Africa Cryogenic Valves Market Revenue (billion) Forecast, by Application 2020 & 2033
- Table 43: Rest of Middle East and Africa Cryogenic Valves Market Revenue (billion) Forecast, by Application 2020 & 2033
Frequently Asked Questions
1. What is the projected Compound Annual Growth Rate (CAGR) of the Cryogenic Valves Market?
The projected CAGR is approximately 14.59%.
2. Which companies are prominent players in the Cryogenic Valves Market?
Key companies in the market include Bac Valves, Baker Hughes (General Electric), Bray International, Cryofab, ECI LLC, Emerson Electric Co, Flowserve Corporation, Habonim Industrial Valves & Actuators Ltd, Herose GmbH, L&T Valves Limited, Meca-Inox, Parker Hannifin Corp, Powell Valves, Samson AG, Velan Inc *List Not Exhaustive.
3. What are the main segments of the Cryogenic Valves Market?
The market segments include Product Type, Gas, End-user Industry.
4. Can you provide details about the market size?
The market size is estimated to be USD 8.02 billion as of 2022.
5. What are some drivers contributing to market growth?
Increasing Demand for Industrial Gases; Growing Demand from Chemicals Industry.
6. What are the notable trends driving market growth?
Increasing Usage in the Oil and Gas Industry.
7. Are there any restraints impacting market growth?
Increasing Demand for Industrial Gases; Growing Demand from Chemicals Industry.
8. Can you provide examples of recent developments in the market?
· The recent developments pertaining to the major players in the market are covered in the complete study.
9. What pricing options are available for accessing the report?
Pricing options include single-user, multi-user, and enterprise licenses priced at USD 4750, USD 5250, and USD 8750 respectively.
10. Is the market size provided in terms of value or volume?
The market size is provided in terms of value, measured in billion.
11. Are there any specific market keywords associated with the report?
Yes, the market keyword associated with the report is "Cryogenic Valves Market," which aids in identifying and referencing the specific market segment covered.
12. How do I determine which pricing option suits my needs best?
The pricing options vary based on user requirements and access needs. Individual users may opt for single-user licenses, while businesses requiring broader access may choose multi-user or enterprise licenses for cost-effective access to the report.
13. Are there any additional resources or data provided in the Cryogenic Valves Market report?
While the report offers comprehensive insights, it's advisable to review the specific contents or supplementary materials provided to ascertain if additional resources or data are available.
14. How can I stay updated on further developments or reports in the Cryogenic Valves Market?
To stay informed about further developments, trends, and reports in the Cryogenic Valves Market, consider subscribing to industry newsletters, following relevant companies and organizations, or regularly checking reputable industry news sources and publications.
Methodology
Step 1 - Identification of Relevant Samples Size from Population Database


Step 2 - Approaches for Defining Global Market Size (Value, Volume* & Price*)

Note*: In applicable scenarios
Step 3 - Data Sources
Primary Research
- Web Analytics
- Survey Reports
- Research Institute
- Latest Research Reports
- Opinion Leaders
Secondary Research
- Annual Reports
- White Paper
- Latest Press Release
- Industry Association
- Paid Database
- Investor Presentations

Step 4 - Data Triangulation
Involves using different sources of information in order to increase the validity of a study
These sources are likely to be stakeholders in a program - participants, other researchers, program staff, other community members, and so on.
Then we put all data in single framework & apply various statistical tools to find out the dynamic on the market.
During the analysis stage, feedback from the stakeholder groups would be compared to determine areas of agreement as well as areas of divergence