
Key Insights
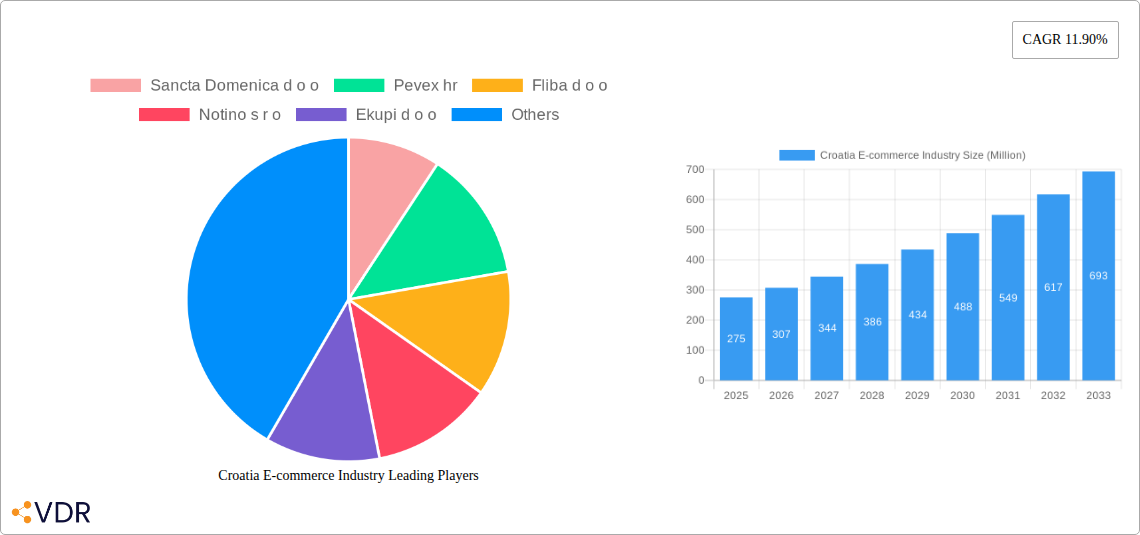
The Croatian e-commerce market, exhibiting a robust Compound Annual Growth Rate (CAGR) of 11.90% from 2019 to 2024, presents a compelling investment opportunity. While the exact market size for 2025 isn't provided, extrapolating from the historical growth and considering regional trends in Eastern Europe, a reasonable estimate for the 2025 market size would be in the range of €250-300 million. This growth is fueled by increasing internet and smartphone penetration, rising consumer confidence in online transactions, and a young, tech-savvy population. Key drivers include the expansion of logistics infrastructure improving delivery times and reliability, the proliferation of mobile commerce (m-commerce), and the growing adoption of online payment methods. Furthermore, the increasing popularity of social commerce and targeted online advertising are contributing to the market's expansion. However, challenges remain, such as the relatively smaller market size compared to Western European counterparts and potential hurdles related to regulatory frameworks. The segment analysis (based on application) is crucial for understanding specific growth areas, with applications like fashion, electronics, and groceries likely dominating the market. Competition is evident among players like Sancta Domenica, Pevex, Fliba, Notino, and Ekupi, indicating a mature but expanding market landscape demanding efficient strategies for capturing market share.
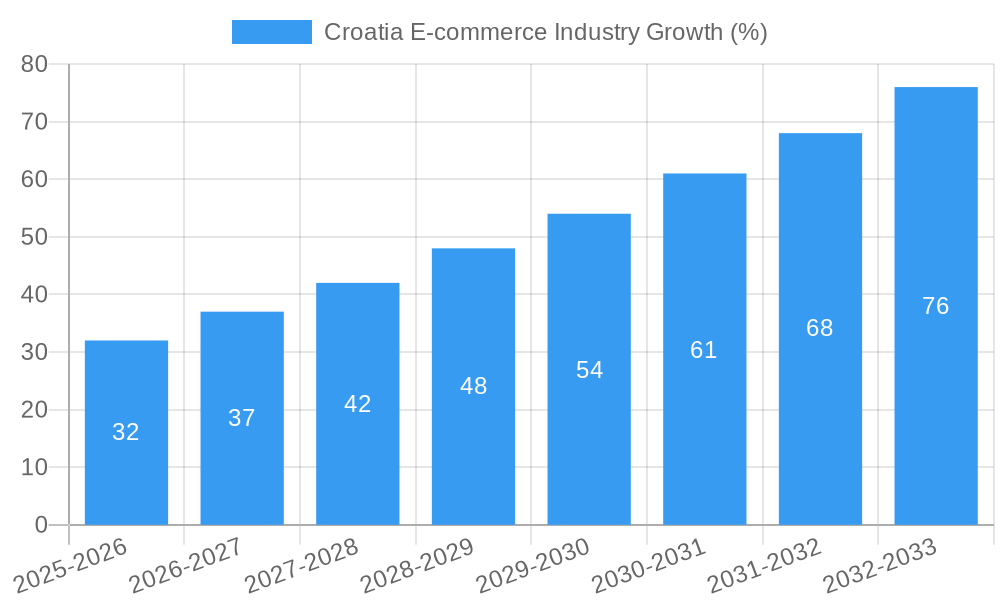
The forecast period (2025-2033) projects continued growth, albeit potentially at a slightly moderated CAGR, factoring in market saturation and economic fluctuations. This moderation should still result in substantial market expansion. Companies are expected to focus on improving customer experience through personalized recommendations, enhanced website design, and streamlined checkout processes. Additionally, investments in advanced technologies like artificial intelligence (AI) for personalized marketing and logistics optimization will likely play a significant role in shaping future competitiveness. The focus on improving logistics infrastructure, addressing potential regulatory challenges, and fostering a robust digital trust ecosystem among consumers will be essential for realizing the full potential of the Croatian e-commerce market.
Croatia E-commerce Industry Report: 2019-2033
This comprehensive report provides a detailed analysis of the Croatian e-commerce market, covering its dynamics, growth trends, key players, and future outlook. The study period spans from 2019 to 2033, with 2025 serving as both the base and estimated year. This report is essential for businesses, investors, and market analysts seeking a thorough understanding of this rapidly evolving sector.
Keywords: Croatia e-commerce, Croatian online retail, e-commerce market Croatia, Croatian e-commerce market size, e-commerce growth Croatia, e-commerce trends Croatia, Croatian e-commerce companies, online shopping Croatia, digital commerce Croatia, e-commerce industry analysis Croatia, Croatian e-commerce market share, market segmentation e-commerce Croatia, e-commerce investment Croatia
Croatia E-commerce Industry Market Dynamics & Structure
This section analyzes the Croatian e-commerce market's structure, highlighting market concentration, technological innovation, regulatory landscapes, competitive dynamics, and M&A activities. The analysis spans the period 2019-2024 and projects trends into 2033.
- Market Concentration: The Croatian e-commerce market exhibits a moderately concentrated structure, with a few dominant players accounting for xx% of the total market share in 2024. Smaller players focus on niche segments.
- Technological Innovation: The market is characterized by a gradual adoption of new technologies, including AI-powered personalization, mobile commerce optimization, and improved logistics solutions. Barriers include limited access to funding and a skilled workforce.
- Regulatory Framework: The regulatory landscape is relatively stable, though evolving regulations related to data privacy and consumer protection pose a constant challenge.
- Competitive Product Substitutes: Traditional brick-and-mortar retail remains a significant competitor, although e-commerce steadily gains market share.
- End-User Demographics: The growth of e-commerce is fueled by a young and increasingly tech-savvy population, with high internet penetration rates.
- M&A Trends: The number of M&A deals in the Croatian e-commerce market between 2019 and 2024 averaged xx per year, with the majority involving smaller players merging to enhance their market position.
Croatia E-commerce Industry Growth Trends & Insights
This section delves into the historical and projected growth of the Croatian e-commerce market, using data and analysis to showcase adoption rates, technological disruptions, and consumer behavior shifts.
The Croatian e-commerce market exhibited a CAGR of xx% during 2019-2024, reaching a market size of xx million in 2024. Market penetration increased from xx% in 2019 to xx% in 2024, driven by growing internet and smartphone adoption, and increased consumer trust in online transactions. Technological disruptions, such as the rise of mobile commerce and social commerce, significantly influenced consumer behavior, leading to a shift towards more convenient and personalized shopping experiences. Factors such as increased logistics efficiency and the expansion of payment options have further spurred growth. The forecast period (2025-2033) projects continued strong growth, with a projected CAGR of xx% and a market size exceeding xx million by 2033.
Dominant Regions, Countries, or Segments in Croatia E-commerce Industry
This section identifies the leading segments driving market growth within the Croatian e-commerce industry, focusing on Market Segmentation - By Application.
The dominant segment within the Croatian e-commerce market is xx (xx% market share in 2024), driven by factors such as:
- Strong Consumer Demand: High demand for xx products within the segment.
- Favourable Economic Policies: Government initiatives supporting the sector contributed to its growth.
- Well-Developed Infrastructure: Efficient logistics networks ensure timely deliveries.
Other segments show promising potential, including xx, and xx, but their smaller shares reflect less developed infrastructure or lower consumer demand in comparison to the dominant segment. The xx segment's growth trajectory indicates a projected xx% market share by 2033, highlighting its potential to become a major driving force in the future.
Croatia E-commerce Industry Product Landscape
The Croatian e-commerce market offers a diverse product landscape, with increasing emphasis on personalized shopping experiences facilitated by data analytics and AI. Innovations in logistics, such as same-day delivery and efficient returns management, are enhancing customer satisfaction. The focus on omnichannel strategies and the integration of social commerce platforms represent significant advancements, shaping the competitive landscape. Unique selling propositions increasingly revolve around customer experience personalization and seamless cross-platform integration.
Key Drivers, Barriers & Challenges in Croatia E-commerce Industry
Key Drivers:
The Croatian e-commerce market is propelled by increasing internet penetration, rising smartphone usage, growing consumer trust in online transactions, and government initiatives to promote digitalization. The expansion of logistics and payment options further fuels growth.
Key Challenges:
Challenges include limited digital literacy amongst older demographics, high logistics costs in less densely populated regions, the need for enhanced cyber security measures to address data breaches and fraud, and competition from established brick-and-mortar retailers. These challenges impact growth rates and overall market expansion.
Emerging Opportunities in Croatia E-commerce Industry
Emerging opportunities lie in expanding into untapped markets, including rural areas, by leveraging improved logistics and targeted marketing. The integration of augmented reality (AR) and virtual reality (VR) technologies offers new avenues for enhanced customer experiences. Furthermore, growing demand for sustainable and ethical products presents a significant opportunity for e-commerce businesses to cater to conscious consumer preferences.
Growth Accelerators in the Croatia E-commerce Industry Industry
Long-term growth will be accelerated by technological advancements, such as improved AI-powered personalization tools and the broader adoption of blockchain technology for secure transactions. Strategic partnerships between e-commerce platforms and logistics providers will enhance delivery efficiency. Market expansion into new demographic segments, such as older populations, through targeted digital literacy initiatives, will further boost growth.
Key Players Shaping the Croatia E-commerce Industry Market
- Sancta Domenica d o o
- Pevex hr
- Fliba d o o
- Notino s r o
- Ekupi d o o
- Sensus Grupa d o o
- Emmezeta
- Instar Informatika d o o
- Bauhaus hr
- Prati Me d o o
Notable Milestones in Croatia E-commerce Industry Sector
- May 2022: The Croatian KupiMe platform expands into e-commerce, leveraging its coupon sales expertise. This signals a shift in the market, with existing players diversifying their offerings.
In-Depth Croatia E-commerce Industry Market Outlook
The Croatian e-commerce market holds significant future potential, fueled by continued technological advancements, expanding digital literacy, and government support for digitalization. Strategic investments in logistics infrastructure, especially in rural areas, and the adoption of innovative payment and delivery solutions will unlock further growth. The market's robust expansion offers significant opportunities for both established and new players seeking a foothold in this dynamic sector.
Croatia E-commerce Industry Segmentation
-
1. B2C E-Commerce
- 1.1. Market size (GMV) for the period of 2017-2027
-
1.2. Market Segmentation - By Application
- 1.2.1. Beauty & Personal Care
- 1.2.2. Consumer Electronics
- 1.2.3. Fashion & Apparel
- 1.2.4. Food & Beverage
- 1.2.5. Furniture & Home
- 1.2.6. Others (Toys, DIY, Media, etc.)
- 2. Market size (GMV) for the period of 2017-2027
-
3. Application
- 3.1. Beauty & Personal Care
- 3.2. Consumer Electronics
- 3.3. Fashion & Apparel
- 3.4. Food & Beverage
- 3.5. Furniture & Home
- 3.6. Others (Toys, DIY, Media, etc.)
- 4. Beauty & Personal Care
- 5. Consumer Electronics
- 6. Fashion & Apparel
- 7. Food & Beverage
- 8. Furniture & Home
- 9. Others (Toys, DIY, Media, etc.)
-
10. B2B E-Commerce
- 10.1. Market size for the period of 2017-2027
Croatia E-commerce Industry Segmentation By Geography
- 1. Croatia
Croatia E-commerce Industry REPORT HIGHLIGHTS
| Aspects | Details |
|---|---|
| Study Period | 2019-2033 |
| Base Year | 2024 |
| Estimated Year | 2025 |
| Forecast Period | 2025-2033 |
| Historical Period | 2019-2024 |
| Growth Rate | CAGR of 11.90% from 2019-2033 |
| Segmentation |
|
Table of Contents
- 1. Introduction
- 1.1. Research Scope
- 1.2. Market Segmentation
- 1.3. Research Methodology
- 1.4. Definitions and Assumptions
- 2. Executive Summary
- 2.1. Introduction
- 3. Market Dynamics
- 3.1. Introduction
- 3.2. Market Drivers
- 3.2.1. Rise in trustworthiness of online stores; Croatia people appreciate local brands and support local entrepreneurs
- 3.3. Market Restrains
- 3.3.1. Low Light Sensing Capabilities Act as a Restraining Factor; Low-cost Sensors are Increasing the Threat to Scale Down the Quality
- 3.4. Market Trends
- 3.4.1. Smart Phones and Social Media users holds the highest share in Online Shopping
- 4. Market Factor Analysis
- 4.1. Porters Five Forces
- 4.2. Supply/Value Chain
- 4.3. PESTEL analysis
- 4.4. Market Entropy
- 4.5. Patent/Trademark Analysis
- 5. Croatia E-commerce Industry Analysis, Insights and Forecast, 2019-2031
- 5.1. Market Analysis, Insights and Forecast - by B2C E-Commerce
- 5.1.1. Market size (GMV) for the period of 2017-2027
- 5.1.2. Market Segmentation - By Application
- 5.1.2.1. Beauty & Personal Care
- 5.1.2.2. Consumer Electronics
- 5.1.2.3. Fashion & Apparel
- 5.1.2.4. Food & Beverage
- 5.1.2.5. Furniture & Home
- 5.1.2.6. Others (Toys, DIY, Media, etc.)
- 5.2. Market Analysis, Insights and Forecast - by Market size (GMV) for the period of 2017-2027
- 5.3. Market Analysis, Insights and Forecast - by Application
- 5.3.1. Beauty & Personal Care
- 5.3.2. Consumer Electronics
- 5.3.3. Fashion & Apparel
- 5.3.4. Food & Beverage
- 5.3.5. Furniture & Home
- 5.3.6. Others (Toys, DIY, Media, etc.)
- 5.4. Market Analysis, Insights and Forecast - by Beauty & Personal Care
- 5.5. Market Analysis, Insights and Forecast - by Consumer Electronics
- 5.6. Market Analysis, Insights and Forecast - by Fashion & Apparel
- 5.7. Market Analysis, Insights and Forecast - by Food & Beverage
- 5.8. Market Analysis, Insights and Forecast - by Furniture & Home
- 5.9. Market Analysis, Insights and Forecast - by Others (Toys, DIY, Media, etc.)
- 5.10. Market Analysis, Insights and Forecast - by B2B E-Commerce
- 5.10.1. Market size for the period of 2017-2027
- 5.11. Market Analysis, Insights and Forecast - by Region
- 5.11.1. Croatia
- 5.1. Market Analysis, Insights and Forecast - by B2C E-Commerce
- 6. Competitive Analysis
- 6.1. Market Share Analysis 2024
- 6.2. Company Profiles
- 6.2.1 Sancta Domenica d o o
- 6.2.1.1. Overview
- 6.2.1.2. Products
- 6.2.1.3. SWOT Analysis
- 6.2.1.4. Recent Developments
- 6.2.1.5. Financials (Based on Availability)
- 6.2.2 Pevex hr
- 6.2.2.1. Overview
- 6.2.2.2. Products
- 6.2.2.3. SWOT Analysis
- 6.2.2.4. Recent Developments
- 6.2.2.5. Financials (Based on Availability)
- 6.2.3 Fliba d o o
- 6.2.3.1. Overview
- 6.2.3.2. Products
- 6.2.3.3. SWOT Analysis
- 6.2.3.4. Recent Developments
- 6.2.3.5. Financials (Based on Availability)
- 6.2.4 Notino s r o
- 6.2.4.1. Overview
- 6.2.4.2. Products
- 6.2.4.3. SWOT Analysis
- 6.2.4.4. Recent Developments
- 6.2.4.5. Financials (Based on Availability)
- 6.2.5 Ekupi d o o
- 6.2.5.1. Overview
- 6.2.5.2. Products
- 6.2.5.3. SWOT Analysis
- 6.2.5.4. Recent Developments
- 6.2.5.5. Financials (Based on Availability)
- 6.2.6 Sensus Grupa d o o
- 6.2.6.1. Overview
- 6.2.6.2. Products
- 6.2.6.3. SWOT Analysis
- 6.2.6.4. Recent Developments
- 6.2.6.5. Financials (Based on Availability)
- 6.2.7 Emmezeta*List Not Exhaustive
- 6.2.7.1. Overview
- 6.2.7.2. Products
- 6.2.7.3. SWOT Analysis
- 6.2.7.4. Recent Developments
- 6.2.7.5. Financials (Based on Availability)
- 6.2.8 Instar Informatika d o o
- 6.2.8.1. Overview
- 6.2.8.2. Products
- 6.2.8.3. SWOT Analysis
- 6.2.8.4. Recent Developments
- 6.2.8.5. Financials (Based on Availability)
- 6.2.9 Bauhaus hr
- 6.2.9.1. Overview
- 6.2.9.2. Products
- 6.2.9.3. SWOT Analysis
- 6.2.9.4. Recent Developments
- 6.2.9.5. Financials (Based on Availability)
- 6.2.10 Prati Me d o o
- 6.2.10.1. Overview
- 6.2.10.2. Products
- 6.2.10.3. SWOT Analysis
- 6.2.10.4. Recent Developments
- 6.2.10.5. Financials (Based on Availability)
- 6.2.1 Sancta Domenica d o o
List of Figures
- Figure 1: Croatia E-commerce Industry Revenue Breakdown (Million, %) by Product 2024 & 2032
- Figure 2: Croatia E-commerce Industry Share (%) by Company 2024
List of Tables
- Table 1: Croatia E-commerce Industry Revenue Million Forecast, by Region 2019 & 2032
- Table 2: Croatia E-commerce Industry Revenue Million Forecast, by B2C E-Commerce 2019 & 2032
- Table 3: Croatia E-commerce Industry Revenue Million Forecast, by Market size (GMV) for the period of 2017-2027 2019 & 2032
- Table 4: Croatia E-commerce Industry Revenue Million Forecast, by Application 2019 & 2032
- Table 5: Croatia E-commerce Industry Revenue Million Forecast, by Beauty & Personal Care 2019 & 2032
- Table 6: Croatia E-commerce Industry Revenue Million Forecast, by Consumer Electronics 2019 & 2032
- Table 7: Croatia E-commerce Industry Revenue Million Forecast, by Fashion & Apparel 2019 & 2032
- Table 8: Croatia E-commerce Industry Revenue Million Forecast, by Food & Beverage 2019 & 2032
- Table 9: Croatia E-commerce Industry Revenue Million Forecast, by Furniture & Home 2019 & 2032
- Table 10: Croatia E-commerce Industry Revenue Million Forecast, by Others (Toys, DIY, Media, etc.) 2019 & 2032
- Table 11: Croatia E-commerce Industry Revenue Million Forecast, by B2B E-Commerce 2019 & 2032
- Table 12: Croatia E-commerce Industry Revenue Million Forecast, by Region 2019 & 2032
- Table 13: Croatia E-commerce Industry Revenue Million Forecast, by Country 2019 & 2032
- Table 14: Croatia E-commerce Industry Revenue Million Forecast, by B2C E-Commerce 2019 & 2032
- Table 15: Croatia E-commerce Industry Revenue Million Forecast, by Market size (GMV) for the period of 2017-2027 2019 & 2032
- Table 16: Croatia E-commerce Industry Revenue Million Forecast, by Application 2019 & 2032
- Table 17: Croatia E-commerce Industry Revenue Million Forecast, by Beauty & Personal Care 2019 & 2032
- Table 18: Croatia E-commerce Industry Revenue Million Forecast, by Consumer Electronics 2019 & 2032
- Table 19: Croatia E-commerce Industry Revenue Million Forecast, by Fashion & Apparel 2019 & 2032
- Table 20: Croatia E-commerce Industry Revenue Million Forecast, by Food & Beverage 2019 & 2032
- Table 21: Croatia E-commerce Industry Revenue Million Forecast, by Furniture & Home 2019 & 2032
- Table 22: Croatia E-commerce Industry Revenue Million Forecast, by Others (Toys, DIY, Media, etc.) 2019 & 2032
- Table 23: Croatia E-commerce Industry Revenue Million Forecast, by B2B E-Commerce 2019 & 2032
- Table 24: Croatia E-commerce Industry Revenue Million Forecast, by Country 2019 & 2032
Frequently Asked Questions
1. What is the projected Compound Annual Growth Rate (CAGR) of the Croatia E-commerce Industry?
The projected CAGR is approximately 11.90%.
2. Which companies are prominent players in the Croatia E-commerce Industry?
Key companies in the market include Sancta Domenica d o o, Pevex hr, Fliba d o o, Notino s r o, Ekupi d o o, Sensus Grupa d o o, Emmezeta*List Not Exhaustive, Instar Informatika d o o, Bauhaus hr, Prati Me d o o.
3. What are the main segments of the Croatia E-commerce Industry?
The market segments include B2C E-Commerce, Market size (GMV) for the period of 2017-2027, Application, Beauty & Personal Care, Consumer Electronics, Fashion & Apparel, Food & Beverage, Furniture & Home, Others (Toys, DIY, Media, etc.), B2B E-Commerce.
4. Can you provide details about the market size?
The market size is estimated to be USD XX Million as of 2022.
5. What are some drivers contributing to market growth?
Rise in trustworthiness of online stores; Croatia people appreciate local brands and support local entrepreneurs.
6. What are the notable trends driving market growth?
Smart Phones and Social Media users holds the highest share in Online Shopping.
7. Are there any restraints impacting market growth?
Low Light Sensing Capabilities Act as a Restraining Factor; Low-cost Sensors are Increasing the Threat to Scale Down the Quality.
8. Can you provide examples of recent developments in the market?
May 2022 - The Croatian KupiMe platform, which is known for being the country's first of its kind and is primarily focused on group shopping and coupon sales, has recently invested significant funds in business expansion and the development of specialised software for online shopping (e-commerce). The Croatian KupiMe platform opted to expand its business into the fast-growing e-commerce sector, leveraging its many years of experience in the coupon sales market.
9. What pricing options are available for accessing the report?
Pricing options include single-user, multi-user, and enterprise licenses priced at USD 3800, USD 4500, and USD 5800 respectively.
10. Is the market size provided in terms of value or volume?
The market size is provided in terms of value, measured in Million.
11. Are there any specific market keywords associated with the report?
Yes, the market keyword associated with the report is "Croatia E-commerce Industry," which aids in identifying and referencing the specific market segment covered.
12. How do I determine which pricing option suits my needs best?
The pricing options vary based on user requirements and access needs. Individual users may opt for single-user licenses, while businesses requiring broader access may choose multi-user or enterprise licenses for cost-effective access to the report.
13. Are there any additional resources or data provided in the Croatia E-commerce Industry report?
While the report offers comprehensive insights, it's advisable to review the specific contents or supplementary materials provided to ascertain if additional resources or data are available.
14. How can I stay updated on further developments or reports in the Croatia E-commerce Industry?
To stay informed about further developments, trends, and reports in the Croatia E-commerce Industry, consider subscribing to industry newsletters, following relevant companies and organizations, or regularly checking reputable industry news sources and publications.
Methodology
Step 1 - Identification of Relevant Samples Size from Population Database


Step 2 - Approaches for Defining Global Market Size (Value, Volume* & Price*)

Note*: In applicable scenarios
Step 3 - Data Sources
Primary Research
- Web Analytics
- Survey Reports
- Research Institute
- Latest Research Reports
- Opinion Leaders
Secondary Research
- Annual Reports
- White Paper
- Latest Press Release
- Industry Association
- Paid Database
- Investor Presentations

Step 4 - Data Triangulation
Involves using different sources of information in order to increase the validity of a study
These sources are likely to be stakeholders in a program - participants, other researchers, program staff, other community members, and so on.
Then we put all data in single framework & apply various statistical tools to find out the dynamic on the market.
During the analysis stage, feedback from the stakeholder groups would be compared to determine areas of agreement as well as areas of divergence


