
Key Insights
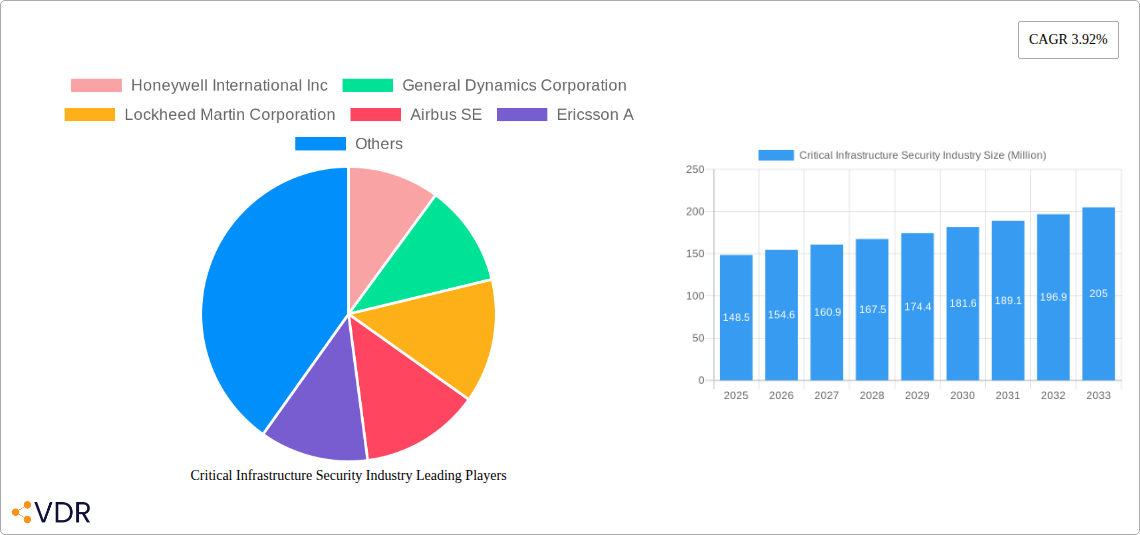
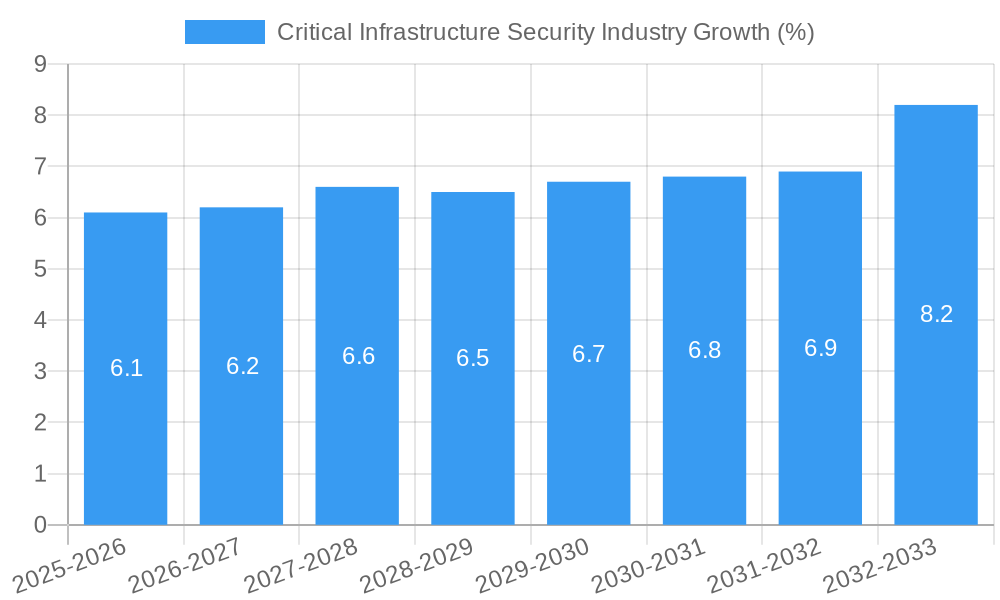
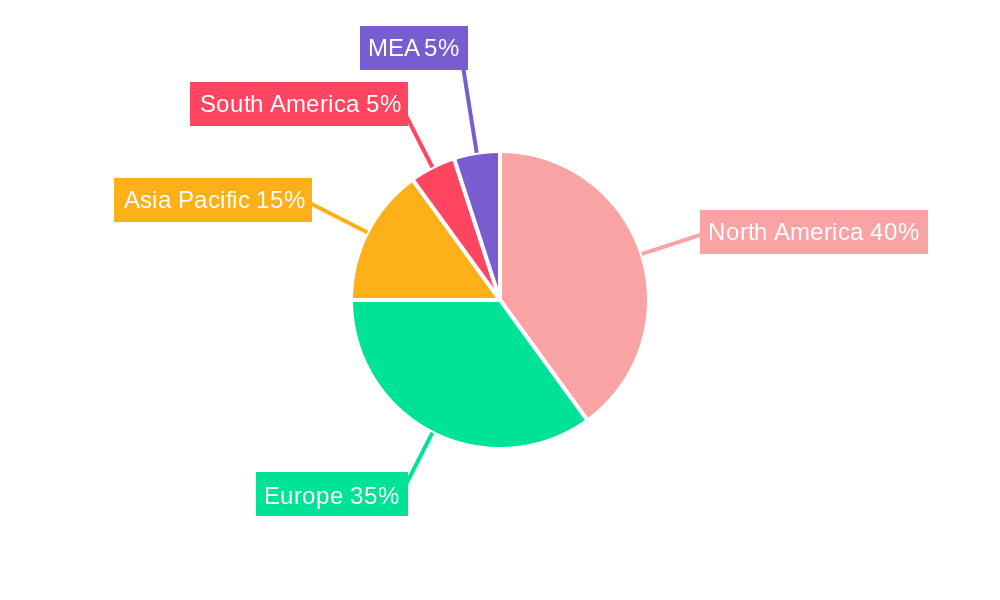
The critical infrastructure security market, valued at $148.5 million in 2025, is projected to experience robust growth, driven by increasing cyber threats, stringent government regulations, and the rising adoption of advanced technologies across various sectors. The market's Compound Annual Growth Rate (CAGR) of 3.92% from 2025 to 2033 indicates a steady expansion, with significant opportunities across different segments. The increasing interconnectedness of critical infrastructure systems makes them vulnerable to sophisticated cyberattacks, necessitating robust security measures. This vulnerability is further exacerbated by the increasing reliance on digital technologies and the Internet of Things (IoT) within these sectors. Consequently, the demand for comprehensive security solutions, encompassing physical and cybersecurity technologies, is surging. This includes advanced technologies like AI-powered threat detection, predictive analytics, and blockchain for enhanced data security and improved response times. The market is segmented by offering (security technology, physical security, etc.), services (risk management, integration, etc.), and vertical (energy, transportation, etc.), allowing for specialized solutions tailored to specific infrastructure needs. North America and Europe currently hold significant market share due to early adoption of advanced security technologies and stringent regulatory frameworks. However, the Asia-Pacific region is expected to witness substantial growth owing to its expanding critical infrastructure and increasing investment in security upgrades.
The competitive landscape is characterized by a mix of established players like Honeywell, Lockheed Martin, and BAE Systems, and specialized cybersecurity firms. These companies are strategically investing in research and development, partnerships, and acquisitions to expand their market presence and offer comprehensive solutions. The market's future growth hinges on several factors, including the effectiveness of cybersecurity strategies, government investments in infrastructure protection, and the successful integration of innovative technologies. Challenges include the high cost of implementation, the shortage of skilled cybersecurity professionals, and the complexity of integrating diverse security systems across different infrastructure components. Addressing these challenges through strategic collaborations and skill development initiatives will be crucial for realizing the full potential of this burgeoning market.
Critical Infrastructure Security Industry Market Report: 2019-2033
This comprehensive report provides an in-depth analysis of the Critical Infrastructure Security market, encompassing its dynamics, growth trends, dominant segments, and key players. With a study period spanning 2019-2033, a base year of 2025, and a forecast period of 2025-2033, this report is an essential resource for industry professionals, investors, and strategists seeking to understand and capitalize on the opportunities within this rapidly evolving sector. The market is segmented by offering (Security Technology, Physical Security, etc.), services (Risk Management, Integration, etc.), and vertical (Energy, Transportation, etc.). The total market size is projected to reach xx Million by 2033.
Critical Infrastructure Security Industry Market Dynamics & Structure
The Critical Infrastructure Security market is characterized by a moderately concentrated landscape with key players holding significant market share. Technological innovation, particularly in AI-driven threat detection and predictive analytics, is a primary growth driver. Stringent regulatory frameworks, such as those mandated by governments worldwide to protect critical national infrastructure, significantly impact market growth. Competitive product substitutes, including open-source security solutions, pose challenges to established vendors. The end-user demographic is diverse, encompassing energy providers, transportation authorities, and various government agencies. The market witnesses consistent M&A activity, with larger companies strategically acquiring smaller, specialized firms to expand their product portfolios and service offerings.
- Market Concentration: Moderately concentrated, with top 10 players holding approximately 60% market share in 2025.
- Technological Innovation: AI, machine learning, and IoT integration are driving innovation.
- Regulatory Landscape: Stringent government regulations in various countries drive demand.
- M&A Activity: Average of 25 M&A deals per year over the historical period (2019-2024), with deal value averaging xx Million.
- Innovation Barriers: High initial investment costs and cybersecurity skills shortage.
Critical Infrastructure Security Industry Growth Trends & Insights
The Critical Infrastructure Security market experienced substantial growth during the historical period (2019-2024), driven by increasing cyber threats, aging infrastructure, and heightened regulatory scrutiny. The market is expected to maintain a healthy CAGR of xx% during the forecast period (2025-2033), reaching xx Million by 2033. Adoption rates of advanced security technologies, such as cloud-based security solutions and AI-powered threat intelligence platforms, are steadily increasing. Technological disruptions, such as the rise of quantum computing, present both challenges and opportunities for the industry. Consumer behavior shifts towards greater awareness of cybersecurity risks contribute to market expansion. Market penetration is currently estimated at xx% in developed economies and is projected to reach xx% by 2033.
Dominant Regions, Countries, or Segments in Critical Infrastructure Security Industry
North America currently holds the largest market share in the Critical Infrastructure Security industry, driven by robust government spending on cybersecurity and a high concentration of critical infrastructure assets. Europe follows closely, with significant growth expected in Asia-Pacific due to rapid infrastructure development and increasing digitalization. Within segments, the Physical Security segment (particularly screening and scanning) commands a significant share, followed by Risk Management Services and Security Technology.
- Key Drivers:
- North America: High government spending on cybersecurity, robust critical infrastructure.
- Europe: Stringent data privacy regulations, growing adoption of advanced security solutions.
- Asia-Pacific: Rapid infrastructure development, increasing digitalization.
- Dominant Segments:
- By Offering: Physical Security (Screening and Scanning) holds the largest share, followed by Security Technology.
- By Service: Risk Management Services and Designing, Integration, and Consultation show robust growth.
- By Vertical: The Energy and Power sector is a key driver, followed by Transportation.
Critical Infrastructure Security Industry Product Landscape
The Critical Infrastructure Security market offers a diverse range of products, from traditional physical security solutions like access control systems and video surveillance to advanced cybersecurity technologies like intrusion detection systems and threat intelligence platforms. Recent product innovations focus on AI-powered threat detection, predictive analytics, and seamless integration with existing infrastructure. Key performance metrics include threat detection accuracy, response time, and system uptime. Unique selling propositions often involve advanced analytics, ease of use, and integration capabilities.
Key Drivers, Barriers & Challenges in Critical Infrastructure Security Industry
Key Drivers: Increased cyberattacks targeting critical infrastructure, stringent regulatory compliance mandates, and the growing adoption of IoT devices across various sectors.
Key Challenges: High implementation costs of advanced security solutions, skill shortages in cybersecurity professionals, and the evolving nature of cyber threats leading to ongoing investment requirements. Supply chain vulnerabilities, estimated to impact xx% of projects, also pose significant challenges.
Emerging Opportunities in Critical Infrastructure Security Industry
Growing demand for cloud-based security solutions, increasing adoption of AI-powered threat intelligence platforms, and the development of novel security technologies for specific infrastructure sectors present lucrative opportunities. Untapped markets in developing economies and the increasing focus on securing IoT devices offer significant growth potential. Expanding into adjacent markets, such as industrial cybersecurity and critical infrastructure resilience, provides further opportunities for expansion.
Growth Accelerators in the Critical Infrastructure Security Industry Industry
Strategic partnerships between technology vendors and infrastructure operators, technological breakthroughs in areas like quantum-resistant cryptography, and government initiatives promoting cybersecurity awareness and investment are key catalysts for long-term growth. Market expansion strategies focusing on emerging economies and underserved sectors are further fueling industry expansion. The development of robust cybersecurity standards and certifications will continue to accelerate market growth.
Key Players Shaping the Critical Infrastructure Security Market
- Honeywell International Inc
- General Dynamics Corporation
- Lockheed Martin Corporation
- Airbus SE
- Ericsson A
- Kaspersky Lab Inc
- Hexagon AB
- BAE Systems PLC
- Northrop Grumman Corp
- Waterfall Security Solutions
- McAfee Corp
- General Electric Company
Notable Milestones in Critical Infrastructure Security Industry Sector
- October 2023: GHD Digital launches its Cyber Critical Infrastructure and Risk Centre of Excellence (CoE), enhancing industry capabilities.
- May 2023: CISA's Ransomware Vulnerability Warning Pilot (RVWP) program strengthens critical infrastructure protection.
In-Depth Critical Infrastructure Security Industry Market Outlook
The Critical Infrastructure Security market is poised for continued strong growth, driven by sustained investment in cybersecurity, technological advancements, and evolving regulatory landscapes. Strategic partnerships and acquisitions will shape the market, while the focus on emerging technologies like AI and quantum computing will define future competition. Companies that can offer comprehensive, integrated solutions and adapt to evolving threats will be best positioned to succeed in this dynamic market.
Critical Infrastructure Security Industry Segmentation
-
1. Offering
-
1.1. Security Technology
- 1.1.1. Network Security
- 1.1.2. Physical Security
- 1.1.3. Vehicle Identification Management
- 1.1.4. Building Management Systems
- 1.1.5. Secure Communications
- 1.1.6. Radars
- 1.1.7. SCADA Security
- 1.1.8. CBRNE
-
1.1. Security Technology
-
2. Services
- 2.1. Risk Management Services
- 2.2. Designing, Integration, and Consultation
- 2.3. Managed Services
- 2.4. Maintenance and Support
-
3. Vertical
- 3.1. Energy and Power
- 3.2. Transportation
- 3.3. Sensitive Infrastructure and Enterprises
Critical Infrastructure Security Industry Segmentation By Geography
-
1. North America
- 1.1. United States
- 1.2. Canada
-
2. Europe
- 2.1. Germany
- 2.2. United Kingdom
- 2.3. France
- 2.4. Italy
-
3. Asia
- 3.1. China
- 3.2. Japan
- 3.3. India
-
4. Latin America
- 4.1. Brazil
- 4.2. Argentina
- 4.3. Mexico
-
5. Middle East and Africa
- 5.1. United Arab Emirates
- 5.2. Saudi Arabia
- 5.3. South Africa
- 5.4. Turkey
Critical Infrastructure Security Industry REPORT HIGHLIGHTS
| Aspects | Details |
|---|---|
| Study Period | 2019-2033 |
| Base Year | 2024 |
| Estimated Year | 2025 |
| Forecast Period | 2025-2033 |
| Historical Period | 2019-2024 |
| Growth Rate | CAGR of 3.92% from 2019-2033 |
| Segmentation |
|
Table of Contents
- 1. Introduction
- 1.1. Research Scope
- 1.2. Market Segmentation
- 1.3. Research Methodology
- 1.4. Definitions and Assumptions
- 2. Executive Summary
- 2.1. Introduction
- 3. Market Dynamics
- 3.1. Introduction
- 3.2. Market Drivers
- 3.2.1 Enormous Investments in Smart Grid Technology; Physical Threats
- 3.2.2 Cyber Threats
- 3.2.3 and Insider Attacks; Joint Functioning of Cloud Computing and Critical Infrastructure Protection; Political Pressures for Better Regulations and Implementations
- 3.3. Market Restrains
- 3.3.1. Poor Understanding of Industrial Control Systems; Lack of Interoperability Between Products
- 3.4. Market Trends
- 3.4.1. Maintenance and Support Services to Witness Major Growth
- 4. Market Factor Analysis
- 4.1. Porters Five Forces
- 4.2. Supply/Value Chain
- 4.3. PESTEL analysis
- 4.4. Market Entropy
- 4.5. Patent/Trademark Analysis
- 5. Global Critical Infrastructure Security Industry Analysis, Insights and Forecast, 2019-2031
- 5.1. Market Analysis, Insights and Forecast - by Offering
- 5.1.1. Security Technology
- 5.1.1.1. Network Security
- 5.1.1.2. Physical Security
- 5.1.1.3. Vehicle Identification Management
- 5.1.1.4. Building Management Systems
- 5.1.1.5. Secure Communications
- 5.1.1.6. Radars
- 5.1.1.7. SCADA Security
- 5.1.1.8. CBRNE
- 5.1.1. Security Technology
- 5.2. Market Analysis, Insights and Forecast - by Services
- 5.2.1. Risk Management Services
- 5.2.2. Designing, Integration, and Consultation
- 5.2.3. Managed Services
- 5.2.4. Maintenance and Support
- 5.3. Market Analysis, Insights and Forecast - by Vertical
- 5.3.1. Energy and Power
- 5.3.2. Transportation
- 5.3.3. Sensitive Infrastructure and Enterprises
- 5.4. Market Analysis, Insights and Forecast - by Region
- 5.4.1. North America
- 5.4.2. Europe
- 5.4.3. Asia
- 5.4.4. Latin America
- 5.4.5. Middle East and Africa
- 5.1. Market Analysis, Insights and Forecast - by Offering
- 6. North America Critical Infrastructure Security Industry Analysis, Insights and Forecast, 2019-2031
- 6.1. Market Analysis, Insights and Forecast - by Offering
- 6.1.1. Security Technology
- 6.1.1.1. Network Security
- 6.1.1.2. Physical Security
- 6.1.1.3. Vehicle Identification Management
- 6.1.1.4. Building Management Systems
- 6.1.1.5. Secure Communications
- 6.1.1.6. Radars
- 6.1.1.7. SCADA Security
- 6.1.1.8. CBRNE
- 6.1.1. Security Technology
- 6.2. Market Analysis, Insights and Forecast - by Services
- 6.2.1. Risk Management Services
- 6.2.2. Designing, Integration, and Consultation
- 6.2.3. Managed Services
- 6.2.4. Maintenance and Support
- 6.3. Market Analysis, Insights and Forecast - by Vertical
- 6.3.1. Energy and Power
- 6.3.2. Transportation
- 6.3.3. Sensitive Infrastructure and Enterprises
- 6.1. Market Analysis, Insights and Forecast - by Offering
- 7. Europe Critical Infrastructure Security Industry Analysis, Insights and Forecast, 2019-2031
- 7.1. Market Analysis, Insights and Forecast - by Offering
- 7.1.1. Security Technology
- 7.1.1.1. Network Security
- 7.1.1.2. Physical Security
- 7.1.1.3. Vehicle Identification Management
- 7.1.1.4. Building Management Systems
- 7.1.1.5. Secure Communications
- 7.1.1.6. Radars
- 7.1.1.7. SCADA Security
- 7.1.1.8. CBRNE
- 7.1.1. Security Technology
- 7.2. Market Analysis, Insights and Forecast - by Services
- 7.2.1. Risk Management Services
- 7.2.2. Designing, Integration, and Consultation
- 7.2.3. Managed Services
- 7.2.4. Maintenance and Support
- 7.3. Market Analysis, Insights and Forecast - by Vertical
- 7.3.1. Energy and Power
- 7.3.2. Transportation
- 7.3.3. Sensitive Infrastructure and Enterprises
- 7.1. Market Analysis, Insights and Forecast - by Offering
- 8. Asia Critical Infrastructure Security Industry Analysis, Insights and Forecast, 2019-2031
- 8.1. Market Analysis, Insights and Forecast - by Offering
- 8.1.1. Security Technology
- 8.1.1.1. Network Security
- 8.1.1.2. Physical Security
- 8.1.1.3. Vehicle Identification Management
- 8.1.1.4. Building Management Systems
- 8.1.1.5. Secure Communications
- 8.1.1.6. Radars
- 8.1.1.7. SCADA Security
- 8.1.1.8. CBRNE
- 8.1.1. Security Technology
- 8.2. Market Analysis, Insights and Forecast - by Services
- 8.2.1. Risk Management Services
- 8.2.2. Designing, Integration, and Consultation
- 8.2.3. Managed Services
- 8.2.4. Maintenance and Support
- 8.3. Market Analysis, Insights and Forecast - by Vertical
- 8.3.1. Energy and Power
- 8.3.2. Transportation
- 8.3.3. Sensitive Infrastructure and Enterprises
- 8.1. Market Analysis, Insights and Forecast - by Offering
- 9. Latin America Critical Infrastructure Security Industry Analysis, Insights and Forecast, 2019-2031
- 9.1. Market Analysis, Insights and Forecast - by Offering
- 9.1.1. Security Technology
- 9.1.1.1. Network Security
- 9.1.1.2. Physical Security
- 9.1.1.3. Vehicle Identification Management
- 9.1.1.4. Building Management Systems
- 9.1.1.5. Secure Communications
- 9.1.1.6. Radars
- 9.1.1.7. SCADA Security
- 9.1.1.8. CBRNE
- 9.1.1. Security Technology
- 9.2. Market Analysis, Insights and Forecast - by Services
- 9.2.1. Risk Management Services
- 9.2.2. Designing, Integration, and Consultation
- 9.2.3. Managed Services
- 9.2.4. Maintenance and Support
- 9.3. Market Analysis, Insights and Forecast - by Vertical
- 9.3.1. Energy and Power
- 9.3.2. Transportation
- 9.3.3. Sensitive Infrastructure and Enterprises
- 9.1. Market Analysis, Insights and Forecast - by Offering
- 10. Middle East and Africa Critical Infrastructure Security Industry Analysis, Insights and Forecast, 2019-2031
- 10.1. Market Analysis, Insights and Forecast - by Offering
- 10.1.1. Security Technology
- 10.1.1.1. Network Security
- 10.1.1.2. Physical Security
- 10.1.1.3. Vehicle Identification Management
- 10.1.1.4. Building Management Systems
- 10.1.1.5. Secure Communications
- 10.1.1.6. Radars
- 10.1.1.7. SCADA Security
- 10.1.1.8. CBRNE
- 10.1.1. Security Technology
- 10.2. Market Analysis, Insights and Forecast - by Services
- 10.2.1. Risk Management Services
- 10.2.2. Designing, Integration, and Consultation
- 10.2.3. Managed Services
- 10.2.4. Maintenance and Support
- 10.3. Market Analysis, Insights and Forecast - by Vertical
- 10.3.1. Energy and Power
- 10.3.2. Transportation
- 10.3.3. Sensitive Infrastructure and Enterprises
- 10.1. Market Analysis, Insights and Forecast - by Offering
- 11. North America Critical Infrastructure Security Industry Analysis, Insights and Forecast, 2019-2031
- 11.1. Market Analysis, Insights and Forecast - By Country/Sub-region
- 11.1.1 United States
- 11.1.2 Canada
- 11.1.3 Mexico
- 12. Europe Critical Infrastructure Security Industry Analysis, Insights and Forecast, 2019-2031
- 12.1. Market Analysis, Insights and Forecast - By Country/Sub-region
- 12.1.1 Germany
- 12.1.2 United Kingdom
- 12.1.3 France
- 12.1.4 Spain
- 12.1.5 Italy
- 12.1.6 Spain
- 12.1.7 Belgium
- 12.1.8 Netherland
- 12.1.9 Nordics
- 12.1.10 Rest of Europe
- 13. Asia Pacific Critical Infrastructure Security Industry Analysis, Insights and Forecast, 2019-2031
- 13.1. Market Analysis, Insights and Forecast - By Country/Sub-region
- 13.1.1 China
- 13.1.2 Japan
- 13.1.3 India
- 13.1.4 South Korea
- 13.1.5 Southeast Asia
- 13.1.6 Australia
- 13.1.7 Indonesia
- 13.1.8 Phillipes
- 13.1.9 Singapore
- 13.1.10 Thailandc
- 13.1.11 Rest of Asia Pacific
- 14. South America Critical Infrastructure Security Industry Analysis, Insights and Forecast, 2019-2031
- 14.1. Market Analysis, Insights and Forecast - By Country/Sub-region
- 14.1.1 Brazil
- 14.1.2 Argentina
- 14.1.3 Peru
- 14.1.4 Chile
- 14.1.5 Colombia
- 14.1.6 Ecuador
- 14.1.7 Venezuela
- 14.1.8 Rest of South America
- 15. North America Critical Infrastructure Security Industry Analysis, Insights and Forecast, 2019-2031
- 15.1. Market Analysis, Insights and Forecast - By Country/Sub-region
- 15.1.1 United States
- 15.1.2 Canada
- 15.1.3 Mexico
- 16. MEA Critical Infrastructure Security Industry Analysis, Insights and Forecast, 2019-2031
- 16.1. Market Analysis, Insights and Forecast - By Country/Sub-region
- 16.1.1 United Arab Emirates
- 16.1.2 Saudi Arabia
- 16.1.3 South Africa
- 16.1.4 Rest of Middle East and Africa
- 17. Competitive Analysis
- 17.1. Global Market Share Analysis 2024
- 17.2. Company Profiles
- 17.2.1 Honeywell International Inc
- 17.2.1.1. Overview
- 17.2.1.2. Products
- 17.2.1.3. SWOT Analysis
- 17.2.1.4. Recent Developments
- 17.2.1.5. Financials (Based on Availability)
- 17.2.2 General Dynamics Corporation
- 17.2.2.1. Overview
- 17.2.2.2. Products
- 17.2.2.3. SWOT Analysis
- 17.2.2.4. Recent Developments
- 17.2.2.5. Financials (Based on Availability)
- 17.2.3 Lockheed Martin Corporation
- 17.2.3.1. Overview
- 17.2.3.2. Products
- 17.2.3.3. SWOT Analysis
- 17.2.3.4. Recent Developments
- 17.2.3.5. Financials (Based on Availability)
- 17.2.4 Airbus SE
- 17.2.4.1. Overview
- 17.2.4.2. Products
- 17.2.4.3. SWOT Analysis
- 17.2.4.4. Recent Developments
- 17.2.4.5. Financials (Based on Availability)
- 17.2.5 Ericsson A
- 17.2.5.1. Overview
- 17.2.5.2. Products
- 17.2.5.3. SWOT Analysis
- 17.2.5.4. Recent Developments
- 17.2.5.5. Financials (Based on Availability)
- 17.2.6 Kaspersky Lab Inc
- 17.2.6.1. Overview
- 17.2.6.2. Products
- 17.2.6.3. SWOT Analysis
- 17.2.6.4. Recent Developments
- 17.2.6.5. Financials (Based on Availability)
- 17.2.7 Hexagon AB
- 17.2.7.1. Overview
- 17.2.7.2. Products
- 17.2.7.3. SWOT Analysis
- 17.2.7.4. Recent Developments
- 17.2.7.5. Financials (Based on Availability)
- 17.2.8 BAE Systems PLC
- 17.2.8.1. Overview
- 17.2.8.2. Products
- 17.2.8.3. SWOT Analysis
- 17.2.8.4. Recent Developments
- 17.2.8.5. Financials (Based on Availability)
- 17.2.9 Northrop Grumman Corp
- 17.2.9.1. Overview
- 17.2.9.2. Products
- 17.2.9.3. SWOT Analysis
- 17.2.9.4. Recent Developments
- 17.2.9.5. Financials (Based on Availability)
- 17.2.10 Waterfall Security Solutions
- 17.2.10.1. Overview
- 17.2.10.2. Products
- 17.2.10.3. SWOT Analysis
- 17.2.10.4. Recent Developments
- 17.2.10.5. Financials (Based on Availability)
- 17.2.11 McAfee Corp
- 17.2.11.1. Overview
- 17.2.11.2. Products
- 17.2.11.3. SWOT Analysis
- 17.2.11.4. Recent Developments
- 17.2.11.5. Financials (Based on Availability)
- 17.2.12 General Electric Company
- 17.2.12.1. Overview
- 17.2.12.2. Products
- 17.2.12.3. SWOT Analysis
- 17.2.12.4. Recent Developments
- 17.2.12.5. Financials (Based on Availability)
- 17.2.1 Honeywell International Inc
List of Figures
- Figure 1: Global Critical Infrastructure Security Industry Revenue Breakdown (Million, %) by Region 2024 & 2032
- Figure 2: Global Critical Infrastructure Security Industry Volume Breakdown (K Unit, %) by Region 2024 & 2032
- Figure 3: North America Critical Infrastructure Security Industry Revenue (Million), by Country 2024 & 2032
- Figure 4: North America Critical Infrastructure Security Industry Volume (K Unit), by Country 2024 & 2032
- Figure 5: North America Critical Infrastructure Security Industry Revenue Share (%), by Country 2024 & 2032
- Figure 6: North America Critical Infrastructure Security Industry Volume Share (%), by Country 2024 & 2032
- Figure 7: Europe Critical Infrastructure Security Industry Revenue (Million), by Country 2024 & 2032
- Figure 8: Europe Critical Infrastructure Security Industry Volume (K Unit), by Country 2024 & 2032
- Figure 9: Europe Critical Infrastructure Security Industry Revenue Share (%), by Country 2024 & 2032
- Figure 10: Europe Critical Infrastructure Security Industry Volume Share (%), by Country 2024 & 2032
- Figure 11: Asia Pacific Critical Infrastructure Security Industry Revenue (Million), by Country 2024 & 2032
- Figure 12: Asia Pacific Critical Infrastructure Security Industry Volume (K Unit), by Country 2024 & 2032
- Figure 13: Asia Pacific Critical Infrastructure Security Industry Revenue Share (%), by Country 2024 & 2032
- Figure 14: Asia Pacific Critical Infrastructure Security Industry Volume Share (%), by Country 2024 & 2032
- Figure 15: South America Critical Infrastructure Security Industry Revenue (Million), by Country 2024 & 2032
- Figure 16: South America Critical Infrastructure Security Industry Volume (K Unit), by Country 2024 & 2032
- Figure 17: South America Critical Infrastructure Security Industry Revenue Share (%), by Country 2024 & 2032
- Figure 18: South America Critical Infrastructure Security Industry Volume Share (%), by Country 2024 & 2032
- Figure 19: North America Critical Infrastructure Security Industry Revenue (Million), by Country 2024 & 2032
- Figure 20: North America Critical Infrastructure Security Industry Volume (K Unit), by Country 2024 & 2032
- Figure 21: North America Critical Infrastructure Security Industry Revenue Share (%), by Country 2024 & 2032
- Figure 22: North America Critical Infrastructure Security Industry Volume Share (%), by Country 2024 & 2032
- Figure 23: MEA Critical Infrastructure Security Industry Revenue (Million), by Country 2024 & 2032
- Figure 24: MEA Critical Infrastructure Security Industry Volume (K Unit), by Country 2024 & 2032
- Figure 25: MEA Critical Infrastructure Security Industry Revenue Share (%), by Country 2024 & 2032
- Figure 26: MEA Critical Infrastructure Security Industry Volume Share (%), by Country 2024 & 2032
- Figure 27: North America Critical Infrastructure Security Industry Revenue (Million), by Offering 2024 & 2032
- Figure 28: North America Critical Infrastructure Security Industry Volume (K Unit), by Offering 2024 & 2032
- Figure 29: North America Critical Infrastructure Security Industry Revenue Share (%), by Offering 2024 & 2032
- Figure 30: North America Critical Infrastructure Security Industry Volume Share (%), by Offering 2024 & 2032
- Figure 31: North America Critical Infrastructure Security Industry Revenue (Million), by Services 2024 & 2032
- Figure 32: North America Critical Infrastructure Security Industry Volume (K Unit), by Services 2024 & 2032
- Figure 33: North America Critical Infrastructure Security Industry Revenue Share (%), by Services 2024 & 2032
- Figure 34: North America Critical Infrastructure Security Industry Volume Share (%), by Services 2024 & 2032
- Figure 35: North America Critical Infrastructure Security Industry Revenue (Million), by Vertical 2024 & 2032
- Figure 36: North America Critical Infrastructure Security Industry Volume (K Unit), by Vertical 2024 & 2032
- Figure 37: North America Critical Infrastructure Security Industry Revenue Share (%), by Vertical 2024 & 2032
- Figure 38: North America Critical Infrastructure Security Industry Volume Share (%), by Vertical 2024 & 2032
- Figure 39: North America Critical Infrastructure Security Industry Revenue (Million), by Country 2024 & 2032
- Figure 40: North America Critical Infrastructure Security Industry Volume (K Unit), by Country 2024 & 2032
- Figure 41: North America Critical Infrastructure Security Industry Revenue Share (%), by Country 2024 & 2032
- Figure 42: North America Critical Infrastructure Security Industry Volume Share (%), by Country 2024 & 2032
- Figure 43: Europe Critical Infrastructure Security Industry Revenue (Million), by Offering 2024 & 2032
- Figure 44: Europe Critical Infrastructure Security Industry Volume (K Unit), by Offering 2024 & 2032
- Figure 45: Europe Critical Infrastructure Security Industry Revenue Share (%), by Offering 2024 & 2032
- Figure 46: Europe Critical Infrastructure Security Industry Volume Share (%), by Offering 2024 & 2032
- Figure 47: Europe Critical Infrastructure Security Industry Revenue (Million), by Services 2024 & 2032
- Figure 48: Europe Critical Infrastructure Security Industry Volume (K Unit), by Services 2024 & 2032
- Figure 49: Europe Critical Infrastructure Security Industry Revenue Share (%), by Services 2024 & 2032
- Figure 50: Europe Critical Infrastructure Security Industry Volume Share (%), by Services 2024 & 2032
- Figure 51: Europe Critical Infrastructure Security Industry Revenue (Million), by Vertical 2024 & 2032
- Figure 52: Europe Critical Infrastructure Security Industry Volume (K Unit), by Vertical 2024 & 2032
- Figure 53: Europe Critical Infrastructure Security Industry Revenue Share (%), by Vertical 2024 & 2032
- Figure 54: Europe Critical Infrastructure Security Industry Volume Share (%), by Vertical 2024 & 2032
- Figure 55: Europe Critical Infrastructure Security Industry Revenue (Million), by Country 2024 & 2032
- Figure 56: Europe Critical Infrastructure Security Industry Volume (K Unit), by Country 2024 & 2032
- Figure 57: Europe Critical Infrastructure Security Industry Revenue Share (%), by Country 2024 & 2032
- Figure 58: Europe Critical Infrastructure Security Industry Volume Share (%), by Country 2024 & 2032
- Figure 59: Asia Critical Infrastructure Security Industry Revenue (Million), by Offering 2024 & 2032
- Figure 60: Asia Critical Infrastructure Security Industry Volume (K Unit), by Offering 2024 & 2032
- Figure 61: Asia Critical Infrastructure Security Industry Revenue Share (%), by Offering 2024 & 2032
- Figure 62: Asia Critical Infrastructure Security Industry Volume Share (%), by Offering 2024 & 2032
- Figure 63: Asia Critical Infrastructure Security Industry Revenue (Million), by Services 2024 & 2032
- Figure 64: Asia Critical Infrastructure Security Industry Volume (K Unit), by Services 2024 & 2032
- Figure 65: Asia Critical Infrastructure Security Industry Revenue Share (%), by Services 2024 & 2032
- Figure 66: Asia Critical Infrastructure Security Industry Volume Share (%), by Services 2024 & 2032
- Figure 67: Asia Critical Infrastructure Security Industry Revenue (Million), by Vertical 2024 & 2032
- Figure 68: Asia Critical Infrastructure Security Industry Volume (K Unit), by Vertical 2024 & 2032
- Figure 69: Asia Critical Infrastructure Security Industry Revenue Share (%), by Vertical 2024 & 2032
- Figure 70: Asia Critical Infrastructure Security Industry Volume Share (%), by Vertical 2024 & 2032
- Figure 71: Asia Critical Infrastructure Security Industry Revenue (Million), by Country 2024 & 2032
- Figure 72: Asia Critical Infrastructure Security Industry Volume (K Unit), by Country 2024 & 2032
- Figure 73: Asia Critical Infrastructure Security Industry Revenue Share (%), by Country 2024 & 2032
- Figure 74: Asia Critical Infrastructure Security Industry Volume Share (%), by Country 2024 & 2032
- Figure 75: Latin America Critical Infrastructure Security Industry Revenue (Million), by Offering 2024 & 2032
- Figure 76: Latin America Critical Infrastructure Security Industry Volume (K Unit), by Offering 2024 & 2032
- Figure 77: Latin America Critical Infrastructure Security Industry Revenue Share (%), by Offering 2024 & 2032
- Figure 78: Latin America Critical Infrastructure Security Industry Volume Share (%), by Offering 2024 & 2032
- Figure 79: Latin America Critical Infrastructure Security Industry Revenue (Million), by Services 2024 & 2032
- Figure 80: Latin America Critical Infrastructure Security Industry Volume (K Unit), by Services 2024 & 2032
- Figure 81: Latin America Critical Infrastructure Security Industry Revenue Share (%), by Services 2024 & 2032
- Figure 82: Latin America Critical Infrastructure Security Industry Volume Share (%), by Services 2024 & 2032
- Figure 83: Latin America Critical Infrastructure Security Industry Revenue (Million), by Vertical 2024 & 2032
- Figure 84: Latin America Critical Infrastructure Security Industry Volume (K Unit), by Vertical 2024 & 2032
- Figure 85: Latin America Critical Infrastructure Security Industry Revenue Share (%), by Vertical 2024 & 2032
- Figure 86: Latin America Critical Infrastructure Security Industry Volume Share (%), by Vertical 2024 & 2032
- Figure 87: Latin America Critical Infrastructure Security Industry Revenue (Million), by Country 2024 & 2032
- Figure 88: Latin America Critical Infrastructure Security Industry Volume (K Unit), by Country 2024 & 2032
- Figure 89: Latin America Critical Infrastructure Security Industry Revenue Share (%), by Country 2024 & 2032
- Figure 90: Latin America Critical Infrastructure Security Industry Volume Share (%), by Country 2024 & 2032
- Figure 91: Middle East and Africa Critical Infrastructure Security Industry Revenue (Million), by Offering 2024 & 2032
- Figure 92: Middle East and Africa Critical Infrastructure Security Industry Volume (K Unit), by Offering 2024 & 2032
- Figure 93: Middle East and Africa Critical Infrastructure Security Industry Revenue Share (%), by Offering 2024 & 2032
- Figure 94: Middle East and Africa Critical Infrastructure Security Industry Volume Share (%), by Offering 2024 & 2032
- Figure 95: Middle East and Africa Critical Infrastructure Security Industry Revenue (Million), by Services 2024 & 2032
- Figure 96: Middle East and Africa Critical Infrastructure Security Industry Volume (K Unit), by Services 2024 & 2032
- Figure 97: Middle East and Africa Critical Infrastructure Security Industry Revenue Share (%), by Services 2024 & 2032
- Figure 98: Middle East and Africa Critical Infrastructure Security Industry Volume Share (%), by Services 2024 & 2032
- Figure 99: Middle East and Africa Critical Infrastructure Security Industry Revenue (Million), by Vertical 2024 & 2032
- Figure 100: Middle East and Africa Critical Infrastructure Security Industry Volume (K Unit), by Vertical 2024 & 2032
- Figure 101: Middle East and Africa Critical Infrastructure Security Industry Revenue Share (%), by Vertical 2024 & 2032
- Figure 102: Middle East and Africa Critical Infrastructure Security Industry Volume Share (%), by Vertical 2024 & 2032
- Figure 103: Middle East and Africa Critical Infrastructure Security Industry Revenue (Million), by Country 2024 & 2032
- Figure 104: Middle East and Africa Critical Infrastructure Security Industry Volume (K Unit), by Country 2024 & 2032
- Figure 105: Middle East and Africa Critical Infrastructure Security Industry Revenue Share (%), by Country 2024 & 2032
- Figure 106: Middle East and Africa Critical Infrastructure Security Industry Volume Share (%), by Country 2024 & 2032
List of Tables
- Table 1: Global Critical Infrastructure Security Industry Revenue Million Forecast, by Region 2019 & 2032
- Table 2: Global Critical Infrastructure Security Industry Volume K Unit Forecast, by Region 2019 & 2032
- Table 3: Global Critical Infrastructure Security Industry Revenue Million Forecast, by Offering 2019 & 2032
- Table 4: Global Critical Infrastructure Security Industry Volume K Unit Forecast, by Offering 2019 & 2032
- Table 5: Global Critical Infrastructure Security Industry Revenue Million Forecast, by Services 2019 & 2032
- Table 6: Global Critical Infrastructure Security Industry Volume K Unit Forecast, by Services 2019 & 2032
- Table 7: Global Critical Infrastructure Security Industry Revenue Million Forecast, by Vertical 2019 & 2032
- Table 8: Global Critical Infrastructure Security Industry Volume K Unit Forecast, by Vertical 2019 & 2032
- Table 9: Global Critical Infrastructure Security Industry Revenue Million Forecast, by Region 2019 & 2032
- Table 10: Global Critical Infrastructure Security Industry Volume K Unit Forecast, by Region 2019 & 2032
- Table 11: Global Critical Infrastructure Security Industry Revenue Million Forecast, by Country 2019 & 2032
- Table 12: Global Critical Infrastructure Security Industry Volume K Unit Forecast, by Country 2019 & 2032
- Table 13: United States Critical Infrastructure Security Industry Revenue (Million) Forecast, by Application 2019 & 2032
- Table 14: United States Critical Infrastructure Security Industry Volume (K Unit) Forecast, by Application 2019 & 2032
- Table 15: Canada Critical Infrastructure Security Industry Revenue (Million) Forecast, by Application 2019 & 2032
- Table 16: Canada Critical Infrastructure Security Industry Volume (K Unit) Forecast, by Application 2019 & 2032
- Table 17: Mexico Critical Infrastructure Security Industry Revenue (Million) Forecast, by Application 2019 & 2032
- Table 18: Mexico Critical Infrastructure Security Industry Volume (K Unit) Forecast, by Application 2019 & 2032
- Table 19: Global Critical Infrastructure Security Industry Revenue Million Forecast, by Country 2019 & 2032
- Table 20: Global Critical Infrastructure Security Industry Volume K Unit Forecast, by Country 2019 & 2032
- Table 21: Germany Critical Infrastructure Security Industry Revenue (Million) Forecast, by Application 2019 & 2032
- Table 22: Germany Critical Infrastructure Security Industry Volume (K Unit) Forecast, by Application 2019 & 2032
- Table 23: United Kingdom Critical Infrastructure Security Industry Revenue (Million) Forecast, by Application 2019 & 2032
- Table 24: United Kingdom Critical Infrastructure Security Industry Volume (K Unit) Forecast, by Application 2019 & 2032
- Table 25: France Critical Infrastructure Security Industry Revenue (Million) Forecast, by Application 2019 & 2032
- Table 26: France Critical Infrastructure Security Industry Volume (K Unit) Forecast, by Application 2019 & 2032
- Table 27: Spain Critical Infrastructure Security Industry Revenue (Million) Forecast, by Application 2019 & 2032
- Table 28: Spain Critical Infrastructure Security Industry Volume (K Unit) Forecast, by Application 2019 & 2032
- Table 29: Italy Critical Infrastructure Security Industry Revenue (Million) Forecast, by Application 2019 & 2032
- Table 30: Italy Critical Infrastructure Security Industry Volume (K Unit) Forecast, by Application 2019 & 2032
- Table 31: Spain Critical Infrastructure Security Industry Revenue (Million) Forecast, by Application 2019 & 2032
- Table 32: Spain Critical Infrastructure Security Industry Volume (K Unit) Forecast, by Application 2019 & 2032
- Table 33: Belgium Critical Infrastructure Security Industry Revenue (Million) Forecast, by Application 2019 & 2032
- Table 34: Belgium Critical Infrastructure Security Industry Volume (K Unit) Forecast, by Application 2019 & 2032
- Table 35: Netherland Critical Infrastructure Security Industry Revenue (Million) Forecast, by Application 2019 & 2032
- Table 36: Netherland Critical Infrastructure Security Industry Volume (K Unit) Forecast, by Application 2019 & 2032
- Table 37: Nordics Critical Infrastructure Security Industry Revenue (Million) Forecast, by Application 2019 & 2032
- Table 38: Nordics Critical Infrastructure Security Industry Volume (K Unit) Forecast, by Application 2019 & 2032
- Table 39: Rest of Europe Critical Infrastructure Security Industry Revenue (Million) Forecast, by Application 2019 & 2032
- Table 40: Rest of Europe Critical Infrastructure Security Industry Volume (K Unit) Forecast, by Application 2019 & 2032
- Table 41: Global Critical Infrastructure Security Industry Revenue Million Forecast, by Country 2019 & 2032
- Table 42: Global Critical Infrastructure Security Industry Volume K Unit Forecast, by Country 2019 & 2032
- Table 43: China Critical Infrastructure Security Industry Revenue (Million) Forecast, by Application 2019 & 2032
- Table 44: China Critical Infrastructure Security Industry Volume (K Unit) Forecast, by Application 2019 & 2032
- Table 45: Japan Critical Infrastructure Security Industry Revenue (Million) Forecast, by Application 2019 & 2032
- Table 46: Japan Critical Infrastructure Security Industry Volume (K Unit) Forecast, by Application 2019 & 2032
- Table 47: India Critical Infrastructure Security Industry Revenue (Million) Forecast, by Application 2019 & 2032
- Table 48: India Critical Infrastructure Security Industry Volume (K Unit) Forecast, by Application 2019 & 2032
- Table 49: South Korea Critical Infrastructure Security Industry Revenue (Million) Forecast, by Application 2019 & 2032
- Table 50: South Korea Critical Infrastructure Security Industry Volume (K Unit) Forecast, by Application 2019 & 2032
- Table 51: Southeast Asia Critical Infrastructure Security Industry Revenue (Million) Forecast, by Application 2019 & 2032
- Table 52: Southeast Asia Critical Infrastructure Security Industry Volume (K Unit) Forecast, by Application 2019 & 2032
- Table 53: Australia Critical Infrastructure Security Industry Revenue (Million) Forecast, by Application 2019 & 2032
- Table 54: Australia Critical Infrastructure Security Industry Volume (K Unit) Forecast, by Application 2019 & 2032
- Table 55: Indonesia Critical Infrastructure Security Industry Revenue (Million) Forecast, by Application 2019 & 2032
- Table 56: Indonesia Critical Infrastructure Security Industry Volume (K Unit) Forecast, by Application 2019 & 2032
- Table 57: Phillipes Critical Infrastructure Security Industry Revenue (Million) Forecast, by Application 2019 & 2032
- Table 58: Phillipes Critical Infrastructure Security Industry Volume (K Unit) Forecast, by Application 2019 & 2032
- Table 59: Singapore Critical Infrastructure Security Industry Revenue (Million) Forecast, by Application 2019 & 2032
- Table 60: Singapore Critical Infrastructure Security Industry Volume (K Unit) Forecast, by Application 2019 & 2032
- Table 61: Thailandc Critical Infrastructure Security Industry Revenue (Million) Forecast, by Application 2019 & 2032
- Table 62: Thailandc Critical Infrastructure Security Industry Volume (K Unit) Forecast, by Application 2019 & 2032
- Table 63: Rest of Asia Pacific Critical Infrastructure Security Industry Revenue (Million) Forecast, by Application 2019 & 2032
- Table 64: Rest of Asia Pacific Critical Infrastructure Security Industry Volume (K Unit) Forecast, by Application 2019 & 2032
- Table 65: Global Critical Infrastructure Security Industry Revenue Million Forecast, by Country 2019 & 2032
- Table 66: Global Critical Infrastructure Security Industry Volume K Unit Forecast, by Country 2019 & 2032
- Table 67: Brazil Critical Infrastructure Security Industry Revenue (Million) Forecast, by Application 2019 & 2032
- Table 68: Brazil Critical Infrastructure Security Industry Volume (K Unit) Forecast, by Application 2019 & 2032
- Table 69: Argentina Critical Infrastructure Security Industry Revenue (Million) Forecast, by Application 2019 & 2032
- Table 70: Argentina Critical Infrastructure Security Industry Volume (K Unit) Forecast, by Application 2019 & 2032
- Table 71: Peru Critical Infrastructure Security Industry Revenue (Million) Forecast, by Application 2019 & 2032
- Table 72: Peru Critical Infrastructure Security Industry Volume (K Unit) Forecast, by Application 2019 & 2032
- Table 73: Chile Critical Infrastructure Security Industry Revenue (Million) Forecast, by Application 2019 & 2032
- Table 74: Chile Critical Infrastructure Security Industry Volume (K Unit) Forecast, by Application 2019 & 2032
- Table 75: Colombia Critical Infrastructure Security Industry Revenue (Million) Forecast, by Application 2019 & 2032
- Table 76: Colombia Critical Infrastructure Security Industry Volume (K Unit) Forecast, by Application 2019 & 2032
- Table 77: Ecuador Critical Infrastructure Security Industry Revenue (Million) Forecast, by Application 2019 & 2032
- Table 78: Ecuador Critical Infrastructure Security Industry Volume (K Unit) Forecast, by Application 2019 & 2032
- Table 79: Venezuela Critical Infrastructure Security Industry Revenue (Million) Forecast, by Application 2019 & 2032
- Table 80: Venezuela Critical Infrastructure Security Industry Volume (K Unit) Forecast, by Application 2019 & 2032
- Table 81: Rest of South America Critical Infrastructure Security Industry Revenue (Million) Forecast, by Application 2019 & 2032
- Table 82: Rest of South America Critical Infrastructure Security Industry Volume (K Unit) Forecast, by Application 2019 & 2032
- Table 83: Global Critical Infrastructure Security Industry Revenue Million Forecast, by Country 2019 & 2032
- Table 84: Global Critical Infrastructure Security Industry Volume K Unit Forecast, by Country 2019 & 2032
- Table 85: United States Critical Infrastructure Security Industry Revenue (Million) Forecast, by Application 2019 & 2032
- Table 86: United States Critical Infrastructure Security Industry Volume (K Unit) Forecast, by Application 2019 & 2032
- Table 87: Canada Critical Infrastructure Security Industry Revenue (Million) Forecast, by Application 2019 & 2032
- Table 88: Canada Critical Infrastructure Security Industry Volume (K Unit) Forecast, by Application 2019 & 2032
- Table 89: Mexico Critical Infrastructure Security Industry Revenue (Million) Forecast, by Application 2019 & 2032
- Table 90: Mexico Critical Infrastructure Security Industry Volume (K Unit) Forecast, by Application 2019 & 2032
- Table 91: Global Critical Infrastructure Security Industry Revenue Million Forecast, by Country 2019 & 2032
- Table 92: Global Critical Infrastructure Security Industry Volume K Unit Forecast, by Country 2019 & 2032
- Table 93: United Arab Emirates Critical Infrastructure Security Industry Revenue (Million) Forecast, by Application 2019 & 2032
- Table 94: United Arab Emirates Critical Infrastructure Security Industry Volume (K Unit) Forecast, by Application 2019 & 2032
- Table 95: Saudi Arabia Critical Infrastructure Security Industry Revenue (Million) Forecast, by Application 2019 & 2032
- Table 96: Saudi Arabia Critical Infrastructure Security Industry Volume (K Unit) Forecast, by Application 2019 & 2032
- Table 97: South Africa Critical Infrastructure Security Industry Revenue (Million) Forecast, by Application 2019 & 2032
- Table 98: South Africa Critical Infrastructure Security Industry Volume (K Unit) Forecast, by Application 2019 & 2032
- Table 99: Rest of Middle East and Africa Critical Infrastructure Security Industry Revenue (Million) Forecast, by Application 2019 & 2032
- Table 100: Rest of Middle East and Africa Critical Infrastructure Security Industry Volume (K Unit) Forecast, by Application 2019 & 2032
- Table 101: Global Critical Infrastructure Security Industry Revenue Million Forecast, by Offering 2019 & 2032
- Table 102: Global Critical Infrastructure Security Industry Volume K Unit Forecast, by Offering 2019 & 2032
- Table 103: Global Critical Infrastructure Security Industry Revenue Million Forecast, by Services 2019 & 2032
- Table 104: Global Critical Infrastructure Security Industry Volume K Unit Forecast, by Services 2019 & 2032
- Table 105: Global Critical Infrastructure Security Industry Revenue Million Forecast, by Vertical 2019 & 2032
- Table 106: Global Critical Infrastructure Security Industry Volume K Unit Forecast, by Vertical 2019 & 2032
- Table 107: Global Critical Infrastructure Security Industry Revenue Million Forecast, by Country 2019 & 2032
- Table 108: Global Critical Infrastructure Security Industry Volume K Unit Forecast, by Country 2019 & 2032
- Table 109: United States Critical Infrastructure Security Industry Revenue (Million) Forecast, by Application 2019 & 2032
- Table 110: United States Critical Infrastructure Security Industry Volume (K Unit) Forecast, by Application 2019 & 2032
- Table 111: Canada Critical Infrastructure Security Industry Revenue (Million) Forecast, by Application 2019 & 2032
- Table 112: Canada Critical Infrastructure Security Industry Volume (K Unit) Forecast, by Application 2019 & 2032
- Table 113: Global Critical Infrastructure Security Industry Revenue Million Forecast, by Offering 2019 & 2032
- Table 114: Global Critical Infrastructure Security Industry Volume K Unit Forecast, by Offering 2019 & 2032
- Table 115: Global Critical Infrastructure Security Industry Revenue Million Forecast, by Services 2019 & 2032
- Table 116: Global Critical Infrastructure Security Industry Volume K Unit Forecast, by Services 2019 & 2032
- Table 117: Global Critical Infrastructure Security Industry Revenue Million Forecast, by Vertical 2019 & 2032
- Table 118: Global Critical Infrastructure Security Industry Volume K Unit Forecast, by Vertical 2019 & 2032
- Table 119: Global Critical Infrastructure Security Industry Revenue Million Forecast, by Country 2019 & 2032
- Table 120: Global Critical Infrastructure Security Industry Volume K Unit Forecast, by Country 2019 & 2032
- Table 121: Germany Critical Infrastructure Security Industry Revenue (Million) Forecast, by Application 2019 & 2032
- Table 122: Germany Critical Infrastructure Security Industry Volume (K Unit) Forecast, by Application 2019 & 2032
- Table 123: United Kingdom Critical Infrastructure Security Industry Revenue (Million) Forecast, by Application 2019 & 2032
- Table 124: United Kingdom Critical Infrastructure Security Industry Volume (K Unit) Forecast, by Application 2019 & 2032
- Table 125: France Critical Infrastructure Security Industry Revenue (Million) Forecast, by Application 2019 & 2032
- Table 126: France Critical Infrastructure Security Industry Volume (K Unit) Forecast, by Application 2019 & 2032
- Table 127: Italy Critical Infrastructure Security Industry Revenue (Million) Forecast, by Application 2019 & 2032
- Table 128: Italy Critical Infrastructure Security Industry Volume (K Unit) Forecast, by Application 2019 & 2032
- Table 129: Global Critical Infrastructure Security Industry Revenue Million Forecast, by Offering 2019 & 2032
- Table 130: Global Critical Infrastructure Security Industry Volume K Unit Forecast, by Offering 2019 & 2032
- Table 131: Global Critical Infrastructure Security Industry Revenue Million Forecast, by Services 2019 & 2032
- Table 132: Global Critical Infrastructure Security Industry Volume K Unit Forecast, by Services 2019 & 2032
- Table 133: Global Critical Infrastructure Security Industry Revenue Million Forecast, by Vertical 2019 & 2032
- Table 134: Global Critical Infrastructure Security Industry Volume K Unit Forecast, by Vertical 2019 & 2032
- Table 135: Global Critical Infrastructure Security Industry Revenue Million Forecast, by Country 2019 & 2032
- Table 136: Global Critical Infrastructure Security Industry Volume K Unit Forecast, by Country 2019 & 2032
- Table 137: China Critical Infrastructure Security Industry Revenue (Million) Forecast, by Application 2019 & 2032
- Table 138: China Critical Infrastructure Security Industry Volume (K Unit) Forecast, by Application 2019 & 2032
- Table 139: Japan Critical Infrastructure Security Industry Revenue (Million) Forecast, by Application 2019 & 2032
- Table 140: Japan Critical Infrastructure Security Industry Volume (K Unit) Forecast, by Application 2019 & 2032
- Table 141: India Critical Infrastructure Security Industry Revenue (Million) Forecast, by Application 2019 & 2032
- Table 142: India Critical Infrastructure Security Industry Volume (K Unit) Forecast, by Application 2019 & 2032
- Table 143: Global Critical Infrastructure Security Industry Revenue Million Forecast, by Offering 2019 & 2032
- Table 144: Global Critical Infrastructure Security Industry Volume K Unit Forecast, by Offering 2019 & 2032
- Table 145: Global Critical Infrastructure Security Industry Revenue Million Forecast, by Services 2019 & 2032
- Table 146: Global Critical Infrastructure Security Industry Volume K Unit Forecast, by Services 2019 & 2032
- Table 147: Global Critical Infrastructure Security Industry Revenue Million Forecast, by Vertical 2019 & 2032
- Table 148: Global Critical Infrastructure Security Industry Volume K Unit Forecast, by Vertical 2019 & 2032
- Table 149: Global Critical Infrastructure Security Industry Revenue Million Forecast, by Country 2019 & 2032
- Table 150: Global Critical Infrastructure Security Industry Volume K Unit Forecast, by Country 2019 & 2032
- Table 151: Brazil Critical Infrastructure Security Industry Revenue (Million) Forecast, by Application 2019 & 2032
- Table 152: Brazil Critical Infrastructure Security Industry Volume (K Unit) Forecast, by Application 2019 & 2032
- Table 153: Argentina Critical Infrastructure Security Industry Revenue (Million) Forecast, by Application 2019 & 2032
- Table 154: Argentina Critical Infrastructure Security Industry Volume (K Unit) Forecast, by Application 2019 & 2032
- Table 155: Mexico Critical Infrastructure Security Industry Revenue (Million) Forecast, by Application 2019 & 2032
- Table 156: Mexico Critical Infrastructure Security Industry Volume (K Unit) Forecast, by Application 2019 & 2032
- Table 157: Global Critical Infrastructure Security Industry Revenue Million Forecast, by Offering 2019 & 2032
- Table 158: Global Critical Infrastructure Security Industry Volume K Unit Forecast, by Offering 2019 & 2032
- Table 159: Global Critical Infrastructure Security Industry Revenue Million Forecast, by Services 2019 & 2032
- Table 160: Global Critical Infrastructure Security Industry Volume K Unit Forecast, by Services 2019 & 2032
- Table 161: Global Critical Infrastructure Security Industry Revenue Million Forecast, by Vertical 2019 & 2032
- Table 162: Global Critical Infrastructure Security Industry Volume K Unit Forecast, by Vertical 2019 & 2032
- Table 163: Global Critical Infrastructure Security Industry Revenue Million Forecast, by Country 2019 & 2032
- Table 164: Global Critical Infrastructure Security Industry Volume K Unit Forecast, by Country 2019 & 2032
- Table 165: United Arab Emirates Critical Infrastructure Security Industry Revenue (Million) Forecast, by Application 2019 & 2032
- Table 166: United Arab Emirates Critical Infrastructure Security Industry Volume (K Unit) Forecast, by Application 2019 & 2032
- Table 167: Saudi Arabia Critical Infrastructure Security Industry Revenue (Million) Forecast, by Application 2019 & 2032
- Table 168: Saudi Arabia Critical Infrastructure Security Industry Volume (K Unit) Forecast, by Application 2019 & 2032
- Table 169: South Africa Critical Infrastructure Security Industry Revenue (Million) Forecast, by Application 2019 & 2032
- Table 170: South Africa Critical Infrastructure Security Industry Volume (K Unit) Forecast, by Application 2019 & 2032
- Table 171: Turkey Critical Infrastructure Security Industry Revenue (Million) Forecast, by Application 2019 & 2032
- Table 172: Turkey Critical Infrastructure Security Industry Volume (K Unit) Forecast, by Application 2019 & 2032
Frequently Asked Questions
1. What is the projected Compound Annual Growth Rate (CAGR) of the Critical Infrastructure Security Industry?
The projected CAGR is approximately 3.92%.
2. Which companies are prominent players in the Critical Infrastructure Security Industry?
Key companies in the market include Honeywell International Inc, General Dynamics Corporation, Lockheed Martin Corporation, Airbus SE, Ericsson A, Kaspersky Lab Inc, Hexagon AB, BAE Systems PLC, Northrop Grumman Corp, Waterfall Security Solutions, McAfee Corp, General Electric Company.
3. What are the main segments of the Critical Infrastructure Security Industry?
The market segments include Offering, Services, Vertical.
4. Can you provide details about the market size?
The market size is estimated to be USD 148.5 Million as of 2022.
5. What are some drivers contributing to market growth?
Enormous Investments in Smart Grid Technology; Physical Threats. Cyber Threats. and Insider Attacks; Joint Functioning of Cloud Computing and Critical Infrastructure Protection; Political Pressures for Better Regulations and Implementations.
6. What are the notable trends driving market growth?
Maintenance and Support Services to Witness Major Growth.
7. Are there any restraints impacting market growth?
Poor Understanding of Industrial Control Systems; Lack of Interoperability Between Products.
8. Can you provide examples of recent developments in the market?
October 2023 - GHD Digital announced the launch of its Cyber Critical Infrastructure and Risk Centre of Excellence (CoE), designed to protect organizations, their critical systems, and sensitive information from the growing threat of cyber-attacks.
9. What pricing options are available for accessing the report?
Pricing options include single-user, multi-user, and enterprise licenses priced at USD 4750, USD 5250, and USD 8750 respectively.
10. Is the market size provided in terms of value or volume?
The market size is provided in terms of value, measured in Million and volume, measured in K Unit.
11. Are there any specific market keywords associated with the report?
Yes, the market keyword associated with the report is "Critical Infrastructure Security Industry," which aids in identifying and referencing the specific market segment covered.
12. How do I determine which pricing option suits my needs best?
The pricing options vary based on user requirements and access needs. Individual users may opt for single-user licenses, while businesses requiring broader access may choose multi-user or enterprise licenses for cost-effective access to the report.
13. Are there any additional resources or data provided in the Critical Infrastructure Security Industry report?
While the report offers comprehensive insights, it's advisable to review the specific contents or supplementary materials provided to ascertain if additional resources or data are available.
14. How can I stay updated on further developments or reports in the Critical Infrastructure Security Industry?
To stay informed about further developments, trends, and reports in the Critical Infrastructure Security Industry, consider subscribing to industry newsletters, following relevant companies and organizations, or regularly checking reputable industry news sources and publications.
Methodology
Step 1 - Identification of Relevant Samples Size from Population Database


Step 2 - Approaches for Defining Global Market Size (Value, Volume* & Price*)

Note*: In applicable scenarios
Step 3 - Data Sources
Primary Research
- Web Analytics
- Survey Reports
- Research Institute
- Latest Research Reports
- Opinion Leaders
Secondary Research
- Annual Reports
- White Paper
- Latest Press Release
- Industry Association
- Paid Database
- Investor Presentations

Step 4 - Data Triangulation
Involves using different sources of information in order to increase the validity of a study
These sources are likely to be stakeholders in a program - participants, other researchers, program staff, other community members, and so on.
Then we put all data in single framework & apply various statistical tools to find out the dynamic on the market.
During the analysis stage, feedback from the stakeholder groups would be compared to determine areas of agreement as well as areas of divergence


