
Key Insights
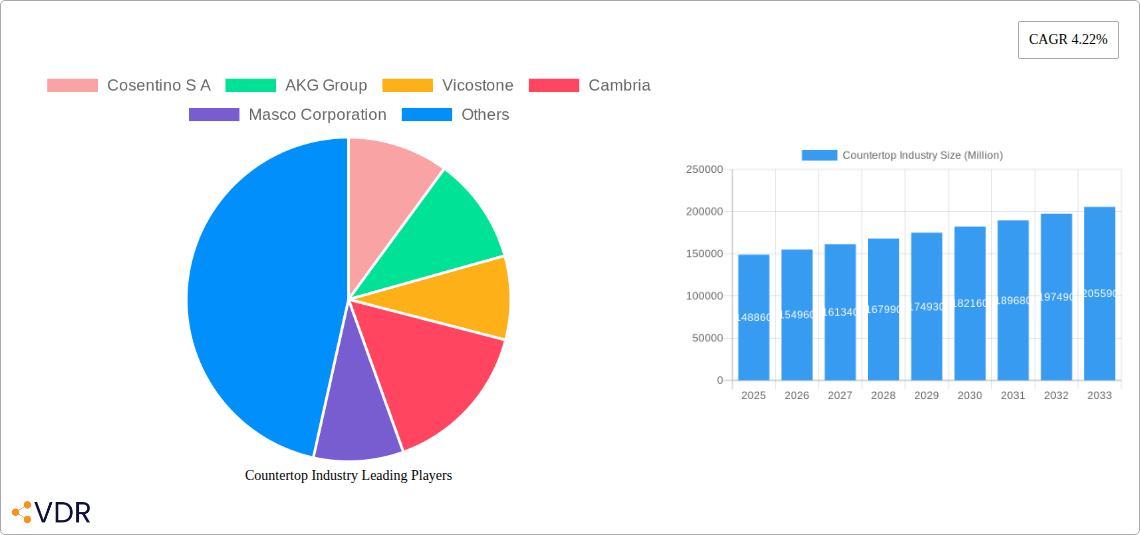
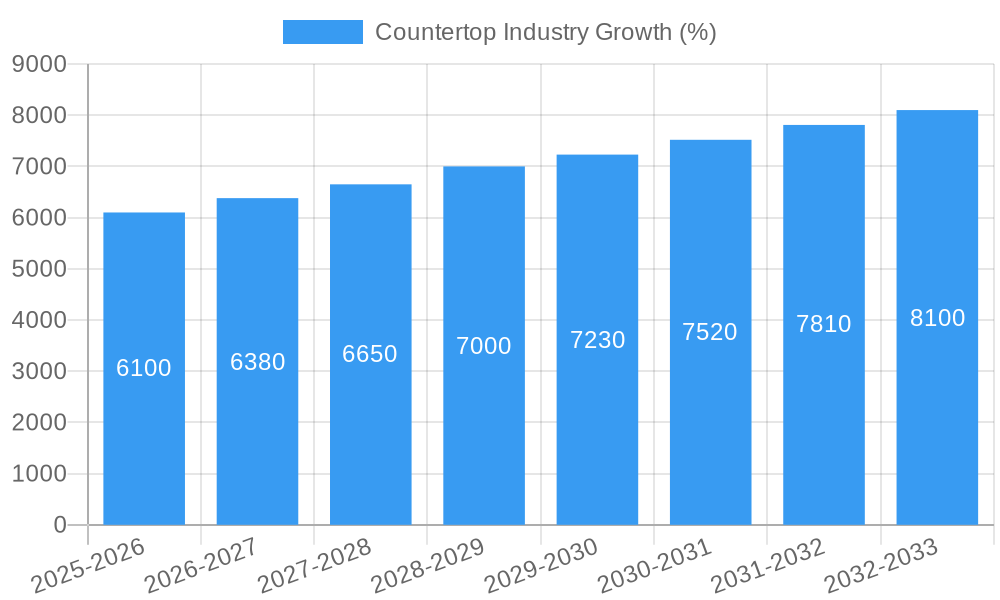
The global countertop market, valued at $148.86 billion in 2025, is projected to experience robust growth, driven by a compound annual growth rate (CAGR) of 4.22% from 2025 to 2033. This expansion is fueled by several key factors. Firstly, the burgeoning construction industry, particularly in residential and commercial sectors, significantly boosts demand for countertops. Secondly, the increasing preference for aesthetically pleasing and durable materials, like quartz and granite, is a major driver. Consumers are increasingly willing to invest in high-quality countertops to enhance their kitchen and bathroom spaces, reflecting a shift towards premium home improvement trends. Furthermore, technological advancements in countertop manufacturing, leading to improved durability, ease of maintenance, and a wider array of designs, contribute to market growth. The market is segmented by material (granite, solid surface, laminate, marble, quartz surfaces, and others), end-user (residential and commercial), and type (kitchen, bathroom, and others). The residential sector currently dominates, but commercial applications are exhibiting faster growth, driven by the hospitality and retail industries' focus on upgrading spaces. Key players like Cosentino, AKG Group, and Cambria are leveraging innovation and brand recognition to maintain their market share.
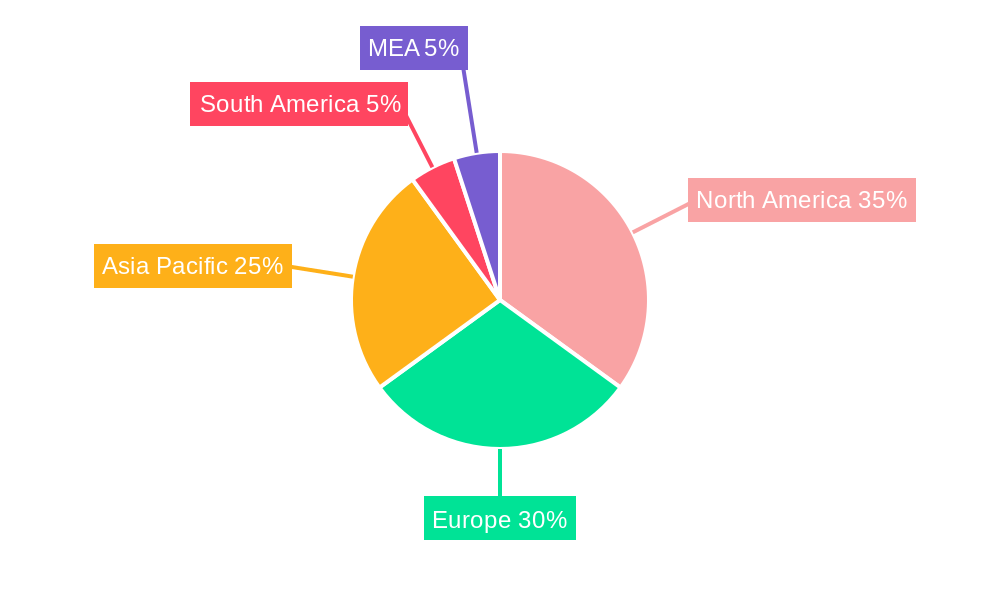
Geographical distribution reveals strong regional variations. North America and Europe currently hold substantial market share, reflecting higher disposable incomes and established construction sectors. However, the Asia-Pacific region is poised for significant growth due to rapid urbanization and rising middle-class spending. This region's expanding construction industry, particularly in countries like China and India, offers substantial opportunities for countertop manufacturers. While the market faces certain restraints like price fluctuations of raw materials and potential supply chain disruptions, the overall outlook remains positive, with continuous innovation and expanding applications predicted to propel growth over the forecast period. The market's segmentation offers opportunities for specialized manufacturers to cater to niche preferences.
Countertop Industry Market Report: 2019-2033
This comprehensive report provides a detailed analysis of the countertop industry, encompassing market dynamics, growth trends, regional segmentation, product landscape, key players, and future outlook. With a focus on key market segments – including Granite, Quartz Surfaces, Laminate, Marble, and Solid Surface – and end-users like Residential and Commercial sectors, this report offers invaluable insights for industry professionals, investors, and strategic decision-makers. The study period spans from 2019 to 2033, with 2025 as the base and estimated year.
Countertop Industry Market Dynamics & Structure
The countertop industry is characterized by moderate market concentration, with key players like Cosentino S.A., Caesarstone Ltd., and Cambria holding significant market share (estimated at xx million units combined in 2025). Technological innovation, particularly in material science and manufacturing processes, is a crucial driver. Regulatory frameworks concerning material safety and environmental impact also significantly influence market dynamics. Competitive pressure from substitute materials (e.g., alternative surfacing solutions) necessitates continuous product differentiation and innovation. End-user demographics, especially the growth of new home construction and renovation projects, significantly impact demand. M&A activity in the industry is moderate, with xx deals recorded in the historical period (2019-2024), primarily focusing on expanding product portfolios and geographical reach.
- Market Concentration: Moderately concentrated, with top players holding xx% market share in 2025.
- Technological Innovation: Focus on sustainable materials, improved durability, and design aesthetics.
- Regulatory Frameworks: Compliance with safety and environmental standards influences material choices and manufacturing processes.
- Competitive Substitutes: Pressure from alternative materials like engineered wood and tiles requires continuous product innovation.
- End-User Demographics: Growth in residential and commercial construction drives market expansion.
- M&A Trends: Moderate activity, focusing on portfolio diversification and geographical expansion (xx deals from 2019-2024).
Countertop Industry Growth Trends & Insights
The global countertop market exhibits consistent growth, driven by increasing urbanization, rising disposable incomes, and a preference for aesthetically pleasing and durable kitchen and bathroom designs. The market size is projected to reach xx million units by 2025, registering a Compound Annual Growth Rate (CAGR) of xx% during the forecast period (2025-2033). Technological disruptions, such as the introduction of new materials and manufacturing techniques, significantly impact adoption rates. Consumer behavior shifts toward eco-friendly and sustainable options are influencing product development and marketing strategies. Market penetration rates for specific materials like quartz surfaces continue to increase, reflecting their popularity in residential and commercial settings.
(Note: XXX data source needs to be replaced with actual data source here for this section)
Dominant Regions, Countries, or Segments in Countertop Industry
North America and Europe currently dominate the global countertop market, driven by high construction activity and consumer preference for premium materials. Within these regions, the residential segment remains the most significant end-user, with the kitchen accounting for the largest share of installations. Quartz surfaces and Granite hold the leading positions in the materials segment, benefiting from their durability, aesthetics, and versatility.
- Key Drivers: Strong construction activity, rising disposable incomes, and a preference for premium kitchen and bathroom renovations.
- North America: High market share due to significant new construction and renovation activity.
- Europe: Strong demand for premium materials and established infrastructure.
- Quartz Surfaces: Leading material segment due to high demand for durability and aesthetics.
- Residential Segment: Remains the largest end-user, with kitchen applications accounting for a significant portion of demand.
Countertop Industry Product Landscape
The countertop industry displays a diverse product landscape characterized by continuous innovation in materials, designs, and finishes. Products range from traditional materials like granite and marble to engineered surfaces like quartz and solid surface, each offering unique selling propositions in terms of durability, aesthetics, and cost-effectiveness. Technological advancements, like improved manufacturing processes and surface treatments, enhance the performance and longevity of countertops, offering enhanced hygiene, stain resistance, and heat resistance.
Key Drivers, Barriers & Challenges in Countertop Industry
Key Drivers:
- Rising disposable incomes and increased spending on home renovations.
- Growing urbanization and new housing construction.
- Technological advancements leading to innovative materials and designs.
- Increasing consumer awareness of hygiene and sanitation.
Key Challenges:
- Fluctuations in raw material prices (e.g., granite, quartz).
- Supply chain disruptions impacting manufacturing and delivery timelines.
- Intense competition from alternative surfacing materials.
- Regulatory compliance and environmental concerns regarding material sourcing and manufacturing.
Emerging Opportunities in Countertop Industry
Emerging opportunities lie in sustainable materials, smart countertop technology, and personalized design options. Untapped markets in developing economies present significant potential. The integration of technology, such as integrated lighting or charging capabilities, could create new value propositions. Consumer demand for unique and customizable designs will drive growth in the bespoke countertop segment.
Growth Accelerators in the Countertop Industry Industry
Technological breakthroughs in material science and manufacturing processes will significantly accelerate market growth. Strategic partnerships between manufacturers and designers will promote innovation and market expansion. The adoption of sustainable manufacturing practices and the use of recycled or renewable materials will enhance the industry's appeal to environmentally conscious consumers. Expansion into new geographical markets, particularly in rapidly developing economies, presents significant growth potential.
Key Players Shaping the Countertop Industry Market
- Cosentino S.A.
- AKG Group
- Vicostone
- Cambria
- Masco Corporation
- ROSSKOPF + PARTNER AG
- DuPont de Nemours Inc
- ARISTECH SURFACES LLC
- STRASSER Steine GmbH
- Caesarstone Ltd
- Daltile
- Wilsonart LLC
- Asian Granito India Limited
- Pokarna Ltd
- Aro Granite Industries Ltd
Notable Milestones in Countertop Industry Sector
- August 2022: Wilsonart LLC wins KBB Readers' Choice Award for top kitchen countertop brand (second consecutive year).
- February 2022: Caesarstone Ltd. launches eight new nature-inspired surfaces at KBIS.
- January 2022: Cambria introduces four new colors to its quartz countertop collection.
In-Depth Countertop Industry Market Outlook
The future of the countertop industry is bright, driven by consistent demand for durable and aesthetically pleasing surfaces in residential and commercial settings. Technological innovation, sustainable practices, and strategic market expansion will shape the industry's trajectory. Opportunities abound in emerging markets, specialized applications, and the integration of smart technologies into countertop designs. The continued growth of the construction sector and the increasing focus on home improvement will further fuel market expansion in the coming years.
Countertop Industry Segmentation
-
1. Material
- 1.1. Granite
- 1.2. Solid Surface
- 1.3. Laminate
- 1.4. Marble
- 1.5. Quartz Surfaces
- 1.6. Other Materials
-
2. End User
- 2.1. Residential
- 2.2. Commercial
-
3. Type
- 3.1. Kitchen
- 3.2. Bathroom
- 3.3. Other Types
Countertop Industry Segmentation By Geography
- 1. North America
- 2. Europe
- 3. Asia Pacific
- 4. Latin America
- 5. Middle East and Africa
Countertop Industry REPORT HIGHLIGHTS
| Aspects | Details |
|---|---|
| Study Period | 2019-2033 |
| Base Year | 2024 |
| Estimated Year | 2025 |
| Forecast Period | 2025-2033 |
| Historical Period | 2019-2024 |
| Growth Rate | CAGR of 4.22% from 2019-2033 |
| Segmentation |
|
Table of Contents
- 1. Introduction
- 1.1. Research Scope
- 1.2. Market Segmentation
- 1.3. Research Methodology
- 1.4. Definitions and Assumptions
- 2. Executive Summary
- 2.1. Introduction
- 3. Market Dynamics
- 3.1. Introduction
- 3.2. Market Drivers
- 3.2.1. Safety and Security of Documents Drives the Market Growth; Facility Of Large Storage Space Drives the Market Growth
- 3.3. Market Restrains
- 3.3.1. Complex Registration Restrictions; Poor Resistance To Water And Chemical Damage
- 3.4. Market Trends
- 3.4.1. Granite is the Most Popular Choice for Countertops
- 4. Market Factor Analysis
- 4.1. Porters Five Forces
- 4.2. Supply/Value Chain
- 4.3. PESTEL analysis
- 4.4. Market Entropy
- 4.5. Patent/Trademark Analysis
- 5. Global Countertop Industry Analysis, Insights and Forecast, 2019-2031
- 5.1. Market Analysis, Insights and Forecast - by Material
- 5.1.1. Granite
- 5.1.2. Solid Surface
- 5.1.3. Laminate
- 5.1.4. Marble
- 5.1.5. Quartz Surfaces
- 5.1.6. Other Materials
- 5.2. Market Analysis, Insights and Forecast - by End User
- 5.2.1. Residential
- 5.2.2. Commercial
- 5.3. Market Analysis, Insights and Forecast - by Type
- 5.3.1. Kitchen
- 5.3.2. Bathroom
- 5.3.3. Other Types
- 5.4. Market Analysis, Insights and Forecast - by Region
- 5.4.1. North America
- 5.4.2. Europe
- 5.4.3. Asia Pacific
- 5.4.4. Latin America
- 5.4.5. Middle East and Africa
- 5.1. Market Analysis, Insights and Forecast - by Material
- 6. North America Countertop Industry Analysis, Insights and Forecast, 2019-2031
- 6.1. Market Analysis, Insights and Forecast - by Material
- 6.1.1. Granite
- 6.1.2. Solid Surface
- 6.1.3. Laminate
- 6.1.4. Marble
- 6.1.5. Quartz Surfaces
- 6.1.6. Other Materials
- 6.2. Market Analysis, Insights and Forecast - by End User
- 6.2.1. Residential
- 6.2.2. Commercial
- 6.3. Market Analysis, Insights and Forecast - by Type
- 6.3.1. Kitchen
- 6.3.2. Bathroom
- 6.3.3. Other Types
- 6.1. Market Analysis, Insights and Forecast - by Material
- 7. Europe Countertop Industry Analysis, Insights and Forecast, 2019-2031
- 7.1. Market Analysis, Insights and Forecast - by Material
- 7.1.1. Granite
- 7.1.2. Solid Surface
- 7.1.3. Laminate
- 7.1.4. Marble
- 7.1.5. Quartz Surfaces
- 7.1.6. Other Materials
- 7.2. Market Analysis, Insights and Forecast - by End User
- 7.2.1. Residential
- 7.2.2. Commercial
- 7.3. Market Analysis, Insights and Forecast - by Type
- 7.3.1. Kitchen
- 7.3.2. Bathroom
- 7.3.3. Other Types
- 7.1. Market Analysis, Insights and Forecast - by Material
- 8. Asia Pacific Countertop Industry Analysis, Insights and Forecast, 2019-2031
- 8.1. Market Analysis, Insights and Forecast - by Material
- 8.1.1. Granite
- 8.1.2. Solid Surface
- 8.1.3. Laminate
- 8.1.4. Marble
- 8.1.5. Quartz Surfaces
- 8.1.6. Other Materials
- 8.2. Market Analysis, Insights and Forecast - by End User
- 8.2.1. Residential
- 8.2.2. Commercial
- 8.3. Market Analysis, Insights and Forecast - by Type
- 8.3.1. Kitchen
- 8.3.2. Bathroom
- 8.3.3. Other Types
- 8.1. Market Analysis, Insights and Forecast - by Material
- 9. Latin America Countertop Industry Analysis, Insights and Forecast, 2019-2031
- 9.1. Market Analysis, Insights and Forecast - by Material
- 9.1.1. Granite
- 9.1.2. Solid Surface
- 9.1.3. Laminate
- 9.1.4. Marble
- 9.1.5. Quartz Surfaces
- 9.1.6. Other Materials
- 9.2. Market Analysis, Insights and Forecast - by End User
- 9.2.1. Residential
- 9.2.2. Commercial
- 9.3. Market Analysis, Insights and Forecast - by Type
- 9.3.1. Kitchen
- 9.3.2. Bathroom
- 9.3.3. Other Types
- 9.1. Market Analysis, Insights and Forecast - by Material
- 10. Middle East and Africa Countertop Industry Analysis, Insights and Forecast, 2019-2031
- 10.1. Market Analysis, Insights and Forecast - by Material
- 10.1.1. Granite
- 10.1.2. Solid Surface
- 10.1.3. Laminate
- 10.1.4. Marble
- 10.1.5. Quartz Surfaces
- 10.1.6. Other Materials
- 10.2. Market Analysis, Insights and Forecast - by End User
- 10.2.1. Residential
- 10.2.2. Commercial
- 10.3. Market Analysis, Insights and Forecast - by Type
- 10.3.1. Kitchen
- 10.3.2. Bathroom
- 10.3.3. Other Types
- 10.1. Market Analysis, Insights and Forecast - by Material
- 11. North America Countertop Industry Analysis, Insights and Forecast, 2019-2031
- 11.1. Market Analysis, Insights and Forecast - By Country/Sub-region
- 11.1.1 United States
- 11.1.2 Canada
- 11.1.3 Mexico
- 12. Europe Countertop Industry Analysis, Insights and Forecast, 2019-2031
- 12.1. Market Analysis, Insights and Forecast - By Country/Sub-region
- 12.1.1 Germany
- 12.1.2 United Kingdom
- 12.1.3 France
- 12.1.4 Spain
- 12.1.5 Italy
- 12.1.6 Spain
- 12.1.7 Belgium
- 12.1.8 Netherland
- 12.1.9 Nordics
- 12.1.10 Rest of Europe
- 13. Asia Pacific Countertop Industry Analysis, Insights and Forecast, 2019-2031
- 13.1. Market Analysis, Insights and Forecast - By Country/Sub-region
- 13.1.1 China
- 13.1.2 Japan
- 13.1.3 India
- 13.1.4 South Korea
- 13.1.5 Southeast Asia
- 13.1.6 Australia
- 13.1.7 Indonesia
- 13.1.8 Phillipes
- 13.1.9 Singapore
- 13.1.10 Thailandc
- 13.1.11 Rest of Asia Pacific
- 14. South America Countertop Industry Analysis, Insights and Forecast, 2019-2031
- 14.1. Market Analysis, Insights and Forecast - By Country/Sub-region
- 14.1.1 Brazil
- 14.1.2 Argentina
- 14.1.3 Peru
- 14.1.4 Chile
- 14.1.5 Colombia
- 14.1.6 Ecuador
- 14.1.7 Venezuela
- 14.1.8 Rest of South America
- 15. MEA Countertop Industry Analysis, Insights and Forecast, 2019-2031
- 15.1. Market Analysis, Insights and Forecast - By Country/Sub-region
- 15.1.1 United Arab Emirates
- 15.1.2 Saudi Arabia
- 15.1.3 South Africa
- 15.1.4 Rest of Middle East and Africa
- 16. Competitive Analysis
- 16.1. Global Market Share Analysis 2024
- 16.2. Company Profiles
- 16.2.1 Cosentino S A
- 16.2.1.1. Overview
- 16.2.1.2. Products
- 16.2.1.3. SWOT Analysis
- 16.2.1.4. Recent Developments
- 16.2.1.5. Financials (Based on Availability)
- 16.2.2 AKG Group
- 16.2.2.1. Overview
- 16.2.2.2. Products
- 16.2.2.3. SWOT Analysis
- 16.2.2.4. Recent Developments
- 16.2.2.5. Financials (Based on Availability)
- 16.2.3 Vicostone
- 16.2.3.1. Overview
- 16.2.3.2. Products
- 16.2.3.3. SWOT Analysis
- 16.2.3.4. Recent Developments
- 16.2.3.5. Financials (Based on Availability)
- 16.2.4 Cambria
- 16.2.4.1. Overview
- 16.2.4.2. Products
- 16.2.4.3. SWOT Analysis
- 16.2.4.4. Recent Developments
- 16.2.4.5. Financials (Based on Availability)
- 16.2.5 Masco Corporation
- 16.2.5.1. Overview
- 16.2.5.2. Products
- 16.2.5.3. SWOT Analysis
- 16.2.5.4. Recent Developments
- 16.2.5.5. Financials (Based on Availability)
- 16.2.6 ROSSKOPF + PARTNER AG
- 16.2.6.1. Overview
- 16.2.6.2. Products
- 16.2.6.3. SWOT Analysis
- 16.2.6.4. Recent Developments
- 16.2.6.5. Financials (Based on Availability)
- 16.2.7 DuPont de Nemours Inc
- 16.2.7.1. Overview
- 16.2.7.2. Products
- 16.2.7.3. SWOT Analysis
- 16.2.7.4. Recent Developments
- 16.2.7.5. Financials (Based on Availability)
- 16.2.8 ARISTECH SURFACES LLC
- 16.2.8.1. Overview
- 16.2.8.2. Products
- 16.2.8.3. SWOT Analysis
- 16.2.8.4. Recent Developments
- 16.2.8.5. Financials (Based on Availability)
- 16.2.9 STRASSER Steine GmbH
- 16.2.9.1. Overview
- 16.2.9.2. Products
- 16.2.9.3. SWOT Analysis
- 16.2.9.4. Recent Developments
- 16.2.9.5. Financials (Based on Availability)
- 16.2.10 Caesarstone Ltd
- 16.2.10.1. Overview
- 16.2.10.2. Products
- 16.2.10.3. SWOT Analysis
- 16.2.10.4. Recent Developments
- 16.2.10.5. Financials (Based on Availability)
- 16.2.11 Daltile
- 16.2.11.1. Overview
- 16.2.11.2. Products
- 16.2.11.3. SWOT Analysis
- 16.2.11.4. Recent Developments
- 16.2.11.5. Financials (Based on Availability)
- 16.2.12 Wilsonart LLC
- 16.2.12.1. Overview
- 16.2.12.2. Products
- 16.2.12.3. SWOT Analysis
- 16.2.12.4. Recent Developments
- 16.2.12.5. Financials (Based on Availability)
- 16.2.13 Asian Granito India Limited
- 16.2.13.1. Overview
- 16.2.13.2. Products
- 16.2.13.3. SWOT Analysis
- 16.2.13.4. Recent Developments
- 16.2.13.5. Financials (Based on Availability)
- 16.2.14 Pokarna Ltd
- 16.2.14.1. Overview
- 16.2.14.2. Products
- 16.2.14.3. SWOT Analysis
- 16.2.14.4. Recent Developments
- 16.2.14.5. Financials (Based on Availability)
- 16.2.15 Aro Granite Industries Ltd
- 16.2.15.1. Overview
- 16.2.15.2. Products
- 16.2.15.3. SWOT Analysis
- 16.2.15.4. Recent Developments
- 16.2.15.5. Financials (Based on Availability)
- 16.2.1 Cosentino S A
List of Figures
- Figure 1: Global Countertop Industry Revenue Breakdown (Million, %) by Region 2024 & 2032
- Figure 2: Global Countertop Industry Volume Breakdown (K Unit, %) by Region 2024 & 2032
- Figure 3: North America Countertop Industry Revenue (Million), by Country 2024 & 2032
- Figure 4: North America Countertop Industry Volume (K Unit), by Country 2024 & 2032
- Figure 5: North America Countertop Industry Revenue Share (%), by Country 2024 & 2032
- Figure 6: North America Countertop Industry Volume Share (%), by Country 2024 & 2032
- Figure 7: Europe Countertop Industry Revenue (Million), by Country 2024 & 2032
- Figure 8: Europe Countertop Industry Volume (K Unit), by Country 2024 & 2032
- Figure 9: Europe Countertop Industry Revenue Share (%), by Country 2024 & 2032
- Figure 10: Europe Countertop Industry Volume Share (%), by Country 2024 & 2032
- Figure 11: Asia Pacific Countertop Industry Revenue (Million), by Country 2024 & 2032
- Figure 12: Asia Pacific Countertop Industry Volume (K Unit), by Country 2024 & 2032
- Figure 13: Asia Pacific Countertop Industry Revenue Share (%), by Country 2024 & 2032
- Figure 14: Asia Pacific Countertop Industry Volume Share (%), by Country 2024 & 2032
- Figure 15: South America Countertop Industry Revenue (Million), by Country 2024 & 2032
- Figure 16: South America Countertop Industry Volume (K Unit), by Country 2024 & 2032
- Figure 17: South America Countertop Industry Revenue Share (%), by Country 2024 & 2032
- Figure 18: South America Countertop Industry Volume Share (%), by Country 2024 & 2032
- Figure 19: MEA Countertop Industry Revenue (Million), by Country 2024 & 2032
- Figure 20: MEA Countertop Industry Volume (K Unit), by Country 2024 & 2032
- Figure 21: MEA Countertop Industry Revenue Share (%), by Country 2024 & 2032
- Figure 22: MEA Countertop Industry Volume Share (%), by Country 2024 & 2032
- Figure 23: North America Countertop Industry Revenue (Million), by Material 2024 & 2032
- Figure 24: North America Countertop Industry Volume (K Unit), by Material 2024 & 2032
- Figure 25: North America Countertop Industry Revenue Share (%), by Material 2024 & 2032
- Figure 26: North America Countertop Industry Volume Share (%), by Material 2024 & 2032
- Figure 27: North America Countertop Industry Revenue (Million), by End User 2024 & 2032
- Figure 28: North America Countertop Industry Volume (K Unit), by End User 2024 & 2032
- Figure 29: North America Countertop Industry Revenue Share (%), by End User 2024 & 2032
- Figure 30: North America Countertop Industry Volume Share (%), by End User 2024 & 2032
- Figure 31: North America Countertop Industry Revenue (Million), by Type 2024 & 2032
- Figure 32: North America Countertop Industry Volume (K Unit), by Type 2024 & 2032
- Figure 33: North America Countertop Industry Revenue Share (%), by Type 2024 & 2032
- Figure 34: North America Countertop Industry Volume Share (%), by Type 2024 & 2032
- Figure 35: North America Countertop Industry Revenue (Million), by Country 2024 & 2032
- Figure 36: North America Countertop Industry Volume (K Unit), by Country 2024 & 2032
- Figure 37: North America Countertop Industry Revenue Share (%), by Country 2024 & 2032
- Figure 38: North America Countertop Industry Volume Share (%), by Country 2024 & 2032
- Figure 39: Europe Countertop Industry Revenue (Million), by Material 2024 & 2032
- Figure 40: Europe Countertop Industry Volume (K Unit), by Material 2024 & 2032
- Figure 41: Europe Countertop Industry Revenue Share (%), by Material 2024 & 2032
- Figure 42: Europe Countertop Industry Volume Share (%), by Material 2024 & 2032
- Figure 43: Europe Countertop Industry Revenue (Million), by End User 2024 & 2032
- Figure 44: Europe Countertop Industry Volume (K Unit), by End User 2024 & 2032
- Figure 45: Europe Countertop Industry Revenue Share (%), by End User 2024 & 2032
- Figure 46: Europe Countertop Industry Volume Share (%), by End User 2024 & 2032
- Figure 47: Europe Countertop Industry Revenue (Million), by Type 2024 & 2032
- Figure 48: Europe Countertop Industry Volume (K Unit), by Type 2024 & 2032
- Figure 49: Europe Countertop Industry Revenue Share (%), by Type 2024 & 2032
- Figure 50: Europe Countertop Industry Volume Share (%), by Type 2024 & 2032
- Figure 51: Europe Countertop Industry Revenue (Million), by Country 2024 & 2032
- Figure 52: Europe Countertop Industry Volume (K Unit), by Country 2024 & 2032
- Figure 53: Europe Countertop Industry Revenue Share (%), by Country 2024 & 2032
- Figure 54: Europe Countertop Industry Volume Share (%), by Country 2024 & 2032
- Figure 55: Asia Pacific Countertop Industry Revenue (Million), by Material 2024 & 2032
- Figure 56: Asia Pacific Countertop Industry Volume (K Unit), by Material 2024 & 2032
- Figure 57: Asia Pacific Countertop Industry Revenue Share (%), by Material 2024 & 2032
- Figure 58: Asia Pacific Countertop Industry Volume Share (%), by Material 2024 & 2032
- Figure 59: Asia Pacific Countertop Industry Revenue (Million), by End User 2024 & 2032
- Figure 60: Asia Pacific Countertop Industry Volume (K Unit), by End User 2024 & 2032
- Figure 61: Asia Pacific Countertop Industry Revenue Share (%), by End User 2024 & 2032
- Figure 62: Asia Pacific Countertop Industry Volume Share (%), by End User 2024 & 2032
- Figure 63: Asia Pacific Countertop Industry Revenue (Million), by Type 2024 & 2032
- Figure 64: Asia Pacific Countertop Industry Volume (K Unit), by Type 2024 & 2032
- Figure 65: Asia Pacific Countertop Industry Revenue Share (%), by Type 2024 & 2032
- Figure 66: Asia Pacific Countertop Industry Volume Share (%), by Type 2024 & 2032
- Figure 67: Asia Pacific Countertop Industry Revenue (Million), by Country 2024 & 2032
- Figure 68: Asia Pacific Countertop Industry Volume (K Unit), by Country 2024 & 2032
- Figure 69: Asia Pacific Countertop Industry Revenue Share (%), by Country 2024 & 2032
- Figure 70: Asia Pacific Countertop Industry Volume Share (%), by Country 2024 & 2032
- Figure 71: Latin America Countertop Industry Revenue (Million), by Material 2024 & 2032
- Figure 72: Latin America Countertop Industry Volume (K Unit), by Material 2024 & 2032
- Figure 73: Latin America Countertop Industry Revenue Share (%), by Material 2024 & 2032
- Figure 74: Latin America Countertop Industry Volume Share (%), by Material 2024 & 2032
- Figure 75: Latin America Countertop Industry Revenue (Million), by End User 2024 & 2032
- Figure 76: Latin America Countertop Industry Volume (K Unit), by End User 2024 & 2032
- Figure 77: Latin America Countertop Industry Revenue Share (%), by End User 2024 & 2032
- Figure 78: Latin America Countertop Industry Volume Share (%), by End User 2024 & 2032
- Figure 79: Latin America Countertop Industry Revenue (Million), by Type 2024 & 2032
- Figure 80: Latin America Countertop Industry Volume (K Unit), by Type 2024 & 2032
- Figure 81: Latin America Countertop Industry Revenue Share (%), by Type 2024 & 2032
- Figure 82: Latin America Countertop Industry Volume Share (%), by Type 2024 & 2032
- Figure 83: Latin America Countertop Industry Revenue (Million), by Country 2024 & 2032
- Figure 84: Latin America Countertop Industry Volume (K Unit), by Country 2024 & 2032
- Figure 85: Latin America Countertop Industry Revenue Share (%), by Country 2024 & 2032
- Figure 86: Latin America Countertop Industry Volume Share (%), by Country 2024 & 2032
- Figure 87: Middle East and Africa Countertop Industry Revenue (Million), by Material 2024 & 2032
- Figure 88: Middle East and Africa Countertop Industry Volume (K Unit), by Material 2024 & 2032
- Figure 89: Middle East and Africa Countertop Industry Revenue Share (%), by Material 2024 & 2032
- Figure 90: Middle East and Africa Countertop Industry Volume Share (%), by Material 2024 & 2032
- Figure 91: Middle East and Africa Countertop Industry Revenue (Million), by End User 2024 & 2032
- Figure 92: Middle East and Africa Countertop Industry Volume (K Unit), by End User 2024 & 2032
- Figure 93: Middle East and Africa Countertop Industry Revenue Share (%), by End User 2024 & 2032
- Figure 94: Middle East and Africa Countertop Industry Volume Share (%), by End User 2024 & 2032
- Figure 95: Middle East and Africa Countertop Industry Revenue (Million), by Type 2024 & 2032
- Figure 96: Middle East and Africa Countertop Industry Volume (K Unit), by Type 2024 & 2032
- Figure 97: Middle East and Africa Countertop Industry Revenue Share (%), by Type 2024 & 2032
- Figure 98: Middle East and Africa Countertop Industry Volume Share (%), by Type 2024 & 2032
- Figure 99: Middle East and Africa Countertop Industry Revenue (Million), by Country 2024 & 2032
- Figure 100: Middle East and Africa Countertop Industry Volume (K Unit), by Country 2024 & 2032
- Figure 101: Middle East and Africa Countertop Industry Revenue Share (%), by Country 2024 & 2032
- Figure 102: Middle East and Africa Countertop Industry Volume Share (%), by Country 2024 & 2032
List of Tables
- Table 1: Global Countertop Industry Revenue Million Forecast, by Region 2019 & 2032
- Table 2: Global Countertop Industry Volume K Unit Forecast, by Region 2019 & 2032
- Table 3: Global Countertop Industry Revenue Million Forecast, by Material 2019 & 2032
- Table 4: Global Countertop Industry Volume K Unit Forecast, by Material 2019 & 2032
- Table 5: Global Countertop Industry Revenue Million Forecast, by End User 2019 & 2032
- Table 6: Global Countertop Industry Volume K Unit Forecast, by End User 2019 & 2032
- Table 7: Global Countertop Industry Revenue Million Forecast, by Type 2019 & 2032
- Table 8: Global Countertop Industry Volume K Unit Forecast, by Type 2019 & 2032
- Table 9: Global Countertop Industry Revenue Million Forecast, by Region 2019 & 2032
- Table 10: Global Countertop Industry Volume K Unit Forecast, by Region 2019 & 2032
- Table 11: Global Countertop Industry Revenue Million Forecast, by Country 2019 & 2032
- Table 12: Global Countertop Industry Volume K Unit Forecast, by Country 2019 & 2032
- Table 13: United States Countertop Industry Revenue (Million) Forecast, by Application 2019 & 2032
- Table 14: United States Countertop Industry Volume (K Unit) Forecast, by Application 2019 & 2032
- Table 15: Canada Countertop Industry Revenue (Million) Forecast, by Application 2019 & 2032
- Table 16: Canada Countertop Industry Volume (K Unit) Forecast, by Application 2019 & 2032
- Table 17: Mexico Countertop Industry Revenue (Million) Forecast, by Application 2019 & 2032
- Table 18: Mexico Countertop Industry Volume (K Unit) Forecast, by Application 2019 & 2032
- Table 19: Global Countertop Industry Revenue Million Forecast, by Country 2019 & 2032
- Table 20: Global Countertop Industry Volume K Unit Forecast, by Country 2019 & 2032
- Table 21: Germany Countertop Industry Revenue (Million) Forecast, by Application 2019 & 2032
- Table 22: Germany Countertop Industry Volume (K Unit) Forecast, by Application 2019 & 2032
- Table 23: United Kingdom Countertop Industry Revenue (Million) Forecast, by Application 2019 & 2032
- Table 24: United Kingdom Countertop Industry Volume (K Unit) Forecast, by Application 2019 & 2032
- Table 25: France Countertop Industry Revenue (Million) Forecast, by Application 2019 & 2032
- Table 26: France Countertop Industry Volume (K Unit) Forecast, by Application 2019 & 2032
- Table 27: Spain Countertop Industry Revenue (Million) Forecast, by Application 2019 & 2032
- Table 28: Spain Countertop Industry Volume (K Unit) Forecast, by Application 2019 & 2032
- Table 29: Italy Countertop Industry Revenue (Million) Forecast, by Application 2019 & 2032
- Table 30: Italy Countertop Industry Volume (K Unit) Forecast, by Application 2019 & 2032
- Table 31: Spain Countertop Industry Revenue (Million) Forecast, by Application 2019 & 2032
- Table 32: Spain Countertop Industry Volume (K Unit) Forecast, by Application 2019 & 2032
- Table 33: Belgium Countertop Industry Revenue (Million) Forecast, by Application 2019 & 2032
- Table 34: Belgium Countertop Industry Volume (K Unit) Forecast, by Application 2019 & 2032
- Table 35: Netherland Countertop Industry Revenue (Million) Forecast, by Application 2019 & 2032
- Table 36: Netherland Countertop Industry Volume (K Unit) Forecast, by Application 2019 & 2032
- Table 37: Nordics Countertop Industry Revenue (Million) Forecast, by Application 2019 & 2032
- Table 38: Nordics Countertop Industry Volume (K Unit) Forecast, by Application 2019 & 2032
- Table 39: Rest of Europe Countertop Industry Revenue (Million) Forecast, by Application 2019 & 2032
- Table 40: Rest of Europe Countertop Industry Volume (K Unit) Forecast, by Application 2019 & 2032
- Table 41: Global Countertop Industry Revenue Million Forecast, by Country 2019 & 2032
- Table 42: Global Countertop Industry Volume K Unit Forecast, by Country 2019 & 2032
- Table 43: China Countertop Industry Revenue (Million) Forecast, by Application 2019 & 2032
- Table 44: China Countertop Industry Volume (K Unit) Forecast, by Application 2019 & 2032
- Table 45: Japan Countertop Industry Revenue (Million) Forecast, by Application 2019 & 2032
- Table 46: Japan Countertop Industry Volume (K Unit) Forecast, by Application 2019 & 2032
- Table 47: India Countertop Industry Revenue (Million) Forecast, by Application 2019 & 2032
- Table 48: India Countertop Industry Volume (K Unit) Forecast, by Application 2019 & 2032
- Table 49: South Korea Countertop Industry Revenue (Million) Forecast, by Application 2019 & 2032
- Table 50: South Korea Countertop Industry Volume (K Unit) Forecast, by Application 2019 & 2032
- Table 51: Southeast Asia Countertop Industry Revenue (Million) Forecast, by Application 2019 & 2032
- Table 52: Southeast Asia Countertop Industry Volume (K Unit) Forecast, by Application 2019 & 2032
- Table 53: Australia Countertop Industry Revenue (Million) Forecast, by Application 2019 & 2032
- Table 54: Australia Countertop Industry Volume (K Unit) Forecast, by Application 2019 & 2032
- Table 55: Indonesia Countertop Industry Revenue (Million) Forecast, by Application 2019 & 2032
- Table 56: Indonesia Countertop Industry Volume (K Unit) Forecast, by Application 2019 & 2032
- Table 57: Phillipes Countertop Industry Revenue (Million) Forecast, by Application 2019 & 2032
- Table 58: Phillipes Countertop Industry Volume (K Unit) Forecast, by Application 2019 & 2032
- Table 59: Singapore Countertop Industry Revenue (Million) Forecast, by Application 2019 & 2032
- Table 60: Singapore Countertop Industry Volume (K Unit) Forecast, by Application 2019 & 2032
- Table 61: Thailandc Countertop Industry Revenue (Million) Forecast, by Application 2019 & 2032
- Table 62: Thailandc Countertop Industry Volume (K Unit) Forecast, by Application 2019 & 2032
- Table 63: Rest of Asia Pacific Countertop Industry Revenue (Million) Forecast, by Application 2019 & 2032
- Table 64: Rest of Asia Pacific Countertop Industry Volume (K Unit) Forecast, by Application 2019 & 2032
- Table 65: Global Countertop Industry Revenue Million Forecast, by Country 2019 & 2032
- Table 66: Global Countertop Industry Volume K Unit Forecast, by Country 2019 & 2032
- Table 67: Brazil Countertop Industry Revenue (Million) Forecast, by Application 2019 & 2032
- Table 68: Brazil Countertop Industry Volume (K Unit) Forecast, by Application 2019 & 2032
- Table 69: Argentina Countertop Industry Revenue (Million) Forecast, by Application 2019 & 2032
- Table 70: Argentina Countertop Industry Volume (K Unit) Forecast, by Application 2019 & 2032
- Table 71: Peru Countertop Industry Revenue (Million) Forecast, by Application 2019 & 2032
- Table 72: Peru Countertop Industry Volume (K Unit) Forecast, by Application 2019 & 2032
- Table 73: Chile Countertop Industry Revenue (Million) Forecast, by Application 2019 & 2032
- Table 74: Chile Countertop Industry Volume (K Unit) Forecast, by Application 2019 & 2032
- Table 75: Colombia Countertop Industry Revenue (Million) Forecast, by Application 2019 & 2032
- Table 76: Colombia Countertop Industry Volume (K Unit) Forecast, by Application 2019 & 2032
- Table 77: Ecuador Countertop Industry Revenue (Million) Forecast, by Application 2019 & 2032
- Table 78: Ecuador Countertop Industry Volume (K Unit) Forecast, by Application 2019 & 2032
- Table 79: Venezuela Countertop Industry Revenue (Million) Forecast, by Application 2019 & 2032
- Table 80: Venezuela Countertop Industry Volume (K Unit) Forecast, by Application 2019 & 2032
- Table 81: Rest of South America Countertop Industry Revenue (Million) Forecast, by Application 2019 & 2032
- Table 82: Rest of South America Countertop Industry Volume (K Unit) Forecast, by Application 2019 & 2032
- Table 83: Global Countertop Industry Revenue Million Forecast, by Country 2019 & 2032
- Table 84: Global Countertop Industry Volume K Unit Forecast, by Country 2019 & 2032
- Table 85: United Arab Emirates Countertop Industry Revenue (Million) Forecast, by Application 2019 & 2032
- Table 86: United Arab Emirates Countertop Industry Volume (K Unit) Forecast, by Application 2019 & 2032
- Table 87: Saudi Arabia Countertop Industry Revenue (Million) Forecast, by Application 2019 & 2032
- Table 88: Saudi Arabia Countertop Industry Volume (K Unit) Forecast, by Application 2019 & 2032
- Table 89: South Africa Countertop Industry Revenue (Million) Forecast, by Application 2019 & 2032
- Table 90: South Africa Countertop Industry Volume (K Unit) Forecast, by Application 2019 & 2032
- Table 91: Rest of Middle East and Africa Countertop Industry Revenue (Million) Forecast, by Application 2019 & 2032
- Table 92: Rest of Middle East and Africa Countertop Industry Volume (K Unit) Forecast, by Application 2019 & 2032
- Table 93: Global Countertop Industry Revenue Million Forecast, by Material 2019 & 2032
- Table 94: Global Countertop Industry Volume K Unit Forecast, by Material 2019 & 2032
- Table 95: Global Countertop Industry Revenue Million Forecast, by End User 2019 & 2032
- Table 96: Global Countertop Industry Volume K Unit Forecast, by End User 2019 & 2032
- Table 97: Global Countertop Industry Revenue Million Forecast, by Type 2019 & 2032
- Table 98: Global Countertop Industry Volume K Unit Forecast, by Type 2019 & 2032
- Table 99: Global Countertop Industry Revenue Million Forecast, by Country 2019 & 2032
- Table 100: Global Countertop Industry Volume K Unit Forecast, by Country 2019 & 2032
- Table 101: Global Countertop Industry Revenue Million Forecast, by Material 2019 & 2032
- Table 102: Global Countertop Industry Volume K Unit Forecast, by Material 2019 & 2032
- Table 103: Global Countertop Industry Revenue Million Forecast, by End User 2019 & 2032
- Table 104: Global Countertop Industry Volume K Unit Forecast, by End User 2019 & 2032
- Table 105: Global Countertop Industry Revenue Million Forecast, by Type 2019 & 2032
- Table 106: Global Countertop Industry Volume K Unit Forecast, by Type 2019 & 2032
- Table 107: Global Countertop Industry Revenue Million Forecast, by Country 2019 & 2032
- Table 108: Global Countertop Industry Volume K Unit Forecast, by Country 2019 & 2032
- Table 109: Global Countertop Industry Revenue Million Forecast, by Material 2019 & 2032
- Table 110: Global Countertop Industry Volume K Unit Forecast, by Material 2019 & 2032
- Table 111: Global Countertop Industry Revenue Million Forecast, by End User 2019 & 2032
- Table 112: Global Countertop Industry Volume K Unit Forecast, by End User 2019 & 2032
- Table 113: Global Countertop Industry Revenue Million Forecast, by Type 2019 & 2032
- Table 114: Global Countertop Industry Volume K Unit Forecast, by Type 2019 & 2032
- Table 115: Global Countertop Industry Revenue Million Forecast, by Country 2019 & 2032
- Table 116: Global Countertop Industry Volume K Unit Forecast, by Country 2019 & 2032
- Table 117: Global Countertop Industry Revenue Million Forecast, by Material 2019 & 2032
- Table 118: Global Countertop Industry Volume K Unit Forecast, by Material 2019 & 2032
- Table 119: Global Countertop Industry Revenue Million Forecast, by End User 2019 & 2032
- Table 120: Global Countertop Industry Volume K Unit Forecast, by End User 2019 & 2032
- Table 121: Global Countertop Industry Revenue Million Forecast, by Type 2019 & 2032
- Table 122: Global Countertop Industry Volume K Unit Forecast, by Type 2019 & 2032
- Table 123: Global Countertop Industry Revenue Million Forecast, by Country 2019 & 2032
- Table 124: Global Countertop Industry Volume K Unit Forecast, by Country 2019 & 2032
- Table 125: Global Countertop Industry Revenue Million Forecast, by Material 2019 & 2032
- Table 126: Global Countertop Industry Volume K Unit Forecast, by Material 2019 & 2032
- Table 127: Global Countertop Industry Revenue Million Forecast, by End User 2019 & 2032
- Table 128: Global Countertop Industry Volume K Unit Forecast, by End User 2019 & 2032
- Table 129: Global Countertop Industry Revenue Million Forecast, by Type 2019 & 2032
- Table 130: Global Countertop Industry Volume K Unit Forecast, by Type 2019 & 2032
- Table 131: Global Countertop Industry Revenue Million Forecast, by Country 2019 & 2032
- Table 132: Global Countertop Industry Volume K Unit Forecast, by Country 2019 & 2032
Frequently Asked Questions
1. What is the projected Compound Annual Growth Rate (CAGR) of the Countertop Industry?
The projected CAGR is approximately 4.22%.
2. Which companies are prominent players in the Countertop Industry?
Key companies in the market include Cosentino S A, AKG Group, Vicostone, Cambria, Masco Corporation, ROSSKOPF + PARTNER AG, DuPont de Nemours Inc, ARISTECH SURFACES LLC, STRASSER Steine GmbH, Caesarstone Ltd, Daltile, Wilsonart LLC, Asian Granito India Limited, Pokarna Ltd, Aro Granite Industries Ltd.
3. What are the main segments of the Countertop Industry?
The market segments include Material, End User, Type.
4. Can you provide details about the market size?
The market size is estimated to be USD 148.86 Million as of 2022.
5. What are some drivers contributing to market growth?
Safety and Security of Documents Drives the Market Growth; Facility Of Large Storage Space Drives the Market Growth.
6. What are the notable trends driving market growth?
Granite is the Most Popular Choice for Countertops.
7. Are there any restraints impacting market growth?
Complex Registration Restrictions; Poor Resistance To Water And Chemical Damage.
8. Can you provide examples of recent developments in the market?
In August 2022: Wilsonart LLC, a world-class innovator of engineered surfaces, was named a winner of Kitchen & Bath Business (KBB) magazine's 2022 Readers' Choice Awards. The company has been voted as the top kitchen countertop brand in the Readers' Choice Awards for the second consecutive year.
9. What pricing options are available for accessing the report?
Pricing options include single-user, multi-user, and enterprise licenses priced at USD 4750, USD 5250, and USD 8750 respectively.
10. Is the market size provided in terms of value or volume?
The market size is provided in terms of value, measured in Million and volume, measured in K Unit.
11. Are there any specific market keywords associated with the report?
Yes, the market keyword associated with the report is "Countertop Industry," which aids in identifying and referencing the specific market segment covered.
12. How do I determine which pricing option suits my needs best?
The pricing options vary based on user requirements and access needs. Individual users may opt for single-user licenses, while businesses requiring broader access may choose multi-user or enterprise licenses for cost-effective access to the report.
13. Are there any additional resources or data provided in the Countertop Industry report?
While the report offers comprehensive insights, it's advisable to review the specific contents or supplementary materials provided to ascertain if additional resources or data are available.
14. How can I stay updated on further developments or reports in the Countertop Industry?
To stay informed about further developments, trends, and reports in the Countertop Industry, consider subscribing to industry newsletters, following relevant companies and organizations, or regularly checking reputable industry news sources and publications.
Methodology
Step 1 - Identification of Relevant Samples Size from Population Database


Step 2 - Approaches for Defining Global Market Size (Value, Volume* & Price*)

Note*: In applicable scenarios
Step 3 - Data Sources
Primary Research
- Web Analytics
- Survey Reports
- Research Institute
- Latest Research Reports
- Opinion Leaders
Secondary Research
- Annual Reports
- White Paper
- Latest Press Release
- Industry Association
- Paid Database
- Investor Presentations

Step 4 - Data Triangulation
Involves using different sources of information in order to increase the validity of a study
These sources are likely to be stakeholders in a program - participants, other researchers, program staff, other community members, and so on.
Then we put all data in single framework & apply various statistical tools to find out the dynamic on the market.
During the analysis stage, feedback from the stakeholder groups would be compared to determine areas of agreement as well as areas of divergence


