

Key Insights
The global Cosmetic Antioxidants market is poised for robust growth, with an estimated market size of $139.23 million in 2025. This expansion is driven by a projected Compound Annual Growth Rate (CAGR) of 5.95% through the forecast period of 2025-2033. This upward trajectory is primarily fueled by increasing consumer awareness regarding the benefits of antioxidants in skincare and haircare products, such as anti-aging, UV protection, and pollution defense. The rising demand for natural and clean beauty products is a significant trend, encouraging manufacturers to incorporate naturally derived antioxidants like Vitamins and Polyphenols. Furthermore, advancements in ingredient technology and the growing popularity of specialized treatments like injectables are contributing to market expansion. The market is segmented by source into Natural and Chemically Derived, with Natural sources gaining significant traction due to consumer preference for sustainable and eco-friendly ingredients. Key application areas include Skin Care and Hair Care, which are expected to dominate the market share, followed by Injectables and other applications like makeup and body care.
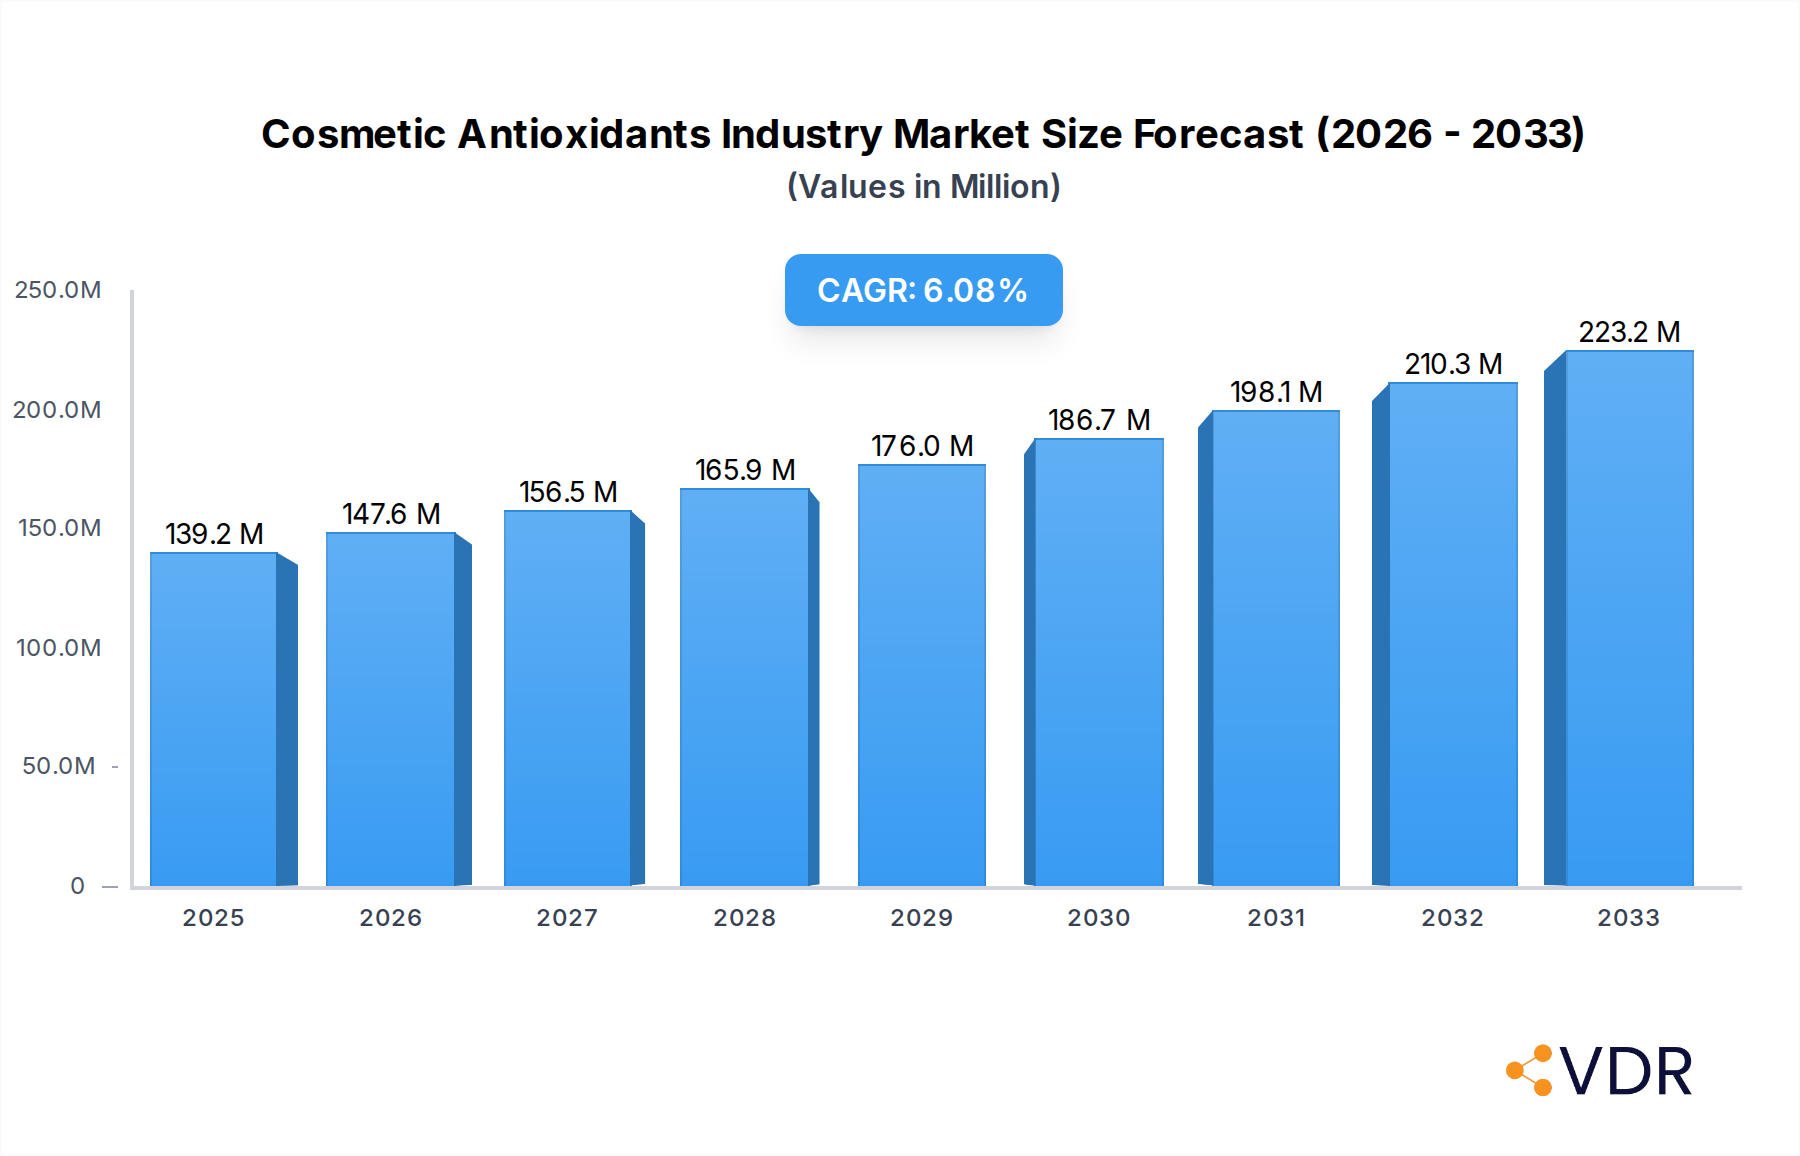
Cosmetic Antioxidants Industry Market Size (In Million)
The competitive landscape features key players such as Koninklijke DSM, Lonza Group, Kemin Industries, Evonik Industries AG, Provital Group, Croda International Plc, BASF SE, Eastman Chemical Company, BTSA Biotecnologias Aplicadas, and Wacker Chemie AG. These companies are actively engaged in research and development to innovate new antioxidant formulations and expand their product portfolios to cater to evolving consumer demands. Geographically, Asia Pacific, led by China and India, is emerging as a significant growth region, driven by a burgeoning middle class and increasing disposable incomes that fuel demand for premium cosmetic products. North America and Europe remain mature yet substantial markets, with a strong focus on premium and scientifically advanced skincare solutions. Challenges such as the potential for ingredient cost fluctuations and the need for stringent regulatory compliance are being addressed by market players through strategic partnerships and investments in sustainable sourcing and production. The overall outlook for the cosmetic antioxidants market remains highly positive, reflecting a growing global commitment to proactive skincare and haircare.

Cosmetic Antioxidants Industry Company Market Share
Unveiling the Dynamic Cosmetic Antioxidants Market: A Comprehensive Industry Report
Gain critical insights into the burgeoning cosmetic antioxidants market with this in-depth report. We explore parent and child market segments, technological advancements, key players, and future growth trajectories, all vital for strategic decision-making in the beauty and personal care sector.
Cosmetic Antioxidants Industry Market Dynamics & Structure
The cosmetic antioxidants industry exhibits a moderately concentrated market structure, characterized by the presence of both established multinational corporations and niche ingredient manufacturers. Technological innovation is a primary driver, fueled by escalating consumer demand for scientifically-backed, anti-aging, and skin-protective formulations. The continuous pursuit of novel antioxidant compounds with enhanced efficacy and stability, alongside the growing preference for natural and sustainable ingredients, is reshaping product development. Regulatory frameworks, particularly in regions like the EU and North America, are increasingly focused on ingredient safety, labeling transparency, and claims substantiation, influencing market entry and product innovation. Competitive product substitutes range from highly effective synthetic antioxidants to diverse botanical extracts, each offering unique benefits and catering to different consumer price points and sensitivities. End-user demographics are broadening, with a significant surge in interest from younger consumers seeking preventative skincare solutions and older demographics focused on mitigating the visible signs of aging. Mergers and acquisitions (M&A) activity remains a strategic tool for market consolidation and portfolio expansion, allowing key players to acquire innovative technologies or gain access to new markets.
- Market Concentration: Dominated by a few large players, but with significant room for specialized ingredient suppliers.
- Technological Innovation: Driven by demand for efficacy, sustainability, and natural sourcing.
- Regulatory Influence: Stringent regulations in key markets shape product development and market access.
- End-User Demographics: Growing interest across a wide age spectrum, with a focus on preventative and restorative skincare.
- M&A Trends: Strategic acquisitions to enhance technological capabilities and market reach.
Cosmetic Antioxidants Industry Growth Trends & Insights
The cosmetic antioxidants market is poised for robust expansion, projecting a substantial Compound Annual Growth Rate (CAGR) of approximately 7.2% from 2025 to 2033. This sustained growth is underpinned by an increasing consumer awareness of the detrimental effects of environmental stressors, such as UV radiation and pollution, on skin health and appearance. Antioxidants, as key protective ingredients, are therefore experiencing elevated adoption rates across a wide array of personal care products. Technological disruptions are continually enhancing the efficacy and delivery systems of antioxidants. Innovations in encapsulation technologies, for instance, are improving the stability and bioavailability of potent antioxidant compounds, maximizing their benefits. Furthermore, the rise of personalized skincare is creating new avenues for customized antioxidant formulations tailored to individual skin concerns.
Consumer behavior shifts are profoundly impacting market dynamics. There is a discernible move towards "clean beauty" and "green chemistry," which favors naturally derived antioxidants and sustainable sourcing practices. Consumers are actively seeking transparency in ingredient lists and are increasingly willing to invest in products that offer demonstrable anti-aging and protective benefits. The perceived value of cosmetic antioxidants has escalated, transitioning from a functional ingredient to a key selling proposition. This heightened consumer demand, coupled with ongoing research and development into novel antioxidant molecules and their synergistic effects, is accelerating market penetration. The market size, estimated at $8,500 million units in the base year of 2025, is projected to reach an impressive $15,000 million units by 2033, highlighting the significant growth potential within this sector. This upward trajectory signifies a fundamental shift in consumer priorities towards proactive skincare and a deeper understanding of the role of antioxidants in maintaining youthful and healthy skin.
Dominant Regions, Countries, or Segments in Cosmetic Antioxidants Industry
North America currently stands as the dominant region in the global cosmetic antioxidants market, driven by a confluence of factors including high disposable incomes, advanced R&D capabilities, and a highly discerning consumer base with a strong inclination towards premium skincare. The United States, in particular, represents a significant market share due to its large population, well-established beauty industry, and early adoption of innovative skincare trends. This dominance is further amplified by a robust presence of key global cosmetic ingredient manufacturers and formulators within the region, fostering continuous product development and market penetration.
The Skin Care application segment, both as a parent market and within its own specialized child markets, represents the largest and most influential segment driving overall market growth. This is directly linked to the pervasive consumer desire for anti-aging, sun protection, and pollution defense solutions. Within the Type segmentation, Vitamins (such as Vitamin C and E) and Polyphenols (derived from green tea, berries, and other botanicals) command significant market share due to their well-documented efficacy and consumer recognition. The Source: Natural segment is experiencing particularly strong growth, reflecting the prevailing consumer preference for clean and sustainable ingredients.
- North America's Dominance: Characterized by high consumer spending, advanced R&D, and early adoption of trends.
- United States' Leading Role: A major market due to population size, industry infrastructure, and consumer demand for premium products.
- Skin Care Application Dominance: Driven by anti-aging, sun protection, and pollution defense needs.
- Key Types: Vitamins and Polyphenols are top performers due to proven efficacy and consumer awareness.
- Natural Source Growth: A significant trend fueled by consumer demand for clean and sustainable ingredients.
- Key Drivers:
- Economic Policies: Favorable trade policies and investment in R&D in leading regions.
- Infrastructure: Well-developed supply chains and distribution networks for cosmetic ingredients.
- Consumer Education: Increased awareness about the benefits of antioxidants for skin health.
- Technological Advancements: Innovations in ingredient synthesis and formulation.
Cosmetic Antioxidants Industry Product Landscape
The product landscape of the cosmetic antioxidants industry is characterized by continuous innovation, focusing on enhanced efficacy, broader spectrum protection, and improved skin compatibility. Key product developments include novel forms of Vitamin C with superior stability and penetration, advanced polyphenol complexes extracted from underutilized botanical sources, and bio-engineered enzymes designed to target specific oxidative stress pathways. Applications are expanding beyond traditional anti-aging serums and creams to encompass innovative formulations in sunscreens, hair care products designed to combat environmental damage, and even injectables offering targeted rejuvenation. Performance metrics are increasingly scrutinized, with a focus on demonstrated reduction in oxidative stress markers, enhanced skin radiance, and long-term protection against environmental aggressors. Unique selling propositions often revolve around patented extraction methods, synergistic ingredient blends, and clinically proven results.
Key Drivers, Barriers & Challenges in Cosmetic Antioxidants Industry
The cosmetic antioxidants industry is propelled by several key drivers, including escalating consumer awareness of the detrimental effects of free radicals and environmental aggressors on skin health, leading to increased demand for protective and anti-aging products. The growing trend towards "clean beauty" and the preference for naturally derived ingredients are also significant growth catalysts, pushing innovation in botanical antioxidant sourcing and extraction. Furthermore, continuous advancements in scientific research uncovering new antioxidant compounds and their synergistic benefits fuel market expansion.
However, the industry faces notable barriers and challenges. Supply chain complexities, particularly for rare or sustainably sourced natural antioxidants, can lead to price volatility and availability issues. Stringent and evolving regulatory landscapes in different global markets can create hurdles for product launches and marketing claims, requiring significant investment in safety and efficacy testing. Competitive pressures from established synthetic alternatives and the constant need for substantiated efficacy claims also pose significant challenges.
Emerging Opportunities in Cosmetic Antioxidants Industry
Emerging opportunities in the cosmetic antioxidants industry are largely driven by evolving consumer preferences and technological advancements. The growing demand for personalized skincare is creating a niche for customized antioxidant formulations tailored to individual genetic predispositions and lifestyle factors. Furthermore, the exploration of novel antioxidant sources, including marine-derived ingredients and upcycled agricultural by-products, presents a significant opportunity for sustainable product development. The integration of antioxidants into advanced delivery systems, such as nanotechnology and microencapsulation, promises enhanced efficacy and broader application in innovative product formats, including those targeting scalp health and hair protection.
Growth Accelerators in the Cosmetic Antioxidants Industry Industry
The long-term growth of the cosmetic antioxidants industry is significantly accelerated by ongoing technological breakthroughs in ingredient synthesis and biotechnology, leading to the development of more potent and stable antioxidant compounds. Strategic partnerships between ingredient suppliers and cosmetic brands are crucial for co-creating innovative formulations and gaining early market access. Furthermore, market expansion into emerging economies, where awareness of skincare benefits is rapidly increasing, presents substantial growth opportunities. The industry's ability to adapt to and embrace sustainable sourcing and manufacturing practices will also act as a significant growth accelerator, aligning with global environmental consciousness.
Key Players Shaping the Cosmetic Antioxidants Industry Market
- Koninklijke DSM
- Lonza Group
- Kemin Industries
- Evonik Industries AG
- Provital Group
- Croda International Plc
- BASF SE
- Eastman Chemical Company
- BTSA Biotecnologias Aplicadas
- Wacker Chemie AG
Notable Milestones in Cosmetic Antioxidants Industry Sector
- October 2023: BASF's Care Chemicals division is investing in a new plant to produce emollient specialties at its Düsseldorf site targeted for skin and sun protection products.
- June 2023: DKSH signed an exclusive distribution agreement with Bitop, the manufacturer of cosmetics ingredients, in Australia, New Zealand, Malaysia, and Singapore.
In-Depth Cosmetic Antioxidants Industry Market Outlook
The future outlook for the cosmetic antioxidants industry is exceptionally promising, driven by a sustained demand for effective anti-aging and protective skincare solutions. Growth accelerators include continuous innovation in naturally derived antioxidants and advanced delivery systems, catering to the "clean beauty" movement and consumer desire for high-performance products. Strategic collaborations between leading chemical manufacturers and cosmetic brands will further propel market penetration and the development of novel applications. The expanding market reach into developing economies, coupled with increasing consumer education on the vital role of antioxidants in skin health, signals a robust and enduring growth trajectory for the industry.
Cosmetic Antioxidants Industry Segmentation
-
1. Source
- 1.1. Natural
- 1.2. Chemically Derived
-
2. Type
- 2.1. Vitamins
- 2.2. Polyphenols
- 2.3. Enzymes
- 2.4. Carotenoids
- 2.5. Other Ty
-
3. Application
- 3.1. Skin Care
- 3.2. Hair Care
- 3.3. Injectables
- 3.4. Other Applications (Makeup and Body care)
Cosmetic Antioxidants Industry Segmentation By Geography
-
1. Asia Pacific
- 1.1. China
- 1.2. India
- 1.3. Japan
- 1.4. South Korea
- 1.5. Rest of Asia Pacific
-
2. North America
- 2.1. United States
- 2.2. Canada
- 2.3. Mexico
-
3. Europe
- 3.1. Germany
- 3.2. United Kingdom
- 3.3. Italy
- 3.4. France
- 3.5. Rest of Europe
-
4. South America
- 4.1. Brazil
- 4.2. Argentina
- 4.3. Rest of South America
-
5. Middle East and Africa
- 5.1. Saudi Arabia
- 5.2. South Africa
- 5.3. Rest of Middle East and Africa
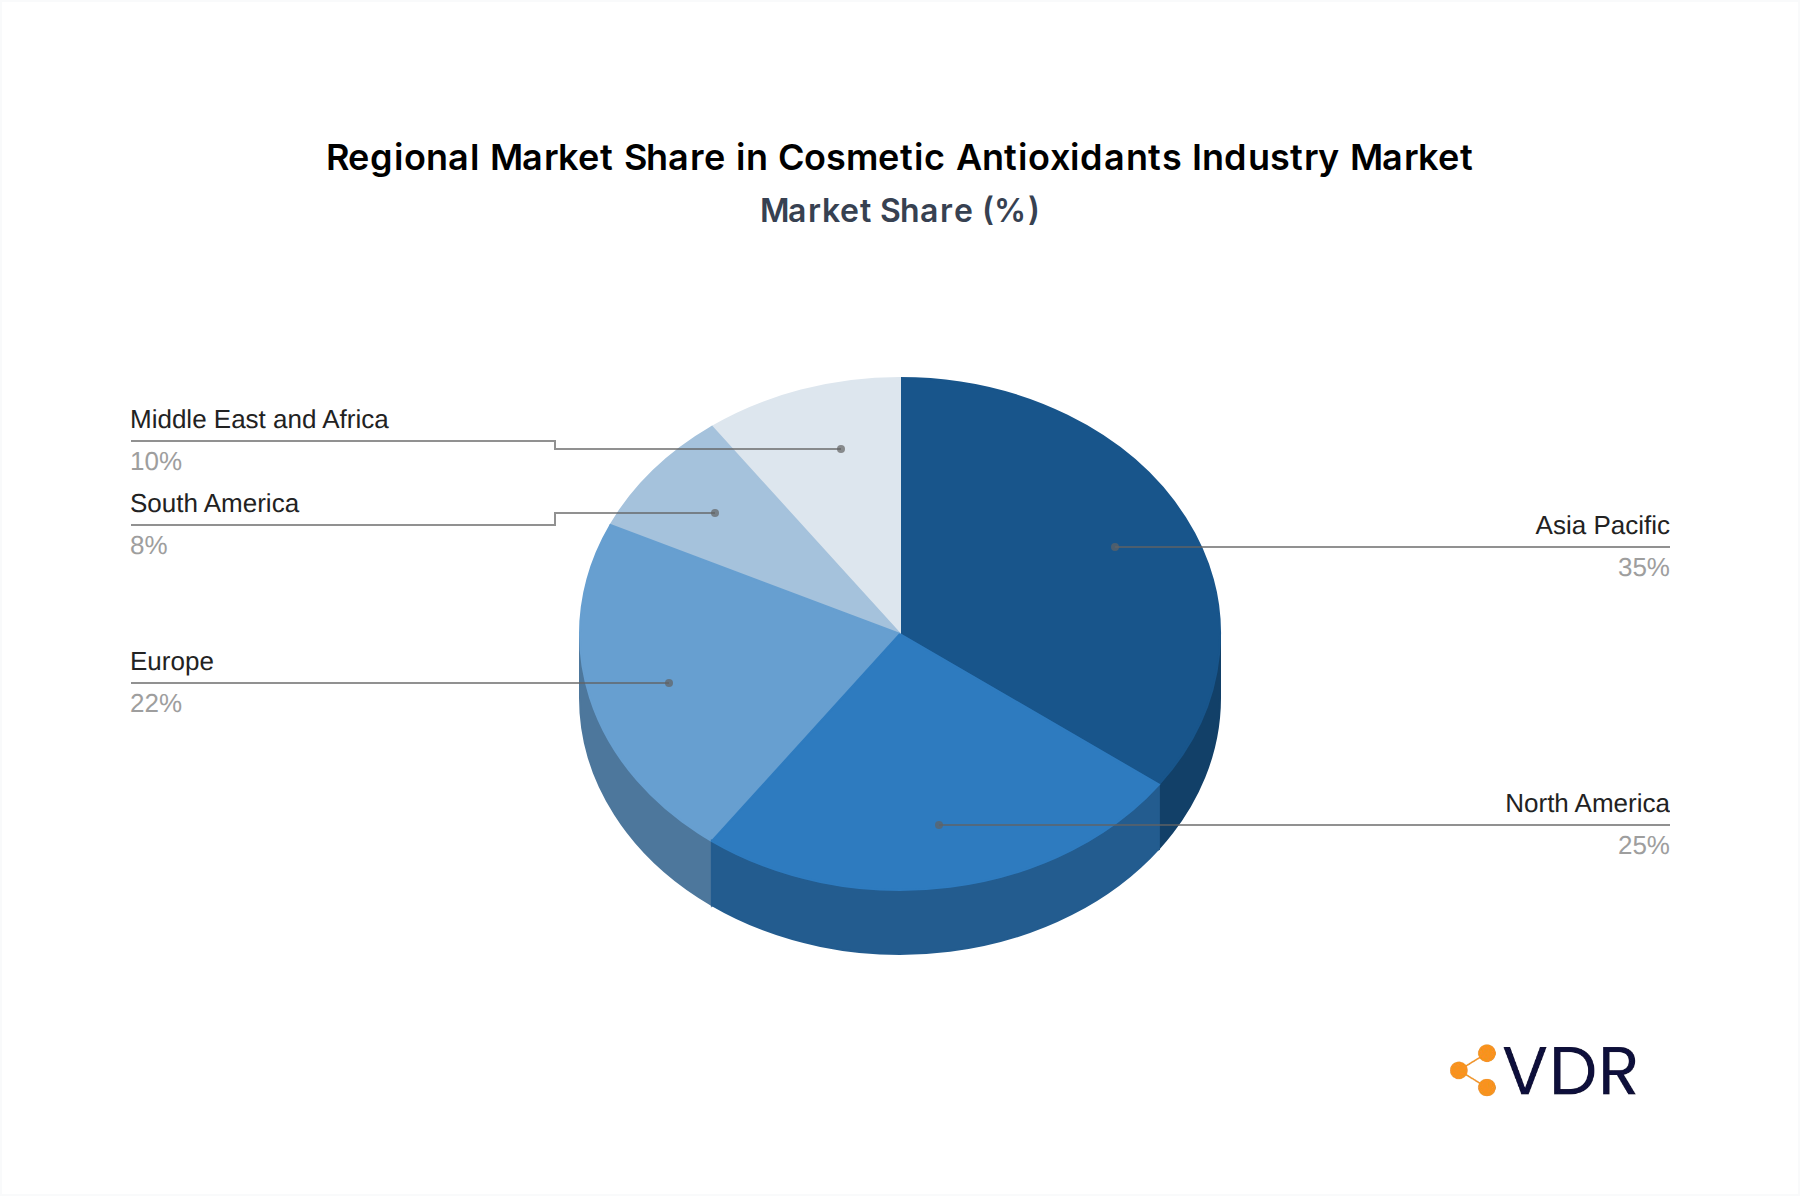
Cosmetic Antioxidants Industry Regional Market Share
Geographic Coverage of Cosmetic Antioxidants Industry
Cosmetic Antioxidants Industry REPORT HIGHLIGHTS
| Aspects | Details |
|---|---|
| Study Period | 2020-2034 |
| Base Year | 2025 |
| Estimated Year | 2026 |
| Forecast Period | 2026-2034 |
| Historical Period | 2020-2025 |
| Growth Rate | CAGR of 5.95% from 2020-2034 |
| Segmentation |
|
Table of Contents
- 1. Introduction
- 1.1. Research Scope
- 1.2. Market Segmentation
- 1.3. Research Objective
- 1.4. Definitions and Assumptions
- 2. Executive Summary
- 2.1. Market Snapshot
- 3. Market Dynamics
- 3.1. Market Drivers
- 3.2. Market Restrains
- 3.3. Market Trends
- 3.4. Market Opportunities
- 4. Market Factor Analysis
- 4.1. Porters Five Forces
- 4.1.1. Bargaining Power of Suppliers
- 4.1.2. Bargaining Power of Buyers
- 4.1.3. Threat of New Entrants
- 4.1.4. Threat of Substitutes
- 4.1.5. Competitive Rivalry
- 4.2. PESTEL analysis
- 4.3. BCG Analysis
- 4.3.1. Stars (High Growth, High Market Share)
- 4.3.2. Cash Cows (Low Growth, High Market Share)
- 4.3.3. Question Mark (High Growth, Low Market Share)
- 4.3.4. Dogs (Low Growth, Low Market Share)
- 4.4. Ansoff Matrix Analysis
- 4.5. Supply Chain Analysis
- 4.6. Regulatory Landscape
- 4.7. Current Market Potential and Opportunity Assessment (TAM–SAM–SOM Framework)
- 4.8. VDR Analyst Note
- 4.1. Porters Five Forces
- 5. Market Analysis, Insights and Forecast 2021-2033
- 5.1. Market Analysis, Insights and Forecast - by Source
- 5.1.1. Natural
- 5.1.2. Chemically Derived
- 5.2. Market Analysis, Insights and Forecast - by Type
- 5.2.1. Vitamins
- 5.2.2. Polyphenols
- 5.2.3. Enzymes
- 5.2.4. Carotenoids
- 5.2.5. Other Ty
- 5.3. Market Analysis, Insights and Forecast - by Application
- 5.3.1. Skin Care
- 5.3.2. Hair Care
- 5.3.3. Injectables
- 5.3.4. Other Applications (Makeup and Body care)
- 5.4. Market Analysis, Insights and Forecast - by Region
- 5.4.1. Asia Pacific
- 5.4.2. North America
- 5.4.3. Europe
- 5.4.4. South America
- 5.4.5. Middle East and Africa
- 5.1. Market Analysis, Insights and Forecast - by Source
- 6. Global Cosmetic Antioxidants Industry Analysis, Insights and Forecast, 2021-2033
- 6.1. Market Analysis, Insights and Forecast - by Source
- 6.1.1. Natural
- 6.1.2. Chemically Derived
- 6.2. Market Analysis, Insights and Forecast - by Type
- 6.2.1. Vitamins
- 6.2.2. Polyphenols
- 6.2.3. Enzymes
- 6.2.4. Carotenoids
- 6.2.5. Other Ty
- 6.3. Market Analysis, Insights and Forecast - by Application
- 6.3.1. Skin Care
- 6.3.2. Hair Care
- 6.3.3. Injectables
- 6.3.4. Other Applications (Makeup and Body care)
- 6.1. Market Analysis, Insights and Forecast - by Source
- 7. Asia Pacific Cosmetic Antioxidants Industry Analysis, Insights and Forecast, 2021-2033
- 7.1. Market Analysis, Insights and Forecast - by Source
- 7.1.1. Natural
- 7.1.2. Chemically Derived
- 7.2. Market Analysis, Insights and Forecast - by Type
- 7.2.1. Vitamins
- 7.2.2. Polyphenols
- 7.2.3. Enzymes
- 7.2.4. Carotenoids
- 7.2.5. Other Ty
- 7.3. Market Analysis, Insights and Forecast - by Application
- 7.3.1. Skin Care
- 7.3.2. Hair Care
- 7.3.3. Injectables
- 7.3.4. Other Applications (Makeup and Body care)
- 7.1. Market Analysis, Insights and Forecast - by Source
- 8. North America Cosmetic Antioxidants Industry Analysis, Insights and Forecast, 2021-2033
- 8.1. Market Analysis, Insights and Forecast - by Source
- 8.1.1. Natural
- 8.1.2. Chemically Derived
- 8.2. Market Analysis, Insights and Forecast - by Type
- 8.2.1. Vitamins
- 8.2.2. Polyphenols
- 8.2.3. Enzymes
- 8.2.4. Carotenoids
- 8.2.5. Other Ty
- 8.3. Market Analysis, Insights and Forecast - by Application
- 8.3.1. Skin Care
- 8.3.2. Hair Care
- 8.3.3. Injectables
- 8.3.4. Other Applications (Makeup and Body care)
- 8.1. Market Analysis, Insights and Forecast - by Source
- 9. Europe Cosmetic Antioxidants Industry Analysis, Insights and Forecast, 2021-2033
- 9.1. Market Analysis, Insights and Forecast - by Source
- 9.1.1. Natural
- 9.1.2. Chemically Derived
- 9.2. Market Analysis, Insights and Forecast - by Type
- 9.2.1. Vitamins
- 9.2.2. Polyphenols
- 9.2.3. Enzymes
- 9.2.4. Carotenoids
- 9.2.5. Other Ty
- 9.3. Market Analysis, Insights and Forecast - by Application
- 9.3.1. Skin Care
- 9.3.2. Hair Care
- 9.3.3. Injectables
- 9.3.4. Other Applications (Makeup and Body care)
- 9.1. Market Analysis, Insights and Forecast - by Source
- 10. South America Cosmetic Antioxidants Industry Analysis, Insights and Forecast, 2021-2033
- 10.1. Market Analysis, Insights and Forecast - by Source
- 10.1.1. Natural
- 10.1.2. Chemically Derived
- 10.2. Market Analysis, Insights and Forecast - by Type
- 10.2.1. Vitamins
- 10.2.2. Polyphenols
- 10.2.3. Enzymes
- 10.2.4. Carotenoids
- 10.2.5. Other Ty
- 10.3. Market Analysis, Insights and Forecast - by Application
- 10.3.1. Skin Care
- 10.3.2. Hair Care
- 10.3.3. Injectables
- 10.3.4. Other Applications (Makeup and Body care)
- 10.1. Market Analysis, Insights and Forecast - by Source
- 11. Middle East and Africa Cosmetic Antioxidants Industry Analysis, Insights and Forecast, 2021-2033
- 11.1. Market Analysis, Insights and Forecast - by Source
- 11.1.1. Natural
- 11.1.2. Chemically Derived
- 11.2. Market Analysis, Insights and Forecast - by Type
- 11.2.1. Vitamins
- 11.2.2. Polyphenols
- 11.2.3. Enzymes
- 11.2.4. Carotenoids
- 11.2.5. Other Ty
- 11.3. Market Analysis, Insights and Forecast - by Application
- 11.3.1. Skin Care
- 11.3.2. Hair Care
- 11.3.3. Injectables
- 11.3.4. Other Applications (Makeup and Body care)
- 11.1. Market Analysis, Insights and Forecast - by Source
- 12. Competitive Analysis
- 12.1. Company Profiles
- 12.1.1 Koninklijke DSM
- 12.1.1.1. Company Overview
- 12.1.1.2. Products
- 12.1.1.3. Company Financials
- 12.1.1.4. SWOT Analysis
- 12.1.2 Lonza Group
- 12.1.2.1. Company Overview
- 12.1.2.2. Products
- 12.1.2.3. Company Financials
- 12.1.2.4. SWOT Analysis
- 12.1.3 Kemin Industries
- 12.1.3.1. Company Overview
- 12.1.3.2. Products
- 12.1.3.3. Company Financials
- 12.1.3.4. SWOT Analysis
- 12.1.4 Evonik Industries AG
- 12.1.4.1. Company Overview
- 12.1.4.2. Products
- 12.1.4.3. Company Financials
- 12.1.4.4. SWOT Analysis
- 12.1.5 Provital Group
- 12.1.5.1. Company Overview
- 12.1.5.2. Products
- 12.1.5.3. Company Financials
- 12.1.5.4. SWOT Analysis
- 12.1.6 Croda International Plc
- 12.1.6.1. Company Overview
- 12.1.6.2. Products
- 12.1.6.3. Company Financials
- 12.1.6.4. SWOT Analysis
- 12.1.7 BASF SE
- 12.1.7.1. Company Overview
- 12.1.7.2. Products
- 12.1.7.3. Company Financials
- 12.1.7.4. SWOT Analysis
- 12.1.8 Eastman Chemical Company
- 12.1.8.1. Company Overview
- 12.1.8.2. Products
- 12.1.8.3. Company Financials
- 12.1.8.4. SWOT Analysis
- 12.1.9 BTSA Biotecnologias Aplicadas
- 12.1.9.1. Company Overview
- 12.1.9.2. Products
- 12.1.9.3. Company Financials
- 12.1.9.4. SWOT Analysis
- 12.1.10 Wacker Chemie AG*List Not Exhaustive
- 12.1.10.1. Company Overview
- 12.1.10.2. Products
- 12.1.10.3. Company Financials
- 12.1.10.4. SWOT Analysis
- 12.1.1 Koninklijke DSM
- 12.2. Market Entropy
- 12.2.1 Company's Key Areas Served
- 12.2.2 Recent Developments
- 12.3. Company Market Share Analysis 2025
- 12.3.1 Top 5 Companies Market Share Analysis
- 12.3.2 Top 3 Companies Market Share Analysis
- 12.4. List of Potential Customers
- 13. Research Methodology
List of Figures
- Figure 1: Global Cosmetic Antioxidants Industry Revenue Breakdown (Million, %) by Region 2025 & 2033
- Figure 2: Asia Pacific Cosmetic Antioxidants Industry Revenue (Million), by Source 2025 & 2033
- Figure 3: Asia Pacific Cosmetic Antioxidants Industry Revenue Share (%), by Source 2025 & 2033
- Figure 4: Asia Pacific Cosmetic Antioxidants Industry Revenue (Million), by Type 2025 & 2033
- Figure 5: Asia Pacific Cosmetic Antioxidants Industry Revenue Share (%), by Type 2025 & 2033
- Figure 6: Asia Pacific Cosmetic Antioxidants Industry Revenue (Million), by Application 2025 & 2033
- Figure 7: Asia Pacific Cosmetic Antioxidants Industry Revenue Share (%), by Application 2025 & 2033
- Figure 8: Asia Pacific Cosmetic Antioxidants Industry Revenue (Million), by Country 2025 & 2033
- Figure 9: Asia Pacific Cosmetic Antioxidants Industry Revenue Share (%), by Country 2025 & 2033
- Figure 10: North America Cosmetic Antioxidants Industry Revenue (Million), by Source 2025 & 2033
- Figure 11: North America Cosmetic Antioxidants Industry Revenue Share (%), by Source 2025 & 2033
- Figure 12: North America Cosmetic Antioxidants Industry Revenue (Million), by Type 2025 & 2033
- Figure 13: North America Cosmetic Antioxidants Industry Revenue Share (%), by Type 2025 & 2033
- Figure 14: North America Cosmetic Antioxidants Industry Revenue (Million), by Application 2025 & 2033
- Figure 15: North America Cosmetic Antioxidants Industry Revenue Share (%), by Application 2025 & 2033
- Figure 16: North America Cosmetic Antioxidants Industry Revenue (Million), by Country 2025 & 2033
- Figure 17: North America Cosmetic Antioxidants Industry Revenue Share (%), by Country 2025 & 2033
- Figure 18: Europe Cosmetic Antioxidants Industry Revenue (Million), by Source 2025 & 2033
- Figure 19: Europe Cosmetic Antioxidants Industry Revenue Share (%), by Source 2025 & 2033
- Figure 20: Europe Cosmetic Antioxidants Industry Revenue (Million), by Type 2025 & 2033
- Figure 21: Europe Cosmetic Antioxidants Industry Revenue Share (%), by Type 2025 & 2033
- Figure 22: Europe Cosmetic Antioxidants Industry Revenue (Million), by Application 2025 & 2033
- Figure 23: Europe Cosmetic Antioxidants Industry Revenue Share (%), by Application 2025 & 2033
- Figure 24: Europe Cosmetic Antioxidants Industry Revenue (Million), by Country 2025 & 2033
- Figure 25: Europe Cosmetic Antioxidants Industry Revenue Share (%), by Country 2025 & 2033
- Figure 26: South America Cosmetic Antioxidants Industry Revenue (Million), by Source 2025 & 2033
- Figure 27: South America Cosmetic Antioxidants Industry Revenue Share (%), by Source 2025 & 2033
- Figure 28: South America Cosmetic Antioxidants Industry Revenue (Million), by Type 2025 & 2033
- Figure 29: South America Cosmetic Antioxidants Industry Revenue Share (%), by Type 2025 & 2033
- Figure 30: South America Cosmetic Antioxidants Industry Revenue (Million), by Application 2025 & 2033
- Figure 31: South America Cosmetic Antioxidants Industry Revenue Share (%), by Application 2025 & 2033
- Figure 32: South America Cosmetic Antioxidants Industry Revenue (Million), by Country 2025 & 2033
- Figure 33: South America Cosmetic Antioxidants Industry Revenue Share (%), by Country 2025 & 2033
- Figure 34: Middle East and Africa Cosmetic Antioxidants Industry Revenue (Million), by Source 2025 & 2033
- Figure 35: Middle East and Africa Cosmetic Antioxidants Industry Revenue Share (%), by Source 2025 & 2033
- Figure 36: Middle East and Africa Cosmetic Antioxidants Industry Revenue (Million), by Type 2025 & 2033
- Figure 37: Middle East and Africa Cosmetic Antioxidants Industry Revenue Share (%), by Type 2025 & 2033
- Figure 38: Middle East and Africa Cosmetic Antioxidants Industry Revenue (Million), by Application 2025 & 2033
- Figure 39: Middle East and Africa Cosmetic Antioxidants Industry Revenue Share (%), by Application 2025 & 2033
- Figure 40: Middle East and Africa Cosmetic Antioxidants Industry Revenue (Million), by Country 2025 & 2033
- Figure 41: Middle East and Africa Cosmetic Antioxidants Industry Revenue Share (%), by Country 2025 & 2033
List of Tables
- Table 1: Global Cosmetic Antioxidants Industry Revenue Million Forecast, by Source 2020 & 2033
- Table 2: Global Cosmetic Antioxidants Industry Revenue Million Forecast, by Type 2020 & 2033
- Table 3: Global Cosmetic Antioxidants Industry Revenue Million Forecast, by Application 2020 & 2033
- Table 4: Global Cosmetic Antioxidants Industry Revenue Million Forecast, by Region 2020 & 2033
- Table 5: Global Cosmetic Antioxidants Industry Revenue Million Forecast, by Source 2020 & 2033
- Table 6: Global Cosmetic Antioxidants Industry Revenue Million Forecast, by Type 2020 & 2033
- Table 7: Global Cosmetic Antioxidants Industry Revenue Million Forecast, by Application 2020 & 2033
- Table 8: Global Cosmetic Antioxidants Industry Revenue Million Forecast, by Country 2020 & 2033
- Table 9: China Cosmetic Antioxidants Industry Revenue (Million) Forecast, by Application 2020 & 2033
- Table 10: India Cosmetic Antioxidants Industry Revenue (Million) Forecast, by Application 2020 & 2033
- Table 11: Japan Cosmetic Antioxidants Industry Revenue (Million) Forecast, by Application 2020 & 2033
- Table 12: South Korea Cosmetic Antioxidants Industry Revenue (Million) Forecast, by Application 2020 & 2033
- Table 13: Rest of Asia Pacific Cosmetic Antioxidants Industry Revenue (Million) Forecast, by Application 2020 & 2033
- Table 14: Global Cosmetic Antioxidants Industry Revenue Million Forecast, by Source 2020 & 2033
- Table 15: Global Cosmetic Antioxidants Industry Revenue Million Forecast, by Type 2020 & 2033
- Table 16: Global Cosmetic Antioxidants Industry Revenue Million Forecast, by Application 2020 & 2033
- Table 17: Global Cosmetic Antioxidants Industry Revenue Million Forecast, by Country 2020 & 2033
- Table 18: United States Cosmetic Antioxidants Industry Revenue (Million) Forecast, by Application 2020 & 2033
- Table 19: Canada Cosmetic Antioxidants Industry Revenue (Million) Forecast, by Application 2020 & 2033
- Table 20: Mexico Cosmetic Antioxidants Industry Revenue (Million) Forecast, by Application 2020 & 2033
- Table 21: Global Cosmetic Antioxidants Industry Revenue Million Forecast, by Source 2020 & 2033
- Table 22: Global Cosmetic Antioxidants Industry Revenue Million Forecast, by Type 2020 & 2033
- Table 23: Global Cosmetic Antioxidants Industry Revenue Million Forecast, by Application 2020 & 2033
- Table 24: Global Cosmetic Antioxidants Industry Revenue Million Forecast, by Country 2020 & 2033
- Table 25: Germany Cosmetic Antioxidants Industry Revenue (Million) Forecast, by Application 2020 & 2033
- Table 26: United Kingdom Cosmetic Antioxidants Industry Revenue (Million) Forecast, by Application 2020 & 2033
- Table 27: Italy Cosmetic Antioxidants Industry Revenue (Million) Forecast, by Application 2020 & 2033
- Table 28: France Cosmetic Antioxidants Industry Revenue (Million) Forecast, by Application 2020 & 2033
- Table 29: Rest of Europe Cosmetic Antioxidants Industry Revenue (Million) Forecast, by Application 2020 & 2033
- Table 30: Global Cosmetic Antioxidants Industry Revenue Million Forecast, by Source 2020 & 2033
- Table 31: Global Cosmetic Antioxidants Industry Revenue Million Forecast, by Type 2020 & 2033
- Table 32: Global Cosmetic Antioxidants Industry Revenue Million Forecast, by Application 2020 & 2033
- Table 33: Global Cosmetic Antioxidants Industry Revenue Million Forecast, by Country 2020 & 2033
- Table 34: Brazil Cosmetic Antioxidants Industry Revenue (Million) Forecast, by Application 2020 & 2033
- Table 35: Argentina Cosmetic Antioxidants Industry Revenue (Million) Forecast, by Application 2020 & 2033
- Table 36: Rest of South America Cosmetic Antioxidants Industry Revenue (Million) Forecast, by Application 2020 & 2033
- Table 37: Global Cosmetic Antioxidants Industry Revenue Million Forecast, by Source 2020 & 2033
- Table 38: Global Cosmetic Antioxidants Industry Revenue Million Forecast, by Type 2020 & 2033
- Table 39: Global Cosmetic Antioxidants Industry Revenue Million Forecast, by Application 2020 & 2033
- Table 40: Global Cosmetic Antioxidants Industry Revenue Million Forecast, by Country 2020 & 2033
- Table 41: Saudi Arabia Cosmetic Antioxidants Industry Revenue (Million) Forecast, by Application 2020 & 2033
- Table 42: South Africa Cosmetic Antioxidants Industry Revenue (Million) Forecast, by Application 2020 & 2033
- Table 43: Rest of Middle East and Africa Cosmetic Antioxidants Industry Revenue (Million) Forecast, by Application 2020 & 2033
Frequently Asked Questions
1. What is the projected Compound Annual Growth Rate (CAGR) of the Cosmetic Antioxidants Industry?
The projected CAGR is approximately 5.95%.
2. Which companies are prominent players in the Cosmetic Antioxidants Industry?
Key companies in the market include Koninklijke DSM, Lonza Group, Kemin Industries, Evonik Industries AG, Provital Group, Croda International Plc, BASF SE, Eastman Chemical Company, BTSA Biotecnologias Aplicadas, Wacker Chemie AG*List Not Exhaustive.
3. What are the main segments of the Cosmetic Antioxidants Industry?
The market segments include Source, Type, Application.
4. Can you provide details about the market size?
The market size is estimated to be USD 139.23 Million as of 2022.
5. What are some drivers contributing to market growth?
Rise in Online Purcahse of Cosmetics; Increasing Use of Beauty Products and Personal Care Products; Other Drivers.
6. What are the notable trends driving market growth?
Increasing Usage of Natural Antioxidants in Cosmetics Products.
7. Are there any restraints impacting market growth?
High Cost of Natural Antioxidants; Other Restraints.
8. Can you provide examples of recent developments in the market?
October 2023: BASF's Care Chemicals division is investing in a new plant to produce emollient specialties at its Düsseldorf site targeted for skin and sun protection products.
9. What pricing options are available for accessing the report?
Pricing options include single-user, multi-user, and enterprise licenses priced at USD 4750, USD 5250, and USD 8750 respectively.
10. Is the market size provided in terms of value or volume?
The market size is provided in terms of value, measured in Million.
11. Are there any specific market keywords associated with the report?
Yes, the market keyword associated with the report is "Cosmetic Antioxidants Industry," which aids in identifying and referencing the specific market segment covered.
12. How do I determine which pricing option suits my needs best?
The pricing options vary based on user requirements and access needs. Individual users may opt for single-user licenses, while businesses requiring broader access may choose multi-user or enterprise licenses for cost-effective access to the report.
13. Are there any additional resources or data provided in the Cosmetic Antioxidants Industry report?
While the report offers comprehensive insights, it's advisable to review the specific contents or supplementary materials provided to ascertain if additional resources or data are available.
14. How can I stay updated on further developments or reports in the Cosmetic Antioxidants Industry?
To stay informed about further developments, trends, and reports in the Cosmetic Antioxidants Industry, consider subscribing to industry newsletters, following relevant companies and organizations, or regularly checking reputable industry news sources and publications.
Methodology
Step 1 - Identification of Relevant Samples Size from Population Database


Step 2 - Approaches for Defining Global Market Size (Value, Volume* & Price*)

Note*: In applicable scenarios
Step 3 - Data Sources
Primary Research
- Web Analytics
- Survey Reports
- Research Institute
- Latest Research Reports
- Opinion Leaders
Secondary Research
- Annual Reports
- White Paper
- Latest Press Release
- Industry Association
- Paid Database
- Investor Presentations

Step 4 - Data Triangulation
Involves using different sources of information in order to increase the validity of a study
These sources are likely to be stakeholders in a program - participants, other researchers, program staff, other community members, and so on.
Then we put all data in single framework & apply various statistical tools to find out the dynamic on the market.
During the analysis stage, feedback from the stakeholder groups would be compared to determine areas of agreement as well as areas of divergence