
Key Insights
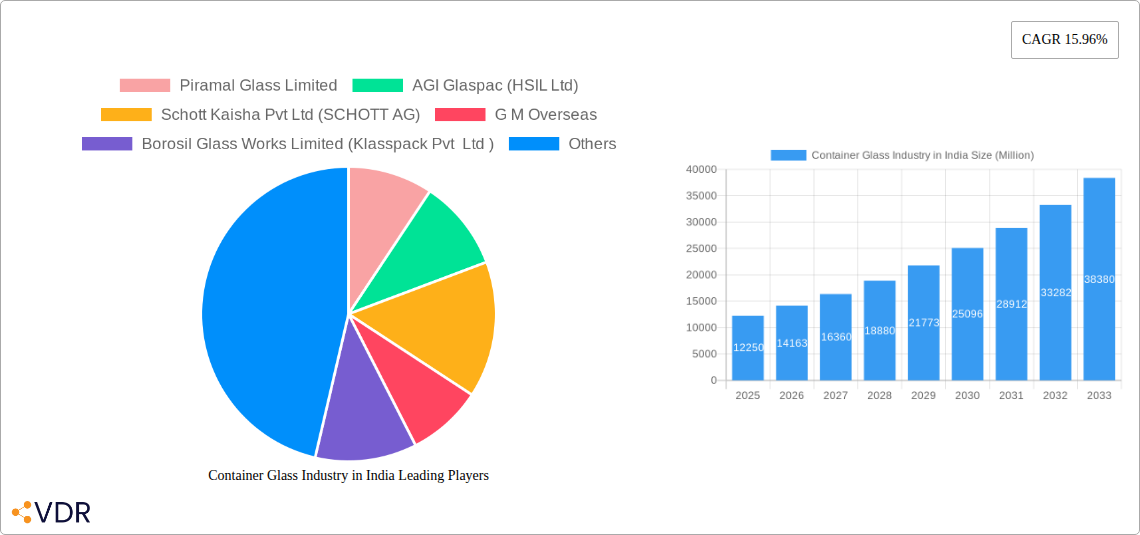
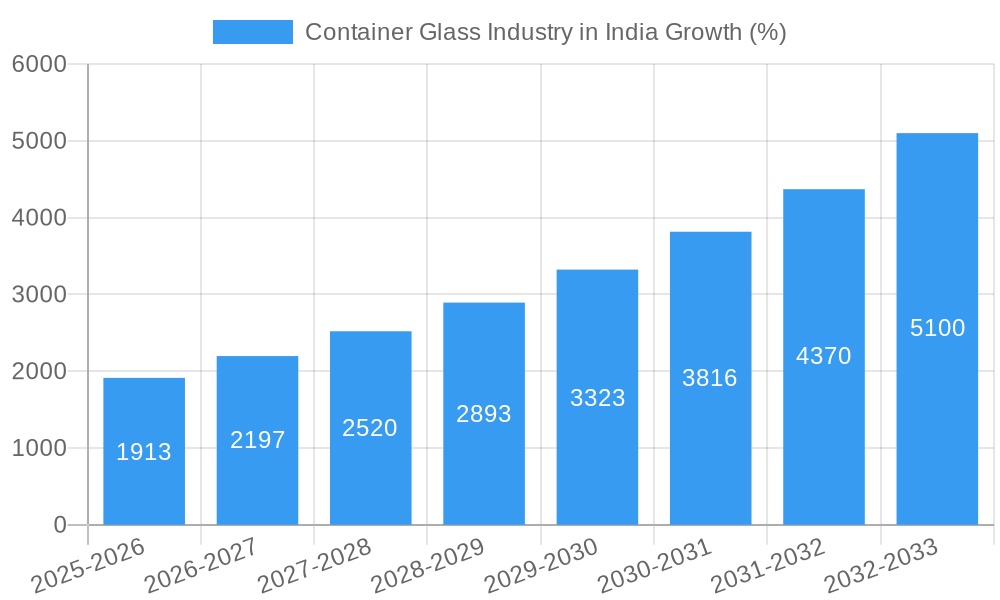
The Indian container glass market, valued at $12.25 billion in 2025, is experiencing robust growth, projected to expand at a Compound Annual Growth Rate (CAGR) of 15.96% from 2025 to 2033. This significant expansion is driven by several key factors. The burgeoning food and beverage industry, coupled with a rising demand for cosmetics and pharmaceuticals, fuels the need for efficient and cost-effective packaging solutions. Increased consumer spending, particularly in urban areas, further boosts demand for packaged goods, translating directly into higher container glass consumption. Furthermore, the growing preference for environmentally friendly and recyclable packaging options positions container glass favorably against competing materials like plastics. While challenges such as fluctuating raw material prices and stringent environmental regulations exist, the overall market outlook remains positive.
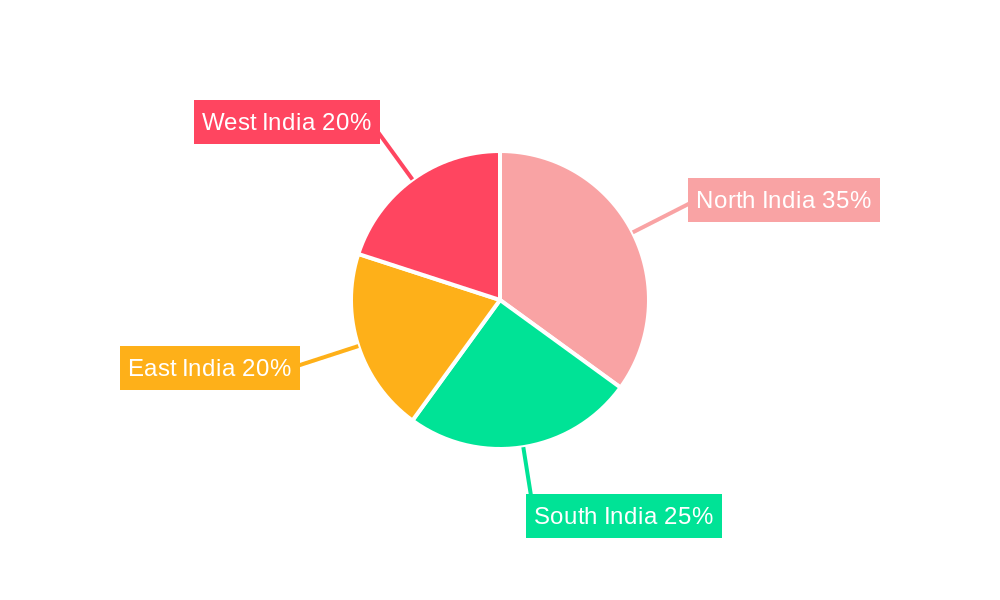
The market segmentation reveals significant opportunities across various end-user industries. The food and beverage sector dominates, accounting for the largest share due to the widespread use of glass containers for preserving and showcasing products. The cosmetics and perfumery segment demonstrates strong growth potential, driven by the increasing popularity of premium and luxury brands that favor glass packaging for its aesthetic appeal and perceived quality. The pharmaceuticals industry's reliance on glass for drug containment ensures consistent demand. Regional variations exist, with North and West India likely exhibiting higher growth rates owing to established industrial hubs and greater consumer spending. Key players like Piramal Glass Limited, AGI Glaspac, and Schott Kaisha Pvt Ltd are strategically positioning themselves to capitalize on the expanding market, investing in capacity expansion and innovative packaging solutions. The forecast period (2025-2033) presents significant investment opportunities for both domestic and international players aiming to tap into India's dynamic and expanding container glass market.
Container Glass Industry in India: Market Dynamics, Growth, and Outlook (2019-2033)
This comprehensive report provides a detailed analysis of the Container Glass Industry in India, covering market size, growth trends, competitive landscape, and future outlook. With a focus on key segments like Food & Beverage, Pharmaceuticals, and Cosmetics & Perfumery, this report is an essential resource for industry professionals, investors, and strategic planners. The study period spans from 2019 to 2033, with 2025 as the base and estimated year.
Study Period: 2019–2033 Base Year: 2025 Estimated Year: 2025 Forecast Period: 2025–2033 Historical Period: 2019–2024
Container Glass Industry in India Market Dynamics & Structure
The Indian container glass market, valued at xx Million units in 2024, is characterized by a moderately consolidated structure with several major players and numerous smaller regional producers. Market concentration is influenced by factors such as economies of scale, access to raw materials, and technological capabilities. Technological innovation, primarily focused on improving production efficiency, reducing energy consumption, and enhancing product quality, is a key driver. The industry is subject to stringent regulatory frameworks concerning environmental protection and product safety. While plastic and other materials present competitive substitutes, glass retains its dominance due to its inherent properties such as recyclability and barrier protection. The end-user demographics are diverse, ranging from large multinational corporations to small and medium-sized enterprises (SMEs) across various sectors. M&A activity has been relatively moderate, with a focus on consolidating regional players or expanding capacity.
- Market Concentration: Moderately consolidated, with a few large players dominating. (Further quantitative data would go here; needs market research to fill this in with specific percentages of market share etc.)
- Technological Innovation: Focus on efficiency, energy savings, and quality improvements (e.g., lightweighting, improved surface treatments).
- Regulatory Framework: Stringent environmental regulations and product safety standards.
- Competitive Substitutes: Plastic, metal, and other packaging materials.
- End-User Demographics: Diverse, encompassing large corporations and SMEs across various sectors.
- M&A Trends: Moderate activity, primarily focused on capacity expansion and consolidation. (Again, needs quantitative data on the volume of M&A deals over the historical period. Perhaps X number of deals in the past 5 years.)
Container Glass Industry in India Growth Trends & Insights
The Indian container glass market has experienced steady growth over the historical period (2019-2024), driven primarily by increased consumption across various end-user segments. The CAGR during this period is estimated at xx%. Factors influencing growth include rising disposable incomes, urbanization, changing consumer preferences, and the expanding packaged food and beverage industry. Technological disruptions, such as the adoption of advanced manufacturing technologies, have also contributed to increased efficiency and production capacity. Consumer behavior shifts towards premium packaging and sustainable solutions are creating new opportunities for innovative glass containers. The market is expected to continue its growth trajectory in the forecast period (2025-2033), with an estimated CAGR of xx%. Market penetration is highest in the Food & Beverage segment and is expected to increase in the Pharmaceuticals sector due to demand for higher quality and safer packaging. (XXX would be replaced with specific market data; needs appropriate market research data)
Dominant Regions, Countries, or Segments in Container Glass Industry in India
The largest segment within the Indian container glass market is currently the Food and Beverage industry, followed by Pharmaceuticals and Cosmetics & Perfumery. This dominance is driven by various factors including the growth of the packaged food and beverage industry, government policies favoring packaged food, and increasing demand for safe and high-quality packaging in the pharmaceutical sector. Key growth drivers for these segments include:
- Food and Beverage: Rising disposable incomes, urbanization, and changing lifestyles lead to increased consumption of packaged food and beverages.
- Pharmaceuticals: Growing healthcare sector and strict regulatory requirements favoring glass packaging for its barrier properties.
- Cosmetics & Perfumery: Increasing demand for premium and aesthetically appealing packaging.
(Needs further quantitative data here to support assertions on market share and growth potential. Include specific numbers or percentages where possible for each segment)
Container Glass Industry in India Product Landscape
The Indian container glass market offers a wide range of products, from basic jars and bottles to specialized containers for pharmaceuticals and cosmetics. Innovation focuses on developing lighter weight containers to reduce material costs and transportation expenses, improving surface treatments for enhanced aesthetics and functionality, and creating containers with enhanced barrier properties to extend shelf life. Unique selling propositions include customization options, sustainable production practices, and adherence to stringent quality standards. Technological advancements involve the integration of automation in manufacturing processes and the application of advanced coating technologies.
Key Drivers, Barriers & Challenges in Container Glass Industry in India
Key Drivers:
- Growth of packaged food and beverages: Expanding organized retail and rising consumer demand.
- Increasing healthcare expenditure: Driving demand for pharmaceutical glass containers.
- Government initiatives promoting sustainable packaging: Encouraging the use of recyclable materials.
Key Challenges:
- Fluctuating raw material prices: impacting production costs. (Quantitative impact needs to be added here - e.g., a price increase of X% led to a Y% increase in production costs)
- Intense competition: from alternative packaging materials like plastic. (Again, needs quantitative data - e.g., plastic packaging accounts for X% of the market)
- Environmental regulations: requiring investment in cleaner production technologies. (e.g. cost of compliance is estimated at Z Million units annually)
Emerging Opportunities in Container Glass Industry in India
- Growth of e-commerce: increasing demand for convenient and safe packaging.
- Premiumization of packaging: consumers willing to pay more for high-quality containers.
- Focus on sustainability: demand for eco-friendly and recyclable glass packaging.
Growth Accelerators in the Container Glass Industry in India Industry
Long-term growth in the Indian container glass industry is fueled by several key accelerators, including continued expansion of the food and beverage sector, increasing demand for pharmaceutical packaging, a growing focus on sustainable packaging solutions, and the adoption of advanced manufacturing technologies to enhance efficiency and productivity. Strategic partnerships between glass manufacturers and packaging companies are also fostering innovation and market expansion.
Key Players Shaping the Container Glass Industry in India Market
- Piramal Glass Limited
- AGI Glaspac (HSIL Ltd)
- Schott Kaisha Pvt Ltd (SCHOTT AG)
- G M Overseas
- Borosil Glass Works Limited (Klasspack Pvt Ltd)
- Haldyn Glass Limited (HGL)
- Eagle Glass Deco (P ) Ltd
- Sunrise Glass Industries Private Limited
- Ajanta Bottle Pvt Ltd
- Gerresheimer AG
- Empire Industries Limited- Vitrum Glass
(List Not Exhaustive)
Notable Milestones in Container Glass Industry in India Sector
- March 2023: SCHOTT started producing amber pharmaceutical glass in India, significantly increasing medical glass production capacity to meet Asian demand.
- January 2022: AGI Glaspac announced a new, large-scale glass manufacturing facility in Hyderabad, boosting domestic and export capacity.
In-Depth Container Glass Industry in India Market Outlook
The Indian container glass market is poised for robust growth in the coming years, driven by factors such as increasing demand from various end-use segments, rising disposable incomes, and government support for sustainable packaging solutions. Strategic investments in advanced technologies and capacity expansions are further enhancing the industry's competitiveness. The market is expected to present significant opportunities for both established players and new entrants seeking to capitalize on the growing demand for high-quality and sustainable glass packaging.
Container Glass Industry in India Segmentation
-
1. End-User Industry
- 1.1. Food
- 1.2. Beverage
- 1.3. Cosmetics & Perfumery
- 1.4. Pharmaceuticals
Container Glass Industry in India Segmentation By Geography
-
1. North America
- 1.1. United States
- 1.2. Canada
- 1.3. Mexico
-
2. South America
- 2.1. Brazil
- 2.2. Argentina
- 2.3. Rest of South America
-
3. Europe
- 3.1. United Kingdom
- 3.2. Germany
- 3.3. France
- 3.4. Italy
- 3.5. Spain
- 3.6. Russia
- 3.7. Benelux
- 3.8. Nordics
- 3.9. Rest of Europe
-
4. Middle East & Africa
- 4.1. Turkey
- 4.2. Israel
- 4.3. GCC
- 4.4. North Africa
- 4.5. South Africa
- 4.6. Rest of Middle East & Africa
-
5. Asia Pacific
- 5.1. China
- 5.2. India
- 5.3. Japan
- 5.4. South Korea
- 5.5. ASEAN
- 5.6. Oceania
- 5.7. Rest of Asia Pacific
Container Glass Industry in India REPORT HIGHLIGHTS
| Aspects | Details |
|---|---|
| Study Period | 2019-2033 |
| Base Year | 2024 |
| Estimated Year | 2025 |
| Forecast Period | 2025-2033 |
| Historical Period | 2019-2024 |
| Growth Rate | CAGR of 15.96% from 2019-2033 |
| Segmentation |
|
Table of Contents
- 1. Introduction
- 1.1. Research Scope
- 1.2. Market Segmentation
- 1.3. Research Methodology
- 1.4. Definitions and Assumptions
- 2. Executive Summary
- 2.1. Introduction
- 3. Market Dynamics
- 3.1. Introduction
- 3.2. Market Drivers
- 3.2.1. Increased Beverage Consumption in India
- 3.3. Market Restrains
- 3.3.1. Higher Carbon Footprint Glass Manufacturing
- 3.4. Market Trends
- 3.4.1. Increased Liquor Consumption in India is Contributing Significantly to the Market
- 4. Market Factor Analysis
- 4.1. Porters Five Forces
- 4.2. Supply/Value Chain
- 4.3. PESTEL analysis
- 4.4. Market Entropy
- 4.5. Patent/Trademark Analysis
- 5. Global Container Glass Industry in India Analysis, Insights and Forecast, 2019-2031
- 5.1. Market Analysis, Insights and Forecast - by End-User Industry
- 5.1.1. Food
- 5.1.2. Beverage
- 5.1.3. Cosmetics & Perfumery
- 5.1.4. Pharmaceuticals
- 5.2. Market Analysis, Insights and Forecast - by Region
- 5.2.1. North America
- 5.2.2. South America
- 5.2.3. Europe
- 5.2.4. Middle East & Africa
- 5.2.5. Asia Pacific
- 5.1. Market Analysis, Insights and Forecast - by End-User Industry
- 6. North America Container Glass Industry in India Analysis, Insights and Forecast, 2019-2031
- 6.1. Market Analysis, Insights and Forecast - by End-User Industry
- 6.1.1. Food
- 6.1.2. Beverage
- 6.1.3. Cosmetics & Perfumery
- 6.1.4. Pharmaceuticals
- 6.1. Market Analysis, Insights and Forecast - by End-User Industry
- 7. South America Container Glass Industry in India Analysis, Insights and Forecast, 2019-2031
- 7.1. Market Analysis, Insights and Forecast - by End-User Industry
- 7.1.1. Food
- 7.1.2. Beverage
- 7.1.3. Cosmetics & Perfumery
- 7.1.4. Pharmaceuticals
- 7.1. Market Analysis, Insights and Forecast - by End-User Industry
- 8. Europe Container Glass Industry in India Analysis, Insights and Forecast, 2019-2031
- 8.1. Market Analysis, Insights and Forecast - by End-User Industry
- 8.1.1. Food
- 8.1.2. Beverage
- 8.1.3. Cosmetics & Perfumery
- 8.1.4. Pharmaceuticals
- 8.1. Market Analysis, Insights and Forecast - by End-User Industry
- 9. Middle East & Africa Container Glass Industry in India Analysis, Insights and Forecast, 2019-2031
- 9.1. Market Analysis, Insights and Forecast - by End-User Industry
- 9.1.1. Food
- 9.1.2. Beverage
- 9.1.3. Cosmetics & Perfumery
- 9.1.4. Pharmaceuticals
- 9.1. Market Analysis, Insights and Forecast - by End-User Industry
- 10. Asia Pacific Container Glass Industry in India Analysis, Insights and Forecast, 2019-2031
- 10.1. Market Analysis, Insights and Forecast - by End-User Industry
- 10.1.1. Food
- 10.1.2. Beverage
- 10.1.3. Cosmetics & Perfumery
- 10.1.4. Pharmaceuticals
- 10.1. Market Analysis, Insights and Forecast - by End-User Industry
- 11. North India Container Glass Industry in India Analysis, Insights and Forecast, 2019-2031
- 12. South India Container Glass Industry in India Analysis, Insights and Forecast, 2019-2031
- 13. East India Container Glass Industry in India Analysis, Insights and Forecast, 2019-2031
- 14. West India Container Glass Industry in India Analysis, Insights and Forecast, 2019-2031
- 15. Competitive Analysis
- 15.1. Global Market Share Analysis 2024
- 15.2. Company Profiles
- 15.2.1 Piramal Glass Limited
- 15.2.1.1. Overview
- 15.2.1.2. Products
- 15.2.1.3. SWOT Analysis
- 15.2.1.4. Recent Developments
- 15.2.1.5. Financials (Based on Availability)
- 15.2.2 AGI Glaspac (HSIL Ltd)
- 15.2.2.1. Overview
- 15.2.2.2. Products
- 15.2.2.3. SWOT Analysis
- 15.2.2.4. Recent Developments
- 15.2.2.5. Financials (Based on Availability)
- 15.2.3 Schott Kaisha Pvt Ltd (SCHOTT AG)
- 15.2.3.1. Overview
- 15.2.3.2. Products
- 15.2.3.3. SWOT Analysis
- 15.2.3.4. Recent Developments
- 15.2.3.5. Financials (Based on Availability)
- 15.2.4 G M Overseas
- 15.2.4.1. Overview
- 15.2.4.2. Products
- 15.2.4.3. SWOT Analysis
- 15.2.4.4. Recent Developments
- 15.2.4.5. Financials (Based on Availability)
- 15.2.5 Borosil Glass Works Limited (Klasspack Pvt Ltd )
- 15.2.5.1. Overview
- 15.2.5.2. Products
- 15.2.5.3. SWOT Analysis
- 15.2.5.4. Recent Developments
- 15.2.5.5. Financials (Based on Availability)
- 15.2.6 Haldyn Glass Limited (HGL)
- 15.2.6.1. Overview
- 15.2.6.2. Products
- 15.2.6.3. SWOT Analysis
- 15.2.6.4. Recent Developments
- 15.2.6.5. Financials (Based on Availability)
- 15.2.7 Eagle Glass Deco (P ) Ltd *List Not Exhaustive
- 15.2.7.1. Overview
- 15.2.7.2. Products
- 15.2.7.3. SWOT Analysis
- 15.2.7.4. Recent Developments
- 15.2.7.5. Financials (Based on Availability)
- 15.2.8 Sunrise Glass Industries Private Limited
- 15.2.8.1. Overview
- 15.2.8.2. Products
- 15.2.8.3. SWOT Analysis
- 15.2.8.4. Recent Developments
- 15.2.8.5. Financials (Based on Availability)
- 15.2.9 Ajanta Bottle Pvt Ltd
- 15.2.9.1. Overview
- 15.2.9.2. Products
- 15.2.9.3. SWOT Analysis
- 15.2.9.4. Recent Developments
- 15.2.9.5. Financials (Based on Availability)
- 15.2.10 Gerresheimer AG
- 15.2.10.1. Overview
- 15.2.10.2. Products
- 15.2.10.3. SWOT Analysis
- 15.2.10.4. Recent Developments
- 15.2.10.5. Financials (Based on Availability)
- 15.2.11 Empire Industries Limited- Vitrum Glass
- 15.2.11.1. Overview
- 15.2.11.2. Products
- 15.2.11.3. SWOT Analysis
- 15.2.11.4. Recent Developments
- 15.2.11.5. Financials (Based on Availability)
- 15.2.1 Piramal Glass Limited
List of Figures
- Figure 1: Global Container Glass Industry in India Revenue Breakdown (Million, %) by Region 2024 & 2032
- Figure 2: India Container Glass Industry in India Revenue (Million), by Country 2024 & 2032
- Figure 3: India Container Glass Industry in India Revenue Share (%), by Country 2024 & 2032
- Figure 4: North America Container Glass Industry in India Revenue (Million), by End-User Industry 2024 & 2032
- Figure 5: North America Container Glass Industry in India Revenue Share (%), by End-User Industry 2024 & 2032
- Figure 6: North America Container Glass Industry in India Revenue (Million), by Country 2024 & 2032
- Figure 7: North America Container Glass Industry in India Revenue Share (%), by Country 2024 & 2032
- Figure 8: South America Container Glass Industry in India Revenue (Million), by End-User Industry 2024 & 2032
- Figure 9: South America Container Glass Industry in India Revenue Share (%), by End-User Industry 2024 & 2032
- Figure 10: South America Container Glass Industry in India Revenue (Million), by Country 2024 & 2032
- Figure 11: South America Container Glass Industry in India Revenue Share (%), by Country 2024 & 2032
- Figure 12: Europe Container Glass Industry in India Revenue (Million), by End-User Industry 2024 & 2032
- Figure 13: Europe Container Glass Industry in India Revenue Share (%), by End-User Industry 2024 & 2032
- Figure 14: Europe Container Glass Industry in India Revenue (Million), by Country 2024 & 2032
- Figure 15: Europe Container Glass Industry in India Revenue Share (%), by Country 2024 & 2032
- Figure 16: Middle East & Africa Container Glass Industry in India Revenue (Million), by End-User Industry 2024 & 2032
- Figure 17: Middle East & Africa Container Glass Industry in India Revenue Share (%), by End-User Industry 2024 & 2032
- Figure 18: Middle East & Africa Container Glass Industry in India Revenue (Million), by Country 2024 & 2032
- Figure 19: Middle East & Africa Container Glass Industry in India Revenue Share (%), by Country 2024 & 2032
- Figure 20: Asia Pacific Container Glass Industry in India Revenue (Million), by End-User Industry 2024 & 2032
- Figure 21: Asia Pacific Container Glass Industry in India Revenue Share (%), by End-User Industry 2024 & 2032
- Figure 22: Asia Pacific Container Glass Industry in India Revenue (Million), by Country 2024 & 2032
- Figure 23: Asia Pacific Container Glass Industry in India Revenue Share (%), by Country 2024 & 2032
List of Tables
- Table 1: Global Container Glass Industry in India Revenue Million Forecast, by Region 2019 & 2032
- Table 2: Global Container Glass Industry in India Revenue Million Forecast, by End-User Industry 2019 & 2032
- Table 3: Global Container Glass Industry in India Revenue Million Forecast, by Region 2019 & 2032
- Table 4: Global Container Glass Industry in India Revenue Million Forecast, by Country 2019 & 2032
- Table 5: North India Container Glass Industry in India Revenue (Million) Forecast, by Application 2019 & 2032
- Table 6: South India Container Glass Industry in India Revenue (Million) Forecast, by Application 2019 & 2032
- Table 7: East India Container Glass Industry in India Revenue (Million) Forecast, by Application 2019 & 2032
- Table 8: West India Container Glass Industry in India Revenue (Million) Forecast, by Application 2019 & 2032
- Table 9: Global Container Glass Industry in India Revenue Million Forecast, by End-User Industry 2019 & 2032
- Table 10: Global Container Glass Industry in India Revenue Million Forecast, by Country 2019 & 2032
- Table 11: United States Container Glass Industry in India Revenue (Million) Forecast, by Application 2019 & 2032
- Table 12: Canada Container Glass Industry in India Revenue (Million) Forecast, by Application 2019 & 2032
- Table 13: Mexico Container Glass Industry in India Revenue (Million) Forecast, by Application 2019 & 2032
- Table 14: Global Container Glass Industry in India Revenue Million Forecast, by End-User Industry 2019 & 2032
- Table 15: Global Container Glass Industry in India Revenue Million Forecast, by Country 2019 & 2032
- Table 16: Brazil Container Glass Industry in India Revenue (Million) Forecast, by Application 2019 & 2032
- Table 17: Argentina Container Glass Industry in India Revenue (Million) Forecast, by Application 2019 & 2032
- Table 18: Rest of South America Container Glass Industry in India Revenue (Million) Forecast, by Application 2019 & 2032
- Table 19: Global Container Glass Industry in India Revenue Million Forecast, by End-User Industry 2019 & 2032
- Table 20: Global Container Glass Industry in India Revenue Million Forecast, by Country 2019 & 2032
- Table 21: United Kingdom Container Glass Industry in India Revenue (Million) Forecast, by Application 2019 & 2032
- Table 22: Germany Container Glass Industry in India Revenue (Million) Forecast, by Application 2019 & 2032
- Table 23: France Container Glass Industry in India Revenue (Million) Forecast, by Application 2019 & 2032
- Table 24: Italy Container Glass Industry in India Revenue (Million) Forecast, by Application 2019 & 2032
- Table 25: Spain Container Glass Industry in India Revenue (Million) Forecast, by Application 2019 & 2032
- Table 26: Russia Container Glass Industry in India Revenue (Million) Forecast, by Application 2019 & 2032
- Table 27: Benelux Container Glass Industry in India Revenue (Million) Forecast, by Application 2019 & 2032
- Table 28: Nordics Container Glass Industry in India Revenue (Million) Forecast, by Application 2019 & 2032
- Table 29: Rest of Europe Container Glass Industry in India Revenue (Million) Forecast, by Application 2019 & 2032
- Table 30: Global Container Glass Industry in India Revenue Million Forecast, by End-User Industry 2019 & 2032
- Table 31: Global Container Glass Industry in India Revenue Million Forecast, by Country 2019 & 2032
- Table 32: Turkey Container Glass Industry in India Revenue (Million) Forecast, by Application 2019 & 2032
- Table 33: Israel Container Glass Industry in India Revenue (Million) Forecast, by Application 2019 & 2032
- Table 34: GCC Container Glass Industry in India Revenue (Million) Forecast, by Application 2019 & 2032
- Table 35: North Africa Container Glass Industry in India Revenue (Million) Forecast, by Application 2019 & 2032
- Table 36: South Africa Container Glass Industry in India Revenue (Million) Forecast, by Application 2019 & 2032
- Table 37: Rest of Middle East & Africa Container Glass Industry in India Revenue (Million) Forecast, by Application 2019 & 2032
- Table 38: Global Container Glass Industry in India Revenue Million Forecast, by End-User Industry 2019 & 2032
- Table 39: Global Container Glass Industry in India Revenue Million Forecast, by Country 2019 & 2032
- Table 40: China Container Glass Industry in India Revenue (Million) Forecast, by Application 2019 & 2032
- Table 41: India Container Glass Industry in India Revenue (Million) Forecast, by Application 2019 & 2032
- Table 42: Japan Container Glass Industry in India Revenue (Million) Forecast, by Application 2019 & 2032
- Table 43: South Korea Container Glass Industry in India Revenue (Million) Forecast, by Application 2019 & 2032
- Table 44: ASEAN Container Glass Industry in India Revenue (Million) Forecast, by Application 2019 & 2032
- Table 45: Oceania Container Glass Industry in India Revenue (Million) Forecast, by Application 2019 & 2032
- Table 46: Rest of Asia Pacific Container Glass Industry in India Revenue (Million) Forecast, by Application 2019 & 2032
Frequently Asked Questions
1. What is the projected Compound Annual Growth Rate (CAGR) of the Container Glass Industry in India?
The projected CAGR is approximately 15.96%.
2. Which companies are prominent players in the Container Glass Industry in India?
Key companies in the market include Piramal Glass Limited, AGI Glaspac (HSIL Ltd), Schott Kaisha Pvt Ltd (SCHOTT AG), G M Overseas, Borosil Glass Works Limited (Klasspack Pvt Ltd ), Haldyn Glass Limited (HGL), Eagle Glass Deco (P ) Ltd *List Not Exhaustive, Sunrise Glass Industries Private Limited, Ajanta Bottle Pvt Ltd, Gerresheimer AG, Empire Industries Limited- Vitrum Glass.
3. What are the main segments of the Container Glass Industry in India?
The market segments include End-User Industry.
4. Can you provide details about the market size?
The market size is estimated to be USD 12.25 Million as of 2022.
5. What are some drivers contributing to market growth?
Increased Beverage Consumption in India.
6. What are the notable trends driving market growth?
Increased Liquor Consumption in India is Contributing Significantly to the Market.
7. Are there any restraints impacting market growth?
Higher Carbon Footprint Glass Manufacturing.
8. Can you provide examples of recent developments in the market?
March - 2023 - SCHOTT started producing amber pharmaceutical glass in India to satisfy rising demand. The company invested significantly over the past three years to increase its medical glass production in India to fulfill the rising demand in Asia. The company's primary borosilicate glass tubing production plant is in Gujarat. This premium material is used to make pharmaceutical containers, including vials, ampoules, and syringes that are used to carry life-saving medications.
9. What pricing options are available for accessing the report?
Pricing options include single-user, multi-user, and enterprise licenses priced at USD 3800, USD 4500, and USD 5800 respectively.
10. Is the market size provided in terms of value or volume?
The market size is provided in terms of value, measured in Million.
11. Are there any specific market keywords associated with the report?
Yes, the market keyword associated with the report is "Container Glass Industry in India," which aids in identifying and referencing the specific market segment covered.
12. How do I determine which pricing option suits my needs best?
The pricing options vary based on user requirements and access needs. Individual users may opt for single-user licenses, while businesses requiring broader access may choose multi-user or enterprise licenses for cost-effective access to the report.
13. Are there any additional resources or data provided in the Container Glass Industry in India report?
While the report offers comprehensive insights, it's advisable to review the specific contents or supplementary materials provided to ascertain if additional resources or data are available.
14. How can I stay updated on further developments or reports in the Container Glass Industry in India?
To stay informed about further developments, trends, and reports in the Container Glass Industry in India, consider subscribing to industry newsletters, following relevant companies and organizations, or regularly checking reputable industry news sources and publications.
Methodology
Step 1 - Identification of Relevant Samples Size from Population Database


Step 2 - Approaches for Defining Global Market Size (Value, Volume* & Price*)

Note*: In applicable scenarios
Step 3 - Data Sources
Primary Research
- Web Analytics
- Survey Reports
- Research Institute
- Latest Research Reports
- Opinion Leaders
Secondary Research
- Annual Reports
- White Paper
- Latest Press Release
- Industry Association
- Paid Database
- Investor Presentations

Step 4 - Data Triangulation
Involves using different sources of information in order to increase the validity of a study
These sources are likely to be stakeholders in a program - participants, other researchers, program staff, other community members, and so on.
Then we put all data in single framework & apply various statistical tools to find out the dynamic on the market.
During the analysis stage, feedback from the stakeholder groups would be compared to determine areas of agreement as well as areas of divergence


