
Key Insights
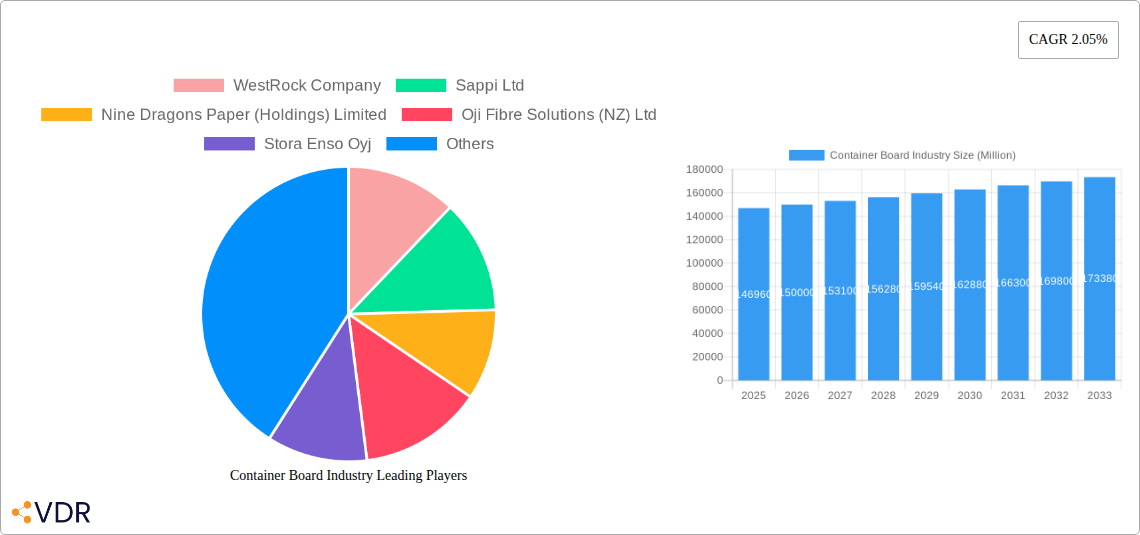
The global container board market, valued at $146.96 billion in 2025, is projected to experience steady growth, driven primarily by the burgeoning e-commerce sector and the increasing demand for sustainable packaging solutions. A compound annual growth rate (CAGR) of 2.05% from 2025 to 2033 indicates a consistent, albeit moderate, expansion. Key growth drivers include the rising consumption of packaged goods across various end-use industries, including food and beverage, consumer goods, and industrial sectors. The preference for lightweight yet durable packaging is also fueling demand, with recycled fiber content increasingly adopted to meet environmental regulations and consumer sustainability preferences. While the market faces restraints such as fluctuating raw material prices (primarily pulp) and potential supply chain disruptions, innovative product development, particularly in recycled and bio-based materials, is mitigating these challenges. The market segmentation reveals significant opportunities within the kraftliner segment, driven by its superior strength and cost-effectiveness, and within the rapidly expanding e-commerce packaging segment. Leading companies like WestRock, Smurfit Kappa, and International Paper are investing heavily in capacity expansions and technological advancements to capitalize on these trends. Regional growth will vary, with Asia-Pacific anticipated to show robust growth due to its expanding manufacturing and consumer base, while North America and Europe will maintain a significant market share due to established infrastructure and higher per capita consumption.
The diverse end-user segments present distinct growth trajectories. The food and beverage sector, with its ongoing need for safe and efficient packaging, remains a substantial driver. However, the rapidly growing e-commerce sector is expected to be a major catalyst for future growth, demanding innovative and sustainable packaging solutions designed for efficient distribution and product protection. The shift toward sustainable practices is pushing the adoption of recycled fibers, further segmenting the market and creating opportunities for companies focusing on eco-friendly solutions. Technological advancements in container board manufacturing, focused on enhanced efficiency and reduced environmental impact, are contributing to the market's evolution. Further diversification in product types, including specialized coatings and enhanced barrier properties, are adding value to the market and opening avenues for specialized applications. Competition is expected to remain intense, with larger players focusing on mergers and acquisitions to solidify their market position and expand their geographic reach.
Container Board Industry Market Report: 2019-2033
This comprehensive report provides an in-depth analysis of the global container board industry, encompassing market dynamics, growth trends, regional performance, product landscape, and key players. With a study period spanning 2019-2033, a base year of 2025, and a forecast period of 2025-2033, this report is an invaluable resource for industry professionals, investors, and strategic decision-makers. The parent market is the Packaging Industry and the child market is Container Board.
Container Board Industry Market Dynamics & Structure
The container board market is characterized by moderate concentration, with several large players holding significant market share. Technological innovation, driven by sustainability concerns and evolving e-commerce demands, is a key driver. Stringent environmental regulations, particularly concerning recycled content and waste reduction, shape industry practices. Competitive substitutes include alternative packaging materials like plastics and molded pulp, while end-user demographics are heavily influenced by consumer goods, food and beverage, and industrial sectors. Mergers and acquisitions (M&A) activity reflects consolidation trends and expansion strategies, with xx Million in M&A deals recorded in 2024.
- Market Concentration: Moderately concentrated, with top 5 players holding approximately xx% market share in 2024.
- Technological Innovation: Focus on lightweighting, improved barrier properties, and sustainable materials (recycled content).
- Regulatory Framework: Increasingly stringent environmental regulations impacting material sourcing and waste management.
- Competitive Substitutes: Plastics, molded pulp, and other sustainable packaging solutions pose a competitive threat.
- End-User Demographics: Significant demand from food & beverage, consumer goods, and industrial sectors.
- M&A Trends: Consolidation and expansion strategies driving significant M&A activity.
Container Board Industry Growth Trends & Insights
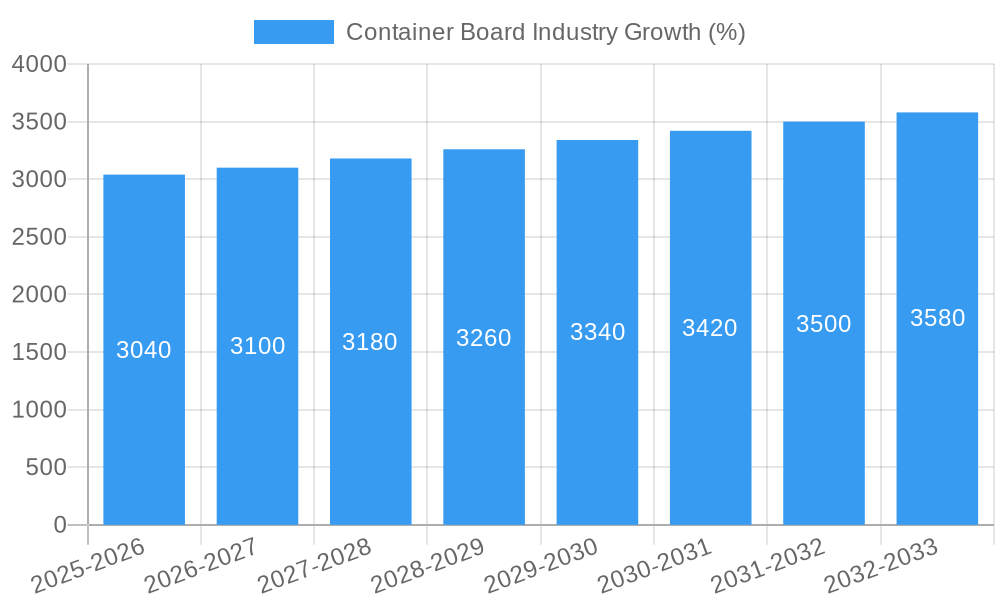
The global container board market exhibited a CAGR of xx% during 2019-2024, reaching a value of xx Million in 2024. Driven by robust growth in e-commerce, increased consumer spending, and the expanding global population, the market is expected to continue its upward trajectory, reaching xx Million by 2033 with a projected CAGR of xx% during 2025-2033. Technological advancements such as lightweighting and improved barrier properties are enhancing product appeal. Shifting consumer preferences towards sustainable and eco-friendly packaging are influencing material choices and production processes. Market penetration of recycled fiber content is steadily increasing.
Dominant Regions, Countries, or Segments in Container Board Industry
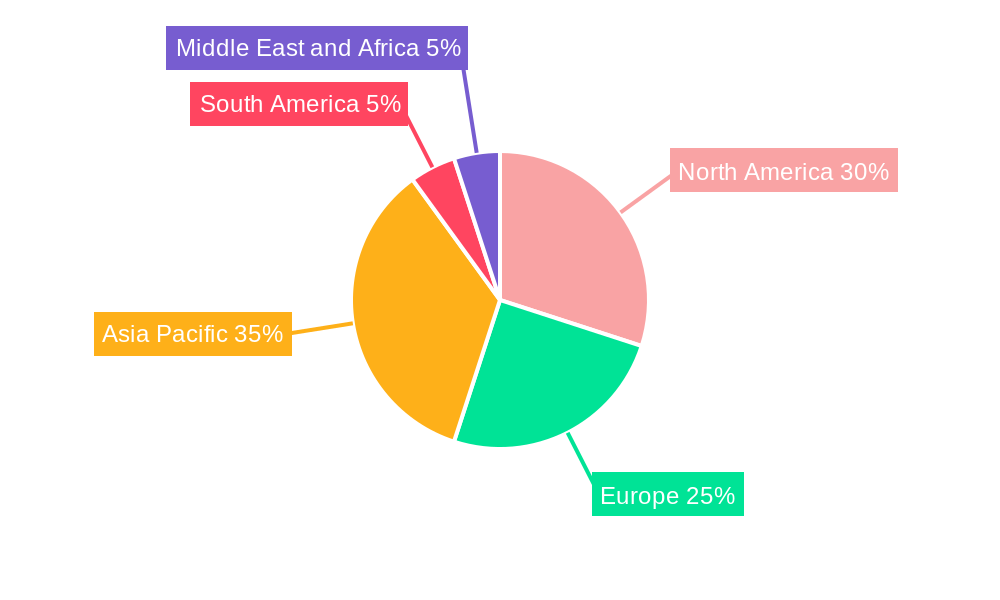
North America and Europe currently hold the largest market shares, driven by established economies and high consumer demand. However, Asia-Pacific is experiencing the fastest growth, fueled by rapid industrialization and urbanization. Within segments, Kraftliners dominate due to their strength and versatility, while recycled fiber usage is growing rapidly due to sustainability concerns. The Food and Beverage end-user segment demonstrates the strongest growth due to its reliance on corrugated packaging.
- Leading Region: North America (xx% market share in 2024)
- Fastest-Growing Region: Asia-Pacific (xx% CAGR projected during 2025-2033)
- Dominant Material: Recycled Fibers (xx% market share in 2024)
- Dominant Type: Kraftliners (xx% market share in 2024)
- Dominant End-User: Food and Beverage (xx% market share in 2024)
- Key Drivers: Economic growth, urbanization, e-commerce boom, sustainable packaging trends, and supportive government policies.
Container Board Industry Product Landscape
The container board market offers a wide range of products, including Kraftliners, Testliners, Flutings, and other specialized types like White Top liners. Innovation focuses on improved barrier properties, lightweighting for cost and environmental benefits, and enhanced printability. Unique selling propositions include customized designs, improved durability, and eco-friendly features. Technological advancements concentrate on optimizing fiber blends, refining manufacturing processes, and developing sustainable coating solutions.
Key Drivers, Barriers & Challenges in Container Board Industry
Key Drivers: Growing e-commerce, increasing consumer demand for packaged goods, and stringent environmental regulations promoting sustainable packaging solutions are major drivers. Technological advancements in lightweighting and improved barrier properties also contribute to market expansion.
Key Challenges: Fluctuations in raw material prices (pulp), supply chain disruptions, and intense competition among established players pose significant challenges. Regulatory compliance and the need for continuous innovation to meet evolving customer demands also present obstacles. The estimated impact of supply chain disruptions in 2024 led to a xx% decrease in production output.
Emerging Opportunities in Container Board Industry
Untapped markets in developing economies, the growing demand for specialized packaging solutions (e.g., sustainable packaging for food and beverages, customizable packaging for e-commerce), and the rising interest in innovative packaging technologies represent significant opportunities. Furthermore, catering to the increasing demand for eco-friendly packaging materials and sustainable production methods is expected to drive industry growth in the coming years.
Growth Accelerators in the Container Board Industry
Strategic partnerships to enhance supply chain efficiency, technological breakthroughs in materials science and manufacturing processes, and aggressive expansion into new geographic markets are crucial growth accelerators. Investments in R&D to develop innovative and sustainable container board solutions will play a vital role in long-term market expansion.
Key Players Shaping the Container Board Industry Market
- WestRock Company
- Sappi Ltd
- Nine Dragons Paper (Holdings) Limited
- Oji Fibre Solutions (NZ) Ltd
- Stora Enso Oyj
- Mitsubishi Corporation Packaging Ltd
- Smurfit Kappa Group
- Mondi Limited
- Svenska Cellulosa Aktiebolaget SCA
- Georgia-Pacific LLC
- Cascades Inc
- International Paper
Notable Milestones in Container Board Industry Sector
- January 2022: The Smurfit Kappa Group PLC invested over USD 33 Million in Brazil to expand its Fortaleza plant.
- April 2022: DS Smith launched a single-material corrugated cardboard box for medical device e-commerce shipments.
In-Depth Container Board Industry Market Outlook
The container board industry is poised for robust growth, driven by the enduring demand for packaging in a burgeoning global economy. Strategic investments in sustainable materials, advanced manufacturing technologies, and expanding into high-growth markets will be pivotal to capturing market share and achieving long-term success. The continued focus on eco-friendly solutions and the adaptation of packaging to e-commerce trends will define the future landscape.
Container Board Industry Segmentation
-
1. Material
- 1.1. Virgin Fibers
- 1.2. Recycled Fibers
- 1.3. Virgin + Recycled Fibers
-
2. Type
- 2.1. Kraftliners
- 2.2. Testliners
- 2.3. Flutings
- 2.4. Other Types (White Top, etc.)
-
3. End User
- 3.1. Food and Beverage
- 3.2. Consumer Goods
- 3.3. Industrial
- 3.4. Other End Users
Container Board Industry Segmentation By Geography
- 1. North America
- 2. Europe
- 3. Asia Pacific
- 4. South America
- 5. Middle East and Africa
Container Board Industry REPORT HIGHLIGHTS
| Aspects | Details |
|---|---|
| Study Period | 2019-2033 |
| Base Year | 2024 |
| Estimated Year | 2025 |
| Forecast Period | 2025-2033 |
| Historical Period | 2019-2024 |
| Growth Rate | CAGR of 2.05% from 2019-2033 |
| Segmentation |
|
Table of Contents
- 1. Introduction
- 1.1. Research Scope
- 1.2. Market Segmentation
- 1.3. Research Methodology
- 1.4. Definitions and Assumptions
- 2. Executive Summary
- 2.1. Introduction
- 3. Market Dynamics
- 3.1. Introduction
- 3.2. Market Drivers
- 3.2.1. Increasing Shipments through E-commerce; Increasing Demand for Processed and Packaged Foods; Environmental Concerns Leading to the High Demand for Recycled Packaging Solutions
- 3.3. Market Restrains
- 3.3.1. Availability of Alternative Packaging Solutions
- 3.4. Market Trends
- 3.4.1. Food and Beverage sector to witness the growth
- 4. Market Factor Analysis
- 4.1. Porters Five Forces
- 4.2. Supply/Value Chain
- 4.3. PESTEL analysis
- 4.4. Market Entropy
- 4.5. Patent/Trademark Analysis
- 5. Global Container Board Industry Analysis, Insights and Forecast, 2019-2031
- 5.1. Market Analysis, Insights and Forecast - by Material
- 5.1.1. Virgin Fibers
- 5.1.2. Recycled Fibers
- 5.1.3. Virgin + Recycled Fibers
- 5.2. Market Analysis, Insights and Forecast - by Type
- 5.2.1. Kraftliners
- 5.2.2. Testliners
- 5.2.3. Flutings
- 5.2.4. Other Types (White Top, etc.)
- 5.3. Market Analysis, Insights and Forecast - by End User
- 5.3.1. Food and Beverage
- 5.3.2. Consumer Goods
- 5.3.3. Industrial
- 5.3.4. Other End Users
- 5.4. Market Analysis, Insights and Forecast - by Region
- 5.4.1. North America
- 5.4.2. Europe
- 5.4.3. Asia Pacific
- 5.4.4. South America
- 5.4.5. Middle East and Africa
- 5.1. Market Analysis, Insights and Forecast - by Material
- 6. North America Container Board Industry Analysis, Insights and Forecast, 2019-2031
- 6.1. Market Analysis, Insights and Forecast - by Material
- 6.1.1. Virgin Fibers
- 6.1.2. Recycled Fibers
- 6.1.3. Virgin + Recycled Fibers
- 6.2. Market Analysis, Insights and Forecast - by Type
- 6.2.1. Kraftliners
- 6.2.2. Testliners
- 6.2.3. Flutings
- 6.2.4. Other Types (White Top, etc.)
- 6.3. Market Analysis, Insights and Forecast - by End User
- 6.3.1. Food and Beverage
- 6.3.2. Consumer Goods
- 6.3.3. Industrial
- 6.3.4. Other End Users
- 6.1. Market Analysis, Insights and Forecast - by Material
- 7. Europe Container Board Industry Analysis, Insights and Forecast, 2019-2031
- 7.1. Market Analysis, Insights and Forecast - by Material
- 7.1.1. Virgin Fibers
- 7.1.2. Recycled Fibers
- 7.1.3. Virgin + Recycled Fibers
- 7.2. Market Analysis, Insights and Forecast - by Type
- 7.2.1. Kraftliners
- 7.2.2. Testliners
- 7.2.3. Flutings
- 7.2.4. Other Types (White Top, etc.)
- 7.3. Market Analysis, Insights and Forecast - by End User
- 7.3.1. Food and Beverage
- 7.3.2. Consumer Goods
- 7.3.3. Industrial
- 7.3.4. Other End Users
- 7.1. Market Analysis, Insights and Forecast - by Material
- 8. Asia Pacific Container Board Industry Analysis, Insights and Forecast, 2019-2031
- 8.1. Market Analysis, Insights and Forecast - by Material
- 8.1.1. Virgin Fibers
- 8.1.2. Recycled Fibers
- 8.1.3. Virgin + Recycled Fibers
- 8.2. Market Analysis, Insights and Forecast - by Type
- 8.2.1. Kraftliners
- 8.2.2. Testliners
- 8.2.3. Flutings
- 8.2.4. Other Types (White Top, etc.)
- 8.3. Market Analysis, Insights and Forecast - by End User
- 8.3.1. Food and Beverage
- 8.3.2. Consumer Goods
- 8.3.3. Industrial
- 8.3.4. Other End Users
- 8.1. Market Analysis, Insights and Forecast - by Material
- 9. South America Container Board Industry Analysis, Insights and Forecast, 2019-2031
- 9.1. Market Analysis, Insights and Forecast - by Material
- 9.1.1. Virgin Fibers
- 9.1.2. Recycled Fibers
- 9.1.3. Virgin + Recycled Fibers
- 9.2. Market Analysis, Insights and Forecast - by Type
- 9.2.1. Kraftliners
- 9.2.2. Testliners
- 9.2.3. Flutings
- 9.2.4. Other Types (White Top, etc.)
- 9.3. Market Analysis, Insights and Forecast - by End User
- 9.3.1. Food and Beverage
- 9.3.2. Consumer Goods
- 9.3.3. Industrial
- 9.3.4. Other End Users
- 9.1. Market Analysis, Insights and Forecast - by Material
- 10. Middle East and Africa Container Board Industry Analysis, Insights and Forecast, 2019-2031
- 10.1. Market Analysis, Insights and Forecast - by Material
- 10.1.1. Virgin Fibers
- 10.1.2. Recycled Fibers
- 10.1.3. Virgin + Recycled Fibers
- 10.2. Market Analysis, Insights and Forecast - by Type
- 10.2.1. Kraftliners
- 10.2.2. Testliners
- 10.2.3. Flutings
- 10.2.4. Other Types (White Top, etc.)
- 10.3. Market Analysis, Insights and Forecast - by End User
- 10.3.1. Food and Beverage
- 10.3.2. Consumer Goods
- 10.3.3. Industrial
- 10.3.4. Other End Users
- 10.1. Market Analysis, Insights and Forecast - by Material
- 11. North America Container Board Industry Analysis, Insights and Forecast, 2019-2031
- 11.1. Market Analysis, Insights and Forecast - By Country/Sub-region
- 11.1.1.
- 12. Europe Container Board Industry Analysis, Insights and Forecast, 2019-2031
- 12.1. Market Analysis, Insights and Forecast - By Country/Sub-region
- 12.1.1.
- 13. Asia Pacific Container Board Industry Analysis, Insights and Forecast, 2019-2031
- 13.1. Market Analysis, Insights and Forecast - By Country/Sub-region
- 13.1.1.
- 14. South America Container Board Industry Analysis, Insights and Forecast, 2019-2031
- 14.1. Market Analysis, Insights and Forecast - By Country/Sub-region
- 14.1.1.
- 15. Middle East and Africa Container Board Industry Analysis, Insights and Forecast, 2019-2031
- 15.1. Market Analysis, Insights and Forecast - By Country/Sub-region
- 15.1.1.
- 16. Competitive Analysis
- 16.1. Global Market Share Analysis 2024
- 16.2. Company Profiles
- 16.2.1 WestRock Company
- 16.2.1.1. Overview
- 16.2.1.2. Products
- 16.2.1.3. SWOT Analysis
- 16.2.1.4. Recent Developments
- 16.2.1.5. Financials (Based on Availability)
- 16.2.2 Sappi Ltd
- 16.2.2.1. Overview
- 16.2.2.2. Products
- 16.2.2.3. SWOT Analysis
- 16.2.2.4. Recent Developments
- 16.2.2.5. Financials (Based on Availability)
- 16.2.3 Nine Dragons Paper (Holdings) Limited
- 16.2.3.1. Overview
- 16.2.3.2. Products
- 16.2.3.3. SWOT Analysis
- 16.2.3.4. Recent Developments
- 16.2.3.5. Financials (Based on Availability)
- 16.2.4 Oji Fibre Solutions (NZ) Ltd
- 16.2.4.1. Overview
- 16.2.4.2. Products
- 16.2.4.3. SWOT Analysis
- 16.2.4.4. Recent Developments
- 16.2.4.5. Financials (Based on Availability)
- 16.2.5 Stora Enso Oyj
- 16.2.5.1. Overview
- 16.2.5.2. Products
- 16.2.5.3. SWOT Analysis
- 16.2.5.4. Recent Developments
- 16.2.5.5. Financials (Based on Availability)
- 16.2.6 Mitsubishi Corporation Packaging Ltd
- 16.2.6.1. Overview
- 16.2.6.2. Products
- 16.2.6.3. SWOT Analysis
- 16.2.6.4. Recent Developments
- 16.2.6.5. Financials (Based on Availability)
- 16.2.7 Smurfit Kappa Group
- 16.2.7.1. Overview
- 16.2.7.2. Products
- 16.2.7.3. SWOT Analysis
- 16.2.7.4. Recent Developments
- 16.2.7.5. Financials (Based on Availability)
- 16.2.8 Mondi Limited
- 16.2.8.1. Overview
- 16.2.8.2. Products
- 16.2.8.3. SWOT Analysis
- 16.2.8.4. Recent Developments
- 16.2.8.5. Financials (Based on Availability)
- 16.2.9 Svenska Cellulosa Aktiebolaget SCA
- 16.2.9.1. Overview
- 16.2.9.2. Products
- 16.2.9.3. SWOT Analysis
- 16.2.9.4. Recent Developments
- 16.2.9.5. Financials (Based on Availability)
- 16.2.10 Georgia-Pacific LLC*List Not Exhaustive
- 16.2.10.1. Overview
- 16.2.10.2. Products
- 16.2.10.3. SWOT Analysis
- 16.2.10.4. Recent Developments
- 16.2.10.5. Financials (Based on Availability)
- 16.2.11 Cascades Inc
- 16.2.11.1. Overview
- 16.2.11.2. Products
- 16.2.11.3. SWOT Analysis
- 16.2.11.4. Recent Developments
- 16.2.11.5. Financials (Based on Availability)
- 16.2.12 International Paper
- 16.2.12.1. Overview
- 16.2.12.2. Products
- 16.2.12.3. SWOT Analysis
- 16.2.12.4. Recent Developments
- 16.2.12.5. Financials (Based on Availability)
- 16.2.1 WestRock Company
List of Figures
- Figure 1: Global Container Board Industry Revenue Breakdown (Million, %) by Region 2024 & 2032
- Figure 2: North America Container Board Industry Revenue (Million), by Country 2024 & 2032
- Figure 3: North America Container Board Industry Revenue Share (%), by Country 2024 & 2032
- Figure 4: Europe Container Board Industry Revenue (Million), by Country 2024 & 2032
- Figure 5: Europe Container Board Industry Revenue Share (%), by Country 2024 & 2032
- Figure 6: Asia Pacific Container Board Industry Revenue (Million), by Country 2024 & 2032
- Figure 7: Asia Pacific Container Board Industry Revenue Share (%), by Country 2024 & 2032
- Figure 8: South America Container Board Industry Revenue (Million), by Country 2024 & 2032
- Figure 9: South America Container Board Industry Revenue Share (%), by Country 2024 & 2032
- Figure 10: Middle East and Africa Container Board Industry Revenue (Million), by Country 2024 & 2032
- Figure 11: Middle East and Africa Container Board Industry Revenue Share (%), by Country 2024 & 2032
- Figure 12: North America Container Board Industry Revenue (Million), by Material 2024 & 2032
- Figure 13: North America Container Board Industry Revenue Share (%), by Material 2024 & 2032
- Figure 14: North America Container Board Industry Revenue (Million), by Type 2024 & 2032
- Figure 15: North America Container Board Industry Revenue Share (%), by Type 2024 & 2032
- Figure 16: North America Container Board Industry Revenue (Million), by End User 2024 & 2032
- Figure 17: North America Container Board Industry Revenue Share (%), by End User 2024 & 2032
- Figure 18: North America Container Board Industry Revenue (Million), by Country 2024 & 2032
- Figure 19: North America Container Board Industry Revenue Share (%), by Country 2024 & 2032
- Figure 20: Europe Container Board Industry Revenue (Million), by Material 2024 & 2032
- Figure 21: Europe Container Board Industry Revenue Share (%), by Material 2024 & 2032
- Figure 22: Europe Container Board Industry Revenue (Million), by Type 2024 & 2032
- Figure 23: Europe Container Board Industry Revenue Share (%), by Type 2024 & 2032
- Figure 24: Europe Container Board Industry Revenue (Million), by End User 2024 & 2032
- Figure 25: Europe Container Board Industry Revenue Share (%), by End User 2024 & 2032
- Figure 26: Europe Container Board Industry Revenue (Million), by Country 2024 & 2032
- Figure 27: Europe Container Board Industry Revenue Share (%), by Country 2024 & 2032
- Figure 28: Asia Pacific Container Board Industry Revenue (Million), by Material 2024 & 2032
- Figure 29: Asia Pacific Container Board Industry Revenue Share (%), by Material 2024 & 2032
- Figure 30: Asia Pacific Container Board Industry Revenue (Million), by Type 2024 & 2032
- Figure 31: Asia Pacific Container Board Industry Revenue Share (%), by Type 2024 & 2032
- Figure 32: Asia Pacific Container Board Industry Revenue (Million), by End User 2024 & 2032
- Figure 33: Asia Pacific Container Board Industry Revenue Share (%), by End User 2024 & 2032
- Figure 34: Asia Pacific Container Board Industry Revenue (Million), by Country 2024 & 2032
- Figure 35: Asia Pacific Container Board Industry Revenue Share (%), by Country 2024 & 2032
- Figure 36: South America Container Board Industry Revenue (Million), by Material 2024 & 2032
- Figure 37: South America Container Board Industry Revenue Share (%), by Material 2024 & 2032
- Figure 38: South America Container Board Industry Revenue (Million), by Type 2024 & 2032
- Figure 39: South America Container Board Industry Revenue Share (%), by Type 2024 & 2032
- Figure 40: South America Container Board Industry Revenue (Million), by End User 2024 & 2032
- Figure 41: South America Container Board Industry Revenue Share (%), by End User 2024 & 2032
- Figure 42: South America Container Board Industry Revenue (Million), by Country 2024 & 2032
- Figure 43: South America Container Board Industry Revenue Share (%), by Country 2024 & 2032
- Figure 44: Middle East and Africa Container Board Industry Revenue (Million), by Material 2024 & 2032
- Figure 45: Middle East and Africa Container Board Industry Revenue Share (%), by Material 2024 & 2032
- Figure 46: Middle East and Africa Container Board Industry Revenue (Million), by Type 2024 & 2032
- Figure 47: Middle East and Africa Container Board Industry Revenue Share (%), by Type 2024 & 2032
- Figure 48: Middle East and Africa Container Board Industry Revenue (Million), by End User 2024 & 2032
- Figure 49: Middle East and Africa Container Board Industry Revenue Share (%), by End User 2024 & 2032
- Figure 50: Middle East and Africa Container Board Industry Revenue (Million), by Country 2024 & 2032
- Figure 51: Middle East and Africa Container Board Industry Revenue Share (%), by Country 2024 & 2032
List of Tables
- Table 1: Global Container Board Industry Revenue Million Forecast, by Region 2019 & 2032
- Table 2: Global Container Board Industry Revenue Million Forecast, by Material 2019 & 2032
- Table 3: Global Container Board Industry Revenue Million Forecast, by Type 2019 & 2032
- Table 4: Global Container Board Industry Revenue Million Forecast, by End User 2019 & 2032
- Table 5: Global Container Board Industry Revenue Million Forecast, by Region 2019 & 2032
- Table 6: Global Container Board Industry Revenue Million Forecast, by Country 2019 & 2032
- Table 7: Container Board Industry Revenue (Million) Forecast, by Application 2019 & 2032
- Table 8: Global Container Board Industry Revenue Million Forecast, by Country 2019 & 2032
- Table 9: Container Board Industry Revenue (Million) Forecast, by Application 2019 & 2032
- Table 10: Global Container Board Industry Revenue Million Forecast, by Country 2019 & 2032
- Table 11: Container Board Industry Revenue (Million) Forecast, by Application 2019 & 2032
- Table 12: Global Container Board Industry Revenue Million Forecast, by Country 2019 & 2032
- Table 13: Container Board Industry Revenue (Million) Forecast, by Application 2019 & 2032
- Table 14: Global Container Board Industry Revenue Million Forecast, by Country 2019 & 2032
- Table 15: Container Board Industry Revenue (Million) Forecast, by Application 2019 & 2032
- Table 16: Global Container Board Industry Revenue Million Forecast, by Material 2019 & 2032
- Table 17: Global Container Board Industry Revenue Million Forecast, by Type 2019 & 2032
- Table 18: Global Container Board Industry Revenue Million Forecast, by End User 2019 & 2032
- Table 19: Global Container Board Industry Revenue Million Forecast, by Country 2019 & 2032
- Table 20: Global Container Board Industry Revenue Million Forecast, by Material 2019 & 2032
- Table 21: Global Container Board Industry Revenue Million Forecast, by Type 2019 & 2032
- Table 22: Global Container Board Industry Revenue Million Forecast, by End User 2019 & 2032
- Table 23: Global Container Board Industry Revenue Million Forecast, by Country 2019 & 2032
- Table 24: Global Container Board Industry Revenue Million Forecast, by Material 2019 & 2032
- Table 25: Global Container Board Industry Revenue Million Forecast, by Type 2019 & 2032
- Table 26: Global Container Board Industry Revenue Million Forecast, by End User 2019 & 2032
- Table 27: Global Container Board Industry Revenue Million Forecast, by Country 2019 & 2032
- Table 28: Global Container Board Industry Revenue Million Forecast, by Material 2019 & 2032
- Table 29: Global Container Board Industry Revenue Million Forecast, by Type 2019 & 2032
- Table 30: Global Container Board Industry Revenue Million Forecast, by End User 2019 & 2032
- Table 31: Global Container Board Industry Revenue Million Forecast, by Country 2019 & 2032
- Table 32: Global Container Board Industry Revenue Million Forecast, by Material 2019 & 2032
- Table 33: Global Container Board Industry Revenue Million Forecast, by Type 2019 & 2032
- Table 34: Global Container Board Industry Revenue Million Forecast, by End User 2019 & 2032
- Table 35: Global Container Board Industry Revenue Million Forecast, by Country 2019 & 2032
Frequently Asked Questions
1. What is the projected Compound Annual Growth Rate (CAGR) of the Container Board Industry?
The projected CAGR is approximately 2.05%.
2. Which companies are prominent players in the Container Board Industry?
Key companies in the market include WestRock Company, Sappi Ltd, Nine Dragons Paper (Holdings) Limited, Oji Fibre Solutions (NZ) Ltd, Stora Enso Oyj, Mitsubishi Corporation Packaging Ltd, Smurfit Kappa Group, Mondi Limited, Svenska Cellulosa Aktiebolaget SCA, Georgia-Pacific LLC*List Not Exhaustive, Cascades Inc, International Paper.
3. What are the main segments of the Container Board Industry?
The market segments include Material, Type, End User.
4. Can you provide details about the market size?
The market size is estimated to be USD 146.96 Million as of 2022.
5. What are some drivers contributing to market growth?
Increasing Shipments through E-commerce; Increasing Demand for Processed and Packaged Foods; Environmental Concerns Leading to the High Demand for Recycled Packaging Solutions.
6. What are the notable trends driving market growth?
Food and Beverage sector to witness the growth.
7. Are there any restraints impacting market growth?
Availability of Alternative Packaging Solutions.
8. Can you provide examples of recent developments in the market?
April 2022: DS Smith introduced a corrugated cardboard box for the e-commerce shipment of medical devices. The corrugated cardboard box features a single-material solution instead of glued packaging with a single-use plastic insert.
9. What pricing options are available for accessing the report?
Pricing options include single-user, multi-user, and enterprise licenses priced at USD 4750, USD 5250, and USD 8750 respectively.
10. Is the market size provided in terms of value or volume?
The market size is provided in terms of value, measured in Million.
11. Are there any specific market keywords associated with the report?
Yes, the market keyword associated with the report is "Container Board Industry," which aids in identifying and referencing the specific market segment covered.
12. How do I determine which pricing option suits my needs best?
The pricing options vary based on user requirements and access needs. Individual users may opt for single-user licenses, while businesses requiring broader access may choose multi-user or enterprise licenses for cost-effective access to the report.
13. Are there any additional resources or data provided in the Container Board Industry report?
While the report offers comprehensive insights, it's advisable to review the specific contents or supplementary materials provided to ascertain if additional resources or data are available.
14. How can I stay updated on further developments or reports in the Container Board Industry?
To stay informed about further developments, trends, and reports in the Container Board Industry, consider subscribing to industry newsletters, following relevant companies and organizations, or regularly checking reputable industry news sources and publications.
Methodology
Step 1 - Identification of Relevant Samples Size from Population Database


Step 2 - Approaches for Defining Global Market Size (Value, Volume* & Price*)

Note*: In applicable scenarios
Step 3 - Data Sources
Primary Research
- Web Analytics
- Survey Reports
- Research Institute
- Latest Research Reports
- Opinion Leaders
Secondary Research
- Annual Reports
- White Paper
- Latest Press Release
- Industry Association
- Paid Database
- Investor Presentations

Step 4 - Data Triangulation
Involves using different sources of information in order to increase the validity of a study
These sources are likely to be stakeholders in a program - participants, other researchers, program staff, other community members, and so on.
Then we put all data in single framework & apply various statistical tools to find out the dynamic on the market.
During the analysis stage, feedback from the stakeholder groups would be compared to determine areas of agreement as well as areas of divergence


