
Key Insights
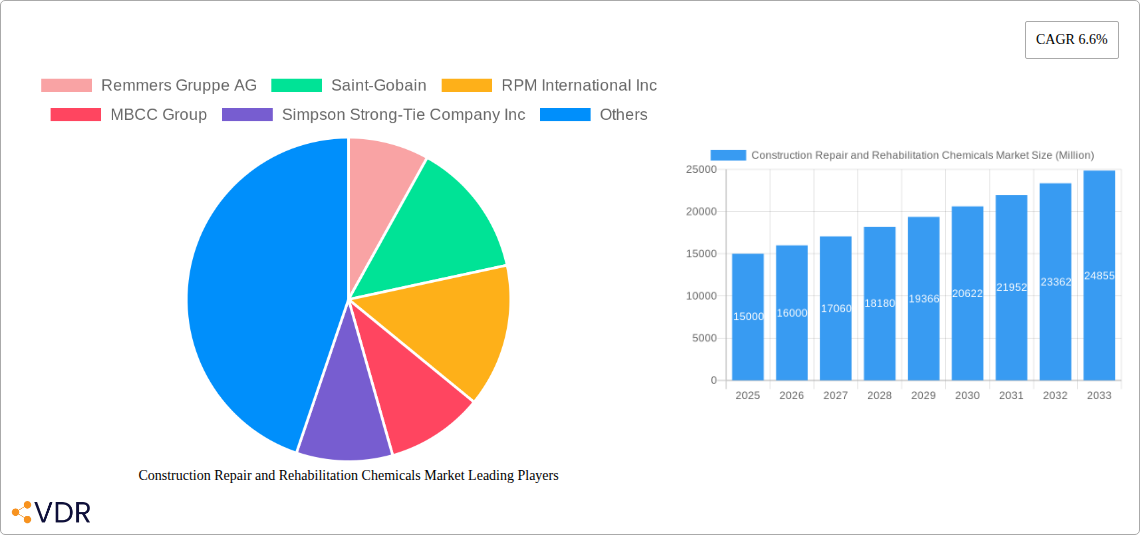
The Construction Repair and Rehabilitation Chemicals market is experiencing robust growth, driven by the increasing age of infrastructure globally, a rise in urbanization leading to higher building density and subsequent maintenance needs, and stringent regulations promoting building longevity and safety. A Compound Annual Growth Rate (CAGR) of 6.6% from 2019 to 2024 suggests a strong market trajectory, which is projected to continue into the forecast period (2025-2033). The market's segmentation highlights significant opportunities across various end-use sectors, with infrastructure and residential projects representing substantial portions of the market. Fiber wrapping systems, injection grouting materials, and modified mortars are among the key sub-products driving growth, reflecting a trend toward advanced materials offering improved durability and efficiency in repair and rehabilitation applications. The presence of established players like Saint-Gobain, Sika AG, and MAPEI S.p.A. indicates a mature market with competitive dynamics and ongoing innovation in product offerings. Regional analysis reveals that North America and Europe currently hold a significant market share, though the Asia-Pacific region is expected to witness substantial growth due to rapid urbanization and infrastructure development.
The market's growth is further bolstered by the increasing awareness of the long-term cost-effectiveness of proactive maintenance and repair compared to complete replacements. This trend is particularly evident in the adoption of innovative, eco-friendly repair solutions. However, factors like fluctuating raw material prices, economic downturns affecting construction activity, and potential labor shortages could pose challenges to sustained market growth. Despite these potential restraints, the overall outlook remains positive, with a continued focus on sustainable and high-performance construction repair and rehabilitation chemicals likely to shape the market landscape in the coming years. The market's success hinges on innovation in material science, ensuring product efficacy, sustainability, and compliance with increasingly stringent environmental regulations.
Construction Repair and Rehabilitation Chemicals Market: A Comprehensive Report (2019-2033)
This in-depth report provides a comprehensive analysis of the Construction Repair and Rehabilitation Chemicals market, encompassing market dynamics, growth trends, regional analysis, product landscape, and key player strategies. The study period covers 2019-2033, with 2025 as the base year and a forecast period extending to 2033. The market is segmented by end-use sector (Commercial, Industrial & Institutional, Infrastructure, Residential) and sub-product (Fiber Wrapping Systems, Injection Grouting Materials, Micro-concrete Mortars, Modified Mortars, Rebar Protectors). The total market size is projected to reach xx Million by 2033.
Construction Repair and Rehabilitation Chemicals Market Dynamics & Structure
The Construction Repair and Rehabilitation Chemicals market is characterized by moderate concentration, with key players like Sika AG, MAPEI S.p.A, and Saint-Gobain holding significant market share. Technological innovation, driven by the need for sustainable and high-performance materials, is a key driver. Stringent regulatory frameworks concerning environmental impact and worker safety influence product development and adoption. Competitive pressure from substitute materials like traditional repair methods exists, but the advantages of specialized chemicals in terms of efficiency and durability maintain market demand. The market is witnessing increased M&A activity, exemplified by Sika's acquisition of MBCC Group in May 2023, demonstrating consolidation trends and expansion strategies.
- Market Concentration: Moderately concentrated, with top 10 players holding approximately xx% market share in 2025.
- Technological Innovation: Focus on sustainable, high-performance, and easy-to-apply products.
- Regulatory Framework: Stringent environmental and safety regulations drive innovation and compliance costs.
- Competitive Substitutes: Traditional repair methods pose some competitive pressure.
- M&A Activity: Significant M&A activity observed, with a deal volume of xx in the last 5 years.
- End-User Demographics: Growing infrastructure projects and aging building stock fuel market growth.
Construction Repair and Rehabilitation Chemicals Market Growth Trends & Insights
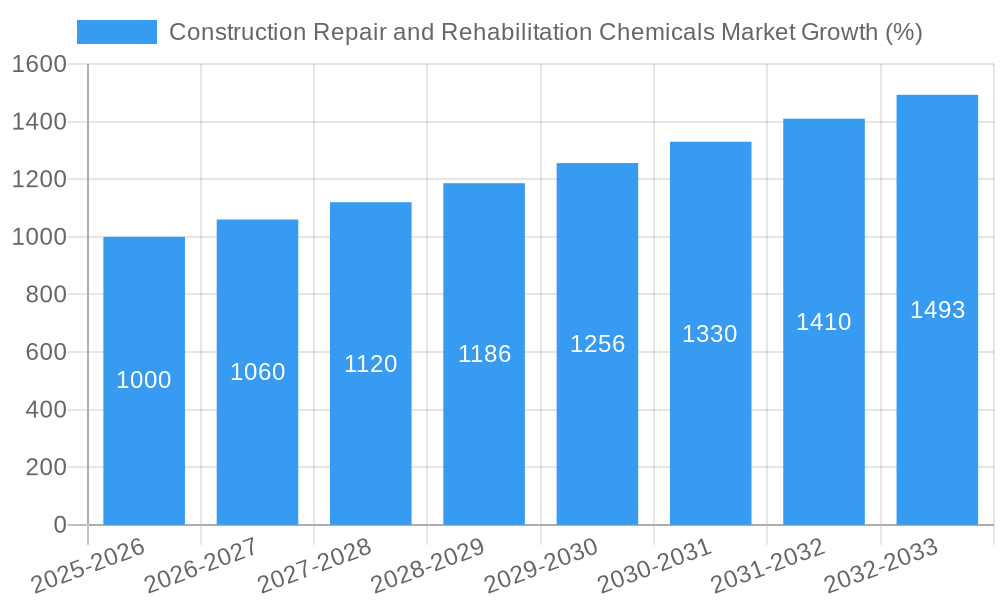
The Construction Repair and Rehabilitation Chemicals market exhibits a steady growth trajectory, driven by increasing infrastructure development globally, aging building stock requiring refurbishment, and a rising focus on building longevity and sustainability. The market size, valued at xx Million in 2025, is projected to grow at a CAGR of xx% during the forecast period (2025-2033), reaching xx Million by 2033. This growth is fueled by increased adoption of advanced repair techniques and a shift towards durable and sustainable construction practices. Technological disruptions, such as the development of self-healing concrete and advanced fiber-reinforced polymers, are further accelerating market growth. Changes in consumer behavior, focusing on energy efficiency and building longevity, are boosting demand for high-performance repair chemicals.
Dominant Regions, Countries, or Segments in Construction Repair and Rehabilitation Chemicals Market
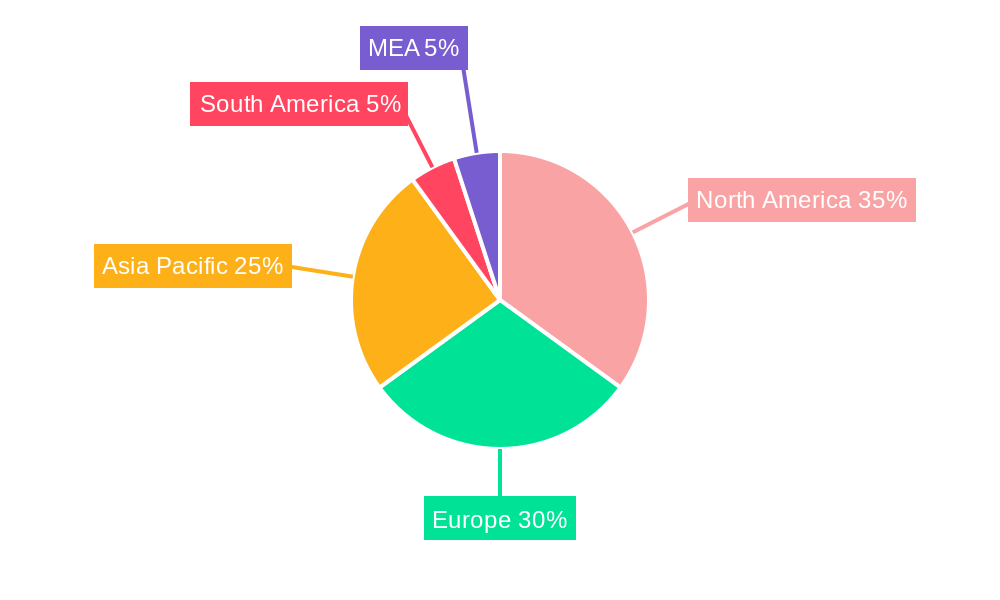
North America and Europe currently dominate the Construction Repair and Rehabilitation Chemicals market, driven by robust construction activity, stringent building codes, and well-established infrastructure. However, the Asia-Pacific region is poised for significant growth, fueled by rapid urbanization and infrastructure development. Within sub-products, Modified Mortars and Injection Grouting Materials hold a larger market share due to their versatility and wide-ranging applications. The Infrastructure segment shows highest growth potential, driven by large-scale government investments in repairing and upgrading aging infrastructure.
- Key Drivers:
- Growing infrastructure development (especially in APAC).
- Aging building stock in developed nations.
- Stringent building codes and regulations.
- Increasing focus on sustainable construction practices.
- Dominant Regions: North America and Europe (mature markets), Asia-Pacific (high growth potential).
- Dominant Segments: Modified Mortars and Injection Grouting Materials (by sub-product); Infrastructure (by end-use).
Construction Repair and Rehabilitation Chemicals Market Product Landscape
The product landscape is diverse, encompassing fiber wrapping systems, injection grouting materials, micro-concrete mortars, modified mortars, and rebar protectors. Continuous innovation focuses on enhancing product performance, durability, ease of application, and environmental sustainability. Unique selling propositions include improved bonding strength, enhanced crack resistance, and reduced curing times. Technological advancements such as incorporating nanomaterials and self-healing properties are shaping the future of repair and rehabilitation chemicals.
Key Drivers, Barriers & Challenges in Construction Repair and Rehabilitation Chemicals Market
Key Drivers: Rising infrastructure spending, increased focus on building renovations and retrofits, stringent building codes demanding durable materials, and growing awareness of sustainable construction practices are key drivers. Technological advancements leading to superior performance materials are also significant.
Key Challenges: Fluctuating raw material prices, stringent environmental regulations, and intense competition from established and emerging players present challenges. Supply chain disruptions can impact availability and increase costs. Regulatory hurdles for new product approvals and high initial investment costs for advanced technologies can also hinder growth.
Emerging Opportunities in Construction Repair and Rehabilitation Chemicals Market
Emerging opportunities lie in developing eco-friendly and sustainable products, expanding into untapped markets (e.g., developing economies), and focusing on specialized applications like seismic strengthening and historic preservation. Innovative applications, such as self-healing concrete and smart repair materials, offer significant potential. Meeting the growing demand for energy-efficient and durable building solutions is another promising avenue.
Growth Accelerators in the Construction Repair and Rehabilitation Chemicals Market Industry
Strategic partnerships between chemical manufacturers and construction companies, investment in R&D for advanced materials, and aggressive market expansion strategies into high-growth regions are crucial growth accelerators. Technological breakthroughs in materials science, leading to superior product performance and sustainable solutions, will drive long-term growth.
Key Players Shaping the Construction Repair and Rehabilitation Chemicals Market Market
- Remmers Gruppe AG
- Saint-Gobain
- RPM International Inc
- MBCC Group
- Simpson Strong-Tie Company Inc
- Fosroc Inc
- Ardex Group
- MAPEI S.p.A
- Sika AG
- MC-Bauchemie
Notable Milestones in Construction Repair and Rehabilitation Chemicals Market Sector
- May 2023: Sika acquired MBCC Group, significantly expanding its market share and product portfolio.
- December 2022: Sika AG opened a new manufacturing facility in Chongqing, China, boosting production capacity.
- June 2022: MAPEI commissioned a new manufacturing facility in Houston, Texas, to meet growing demand.
In-Depth Construction Repair and Rehabilitation Chemicals Market Market Outlook
The Construction Repair and Rehabilitation Chemicals market is poised for sustained growth, driven by global infrastructure investments, aging building stock, and a rising focus on sustainable construction. Strategic opportunities lie in developing innovative, high-performance, and eco-friendly products, expanding into emerging markets, and leveraging strategic partnerships. The market's future hinges on adapting to evolving regulatory landscapes and meeting the growing demands of a sustainable and resilient built environment.
Construction Repair and Rehabilitation Chemicals Market Segmentation
-
1. End Use Sector
- 1.1. Commercial
- 1.2. Industrial and Institutional
- 1.3. Infrastructure
- 1.4. Residential
-
2. Sub Product
- 2.1. Fiber Wrapping Systems
- 2.2. Injection Grouting Materials
- 2.3. Micro-concrete Mortars
- 2.4. Modified Mortars
- 2.5. Rebar Protectors
Construction Repair and Rehabilitation Chemicals Market Segmentation By Geography
-
1. North America
- 1.1. United States
- 1.2. Canada
- 1.3. Mexico
-
2. South America
- 2.1. Brazil
- 2.2. Argentina
- 2.3. Rest of South America
-
3. Europe
- 3.1. United Kingdom
- 3.2. Germany
- 3.3. France
- 3.4. Italy
- 3.5. Spain
- 3.6. Russia
- 3.7. Benelux
- 3.8. Nordics
- 3.9. Rest of Europe
-
4. Middle East & Africa
- 4.1. Turkey
- 4.2. Israel
- 4.3. GCC
- 4.4. North Africa
- 4.5. South Africa
- 4.6. Rest of Middle East & Africa
-
5. Asia Pacific
- 5.1. China
- 5.2. India
- 5.3. Japan
- 5.4. South Korea
- 5.5. ASEAN
- 5.6. Oceania
- 5.7. Rest of Asia Pacific
Construction Repair and Rehabilitation Chemicals Market REPORT HIGHLIGHTS
| Aspects | Details |
|---|---|
| Study Period | 2019-2033 |
| Base Year | 2024 |
| Estimated Year | 2025 |
| Forecast Period | 2025-2033 |
| Historical Period | 2019-2024 |
| Growth Rate | CAGR of 6.6% from 2019-2033 |
| Segmentation |
|
Table of Contents
- 1. Introduction
- 1.1. Research Scope
- 1.2. Market Segmentation
- 1.3. Research Methodology
- 1.4. Definitions and Assumptions
- 2. Executive Summary
- 2.1. Introduction
- 3. Market Dynamics
- 3.1. Introduction
- 3.2. Market Drivers
- 3.2.1. ; Banning/ Limiting Use of Plastics used in packaging applications
- 3.3. Market Restrains
- 3.3.1. ; Harmful Amines in Dyes; Paperless Green Initiatives
- 3.4. Market Trends
- 3.4.1. OTHER KEY INDUSTRY TRENDS COVERED IN THE REPORT
- 4. Market Factor Analysis
- 4.1. Porters Five Forces
- 4.2. Supply/Value Chain
- 4.3. PESTEL analysis
- 4.4. Market Entropy
- 4.5. Patent/Trademark Analysis
- 5. Global Construction Repair and Rehabilitation Chemicals Market Analysis, Insights and Forecast, 2019-2031
- 5.1. Market Analysis, Insights and Forecast - by End Use Sector
- 5.1.1. Commercial
- 5.1.2. Industrial and Institutional
- 5.1.3. Infrastructure
- 5.1.4. Residential
- 5.2. Market Analysis, Insights and Forecast - by Sub Product
- 5.2.1. Fiber Wrapping Systems
- 5.2.2. Injection Grouting Materials
- 5.2.3. Micro-concrete Mortars
- 5.2.4. Modified Mortars
- 5.2.5. Rebar Protectors
- 5.3. Market Analysis, Insights and Forecast - by Region
- 5.3.1. North America
- 5.3.2. South America
- 5.3.3. Europe
- 5.3.4. Middle East & Africa
- 5.3.5. Asia Pacific
- 5.1. Market Analysis, Insights and Forecast - by End Use Sector
- 6. North America Construction Repair and Rehabilitation Chemicals Market Analysis, Insights and Forecast, 2019-2031
- 6.1. Market Analysis, Insights and Forecast - by End Use Sector
- 6.1.1. Commercial
- 6.1.2. Industrial and Institutional
- 6.1.3. Infrastructure
- 6.1.4. Residential
- 6.2. Market Analysis, Insights and Forecast - by Sub Product
- 6.2.1. Fiber Wrapping Systems
- 6.2.2. Injection Grouting Materials
- 6.2.3. Micro-concrete Mortars
- 6.2.4. Modified Mortars
- 6.2.5. Rebar Protectors
- 6.1. Market Analysis, Insights and Forecast - by End Use Sector
- 7. South America Construction Repair and Rehabilitation Chemicals Market Analysis, Insights and Forecast, 2019-2031
- 7.1. Market Analysis, Insights and Forecast - by End Use Sector
- 7.1.1. Commercial
- 7.1.2. Industrial and Institutional
- 7.1.3. Infrastructure
- 7.1.4. Residential
- 7.2. Market Analysis, Insights and Forecast - by Sub Product
- 7.2.1. Fiber Wrapping Systems
- 7.2.2. Injection Grouting Materials
- 7.2.3. Micro-concrete Mortars
- 7.2.4. Modified Mortars
- 7.2.5. Rebar Protectors
- 7.1. Market Analysis, Insights and Forecast - by End Use Sector
- 8. Europe Construction Repair and Rehabilitation Chemicals Market Analysis, Insights and Forecast, 2019-2031
- 8.1. Market Analysis, Insights and Forecast - by End Use Sector
- 8.1.1. Commercial
- 8.1.2. Industrial and Institutional
- 8.1.3. Infrastructure
- 8.1.4. Residential
- 8.2. Market Analysis, Insights and Forecast - by Sub Product
- 8.2.1. Fiber Wrapping Systems
- 8.2.2. Injection Grouting Materials
- 8.2.3. Micro-concrete Mortars
- 8.2.4. Modified Mortars
- 8.2.5. Rebar Protectors
- 8.1. Market Analysis, Insights and Forecast - by End Use Sector
- 9. Middle East & Africa Construction Repair and Rehabilitation Chemicals Market Analysis, Insights and Forecast, 2019-2031
- 9.1. Market Analysis, Insights and Forecast - by End Use Sector
- 9.1.1. Commercial
- 9.1.2. Industrial and Institutional
- 9.1.3. Infrastructure
- 9.1.4. Residential
- 9.2. Market Analysis, Insights and Forecast - by Sub Product
- 9.2.1. Fiber Wrapping Systems
- 9.2.2. Injection Grouting Materials
- 9.2.3. Micro-concrete Mortars
- 9.2.4. Modified Mortars
- 9.2.5. Rebar Protectors
- 9.1. Market Analysis, Insights and Forecast - by End Use Sector
- 10. Asia Pacific Construction Repair and Rehabilitation Chemicals Market Analysis, Insights and Forecast, 2019-2031
- 10.1. Market Analysis, Insights and Forecast - by End Use Sector
- 10.1.1. Commercial
- 10.1.2. Industrial and Institutional
- 10.1.3. Infrastructure
- 10.1.4. Residential
- 10.2. Market Analysis, Insights and Forecast - by Sub Product
- 10.2.1. Fiber Wrapping Systems
- 10.2.2. Injection Grouting Materials
- 10.2.3. Micro-concrete Mortars
- 10.2.4. Modified Mortars
- 10.2.5. Rebar Protectors
- 10.1. Market Analysis, Insights and Forecast - by End Use Sector
- 11. North America Construction Repair and Rehabilitation Chemicals Market Analysis, Insights and Forecast, 2019-2031
- 11.1. Market Analysis, Insights and Forecast - By Country/Sub-region
- 11.1.1 United States
- 11.1.2 Canada
- 11.1.3 Mexico
- 12. Europe Construction Repair and Rehabilitation Chemicals Market Analysis, Insights and Forecast, 2019-2031
- 12.1. Market Analysis, Insights and Forecast - By Country/Sub-region
- 12.1.1 Germany
- 12.1.2 France
- 12.1.3 Italy
- 12.1.4 United Kingdom
- 12.1.5 Netherlands
- 12.1.6 Rest of Europe
- 13. Asia Pacific Construction Repair and Rehabilitation Chemicals Market Analysis, Insights and Forecast, 2019-2031
- 13.1. Market Analysis, Insights and Forecast - By Country/Sub-region
- 13.1.1 China
- 13.1.2 Japan
- 13.1.3 India
- 13.1.4 South Korea
- 13.1.5 Taiwan
- 13.1.6 Australia
- 13.1.7 Rest of Asia-Pacific
- 14. South America Construction Repair and Rehabilitation Chemicals Market Analysis, Insights and Forecast, 2019-2031
- 14.1. Market Analysis, Insights and Forecast - By Country/Sub-region
- 14.1.1 Brazil
- 14.1.2 Argentina
- 14.1.3 Rest of South America
- 15. MEA Construction Repair and Rehabilitation Chemicals Market Analysis, Insights and Forecast, 2019-2031
- 15.1. Market Analysis, Insights and Forecast - By Country/Sub-region
- 15.1.1 Middle East
- 15.1.2 Africa
- 16. Competitive Analysis
- 16.1. Global Market Share Analysis 2024
- 16.2. Company Profiles
- 16.2.1 Remmers Gruppe AG
- 16.2.1.1. Overview
- 16.2.1.2. Products
- 16.2.1.3. SWOT Analysis
- 16.2.1.4. Recent Developments
- 16.2.1.5. Financials (Based on Availability)
- 16.2.2 Saint-Gobain
- 16.2.2.1. Overview
- 16.2.2.2. Products
- 16.2.2.3. SWOT Analysis
- 16.2.2.4. Recent Developments
- 16.2.2.5. Financials (Based on Availability)
- 16.2.3 RPM International Inc
- 16.2.3.1. Overview
- 16.2.3.2. Products
- 16.2.3.3. SWOT Analysis
- 16.2.3.4. Recent Developments
- 16.2.3.5. Financials (Based on Availability)
- 16.2.4 MBCC Group
- 16.2.4.1. Overview
- 16.2.4.2. Products
- 16.2.4.3. SWOT Analysis
- 16.2.4.4. Recent Developments
- 16.2.4.5. Financials (Based on Availability)
- 16.2.5 Simpson Strong-Tie Company Inc
- 16.2.5.1. Overview
- 16.2.5.2. Products
- 16.2.5.3. SWOT Analysis
- 16.2.5.4. Recent Developments
- 16.2.5.5. Financials (Based on Availability)
- 16.2.6 Fosroc Inc
- 16.2.6.1. Overview
- 16.2.6.2. Products
- 16.2.6.3. SWOT Analysis
- 16.2.6.4. Recent Developments
- 16.2.6.5. Financials (Based on Availability)
- 16.2.7 Ardex Group
- 16.2.7.1. Overview
- 16.2.7.2. Products
- 16.2.7.3. SWOT Analysis
- 16.2.7.4. Recent Developments
- 16.2.7.5. Financials (Based on Availability)
- 16.2.8 MAPEI S p A
- 16.2.8.1. Overview
- 16.2.8.2. Products
- 16.2.8.3. SWOT Analysis
- 16.2.8.4. Recent Developments
- 16.2.8.5. Financials (Based on Availability)
- 16.2.9 Sika AG
- 16.2.9.1. Overview
- 16.2.9.2. Products
- 16.2.9.3. SWOT Analysis
- 16.2.9.4. Recent Developments
- 16.2.9.5. Financials (Based on Availability)
- 16.2.10 MC-Bauchemie
- 16.2.10.1. Overview
- 16.2.10.2. Products
- 16.2.10.3. SWOT Analysis
- 16.2.10.4. Recent Developments
- 16.2.10.5. Financials (Based on Availability)
- 16.2.1 Remmers Gruppe AG
List of Figures
- Figure 1: Global Construction Repair and Rehabilitation Chemicals Market Revenue Breakdown (Million, %) by Region 2024 & 2032
- Figure 2: Global Construction Repair and Rehabilitation Chemicals Market Volume Breakdown (K Tons, %) by Region 2024 & 2032
- Figure 3: North America Construction Repair and Rehabilitation Chemicals Market Revenue (Million), by Country 2024 & 2032
- Figure 4: North America Construction Repair and Rehabilitation Chemicals Market Volume (K Tons), by Country 2024 & 2032
- Figure 5: North America Construction Repair and Rehabilitation Chemicals Market Revenue Share (%), by Country 2024 & 2032
- Figure 6: North America Construction Repair and Rehabilitation Chemicals Market Volume Share (%), by Country 2024 & 2032
- Figure 7: Europe Construction Repair and Rehabilitation Chemicals Market Revenue (Million), by Country 2024 & 2032
- Figure 8: Europe Construction Repair and Rehabilitation Chemicals Market Volume (K Tons), by Country 2024 & 2032
- Figure 9: Europe Construction Repair and Rehabilitation Chemicals Market Revenue Share (%), by Country 2024 & 2032
- Figure 10: Europe Construction Repair and Rehabilitation Chemicals Market Volume Share (%), by Country 2024 & 2032
- Figure 11: Asia Pacific Construction Repair and Rehabilitation Chemicals Market Revenue (Million), by Country 2024 & 2032
- Figure 12: Asia Pacific Construction Repair and Rehabilitation Chemicals Market Volume (K Tons), by Country 2024 & 2032
- Figure 13: Asia Pacific Construction Repair and Rehabilitation Chemicals Market Revenue Share (%), by Country 2024 & 2032
- Figure 14: Asia Pacific Construction Repair and Rehabilitation Chemicals Market Volume Share (%), by Country 2024 & 2032
- Figure 15: South America Construction Repair and Rehabilitation Chemicals Market Revenue (Million), by Country 2024 & 2032
- Figure 16: South America Construction Repair and Rehabilitation Chemicals Market Volume (K Tons), by Country 2024 & 2032
- Figure 17: South America Construction Repair and Rehabilitation Chemicals Market Revenue Share (%), by Country 2024 & 2032
- Figure 18: South America Construction Repair and Rehabilitation Chemicals Market Volume Share (%), by Country 2024 & 2032
- Figure 19: MEA Construction Repair and Rehabilitation Chemicals Market Revenue (Million), by Country 2024 & 2032
- Figure 20: MEA Construction Repair and Rehabilitation Chemicals Market Volume (K Tons), by Country 2024 & 2032
- Figure 21: MEA Construction Repair and Rehabilitation Chemicals Market Revenue Share (%), by Country 2024 & 2032
- Figure 22: MEA Construction Repair and Rehabilitation Chemicals Market Volume Share (%), by Country 2024 & 2032
- Figure 23: North America Construction Repair and Rehabilitation Chemicals Market Revenue (Million), by End Use Sector 2024 & 2032
- Figure 24: North America Construction Repair and Rehabilitation Chemicals Market Volume (K Tons), by End Use Sector 2024 & 2032
- Figure 25: North America Construction Repair and Rehabilitation Chemicals Market Revenue Share (%), by End Use Sector 2024 & 2032
- Figure 26: North America Construction Repair and Rehabilitation Chemicals Market Volume Share (%), by End Use Sector 2024 & 2032
- Figure 27: North America Construction Repair and Rehabilitation Chemicals Market Revenue (Million), by Sub Product 2024 & 2032
- Figure 28: North America Construction Repair and Rehabilitation Chemicals Market Volume (K Tons), by Sub Product 2024 & 2032
- Figure 29: North America Construction Repair and Rehabilitation Chemicals Market Revenue Share (%), by Sub Product 2024 & 2032
- Figure 30: North America Construction Repair and Rehabilitation Chemicals Market Volume Share (%), by Sub Product 2024 & 2032
- Figure 31: North America Construction Repair and Rehabilitation Chemicals Market Revenue (Million), by Country 2024 & 2032
- Figure 32: North America Construction Repair and Rehabilitation Chemicals Market Volume (K Tons), by Country 2024 & 2032
- Figure 33: North America Construction Repair and Rehabilitation Chemicals Market Revenue Share (%), by Country 2024 & 2032
- Figure 34: North America Construction Repair and Rehabilitation Chemicals Market Volume Share (%), by Country 2024 & 2032
- Figure 35: South America Construction Repair and Rehabilitation Chemicals Market Revenue (Million), by End Use Sector 2024 & 2032
- Figure 36: South America Construction Repair and Rehabilitation Chemicals Market Volume (K Tons), by End Use Sector 2024 & 2032
- Figure 37: South America Construction Repair and Rehabilitation Chemicals Market Revenue Share (%), by End Use Sector 2024 & 2032
- Figure 38: South America Construction Repair and Rehabilitation Chemicals Market Volume Share (%), by End Use Sector 2024 & 2032
- Figure 39: South America Construction Repair and Rehabilitation Chemicals Market Revenue (Million), by Sub Product 2024 & 2032
- Figure 40: South America Construction Repair and Rehabilitation Chemicals Market Volume (K Tons), by Sub Product 2024 & 2032
- Figure 41: South America Construction Repair and Rehabilitation Chemicals Market Revenue Share (%), by Sub Product 2024 & 2032
- Figure 42: South America Construction Repair and Rehabilitation Chemicals Market Volume Share (%), by Sub Product 2024 & 2032
- Figure 43: South America Construction Repair and Rehabilitation Chemicals Market Revenue (Million), by Country 2024 & 2032
- Figure 44: South America Construction Repair and Rehabilitation Chemicals Market Volume (K Tons), by Country 2024 & 2032
- Figure 45: South America Construction Repair and Rehabilitation Chemicals Market Revenue Share (%), by Country 2024 & 2032
- Figure 46: South America Construction Repair and Rehabilitation Chemicals Market Volume Share (%), by Country 2024 & 2032
- Figure 47: Europe Construction Repair and Rehabilitation Chemicals Market Revenue (Million), by End Use Sector 2024 & 2032
- Figure 48: Europe Construction Repair and Rehabilitation Chemicals Market Volume (K Tons), by End Use Sector 2024 & 2032
- Figure 49: Europe Construction Repair and Rehabilitation Chemicals Market Revenue Share (%), by End Use Sector 2024 & 2032
- Figure 50: Europe Construction Repair and Rehabilitation Chemicals Market Volume Share (%), by End Use Sector 2024 & 2032
- Figure 51: Europe Construction Repair and Rehabilitation Chemicals Market Revenue (Million), by Sub Product 2024 & 2032
- Figure 52: Europe Construction Repair and Rehabilitation Chemicals Market Volume (K Tons), by Sub Product 2024 & 2032
- Figure 53: Europe Construction Repair and Rehabilitation Chemicals Market Revenue Share (%), by Sub Product 2024 & 2032
- Figure 54: Europe Construction Repair and Rehabilitation Chemicals Market Volume Share (%), by Sub Product 2024 & 2032
- Figure 55: Europe Construction Repair and Rehabilitation Chemicals Market Revenue (Million), by Country 2024 & 2032
- Figure 56: Europe Construction Repair and Rehabilitation Chemicals Market Volume (K Tons), by Country 2024 & 2032
- Figure 57: Europe Construction Repair and Rehabilitation Chemicals Market Revenue Share (%), by Country 2024 & 2032
- Figure 58: Europe Construction Repair and Rehabilitation Chemicals Market Volume Share (%), by Country 2024 & 2032
- Figure 59: Middle East & Africa Construction Repair and Rehabilitation Chemicals Market Revenue (Million), by End Use Sector 2024 & 2032
- Figure 60: Middle East & Africa Construction Repair and Rehabilitation Chemicals Market Volume (K Tons), by End Use Sector 2024 & 2032
- Figure 61: Middle East & Africa Construction Repair and Rehabilitation Chemicals Market Revenue Share (%), by End Use Sector 2024 & 2032
- Figure 62: Middle East & Africa Construction Repair and Rehabilitation Chemicals Market Volume Share (%), by End Use Sector 2024 & 2032
- Figure 63: Middle East & Africa Construction Repair and Rehabilitation Chemicals Market Revenue (Million), by Sub Product 2024 & 2032
- Figure 64: Middle East & Africa Construction Repair and Rehabilitation Chemicals Market Volume (K Tons), by Sub Product 2024 & 2032
- Figure 65: Middle East & Africa Construction Repair and Rehabilitation Chemicals Market Revenue Share (%), by Sub Product 2024 & 2032
- Figure 66: Middle East & Africa Construction Repair and Rehabilitation Chemicals Market Volume Share (%), by Sub Product 2024 & 2032
- Figure 67: Middle East & Africa Construction Repair and Rehabilitation Chemicals Market Revenue (Million), by Country 2024 & 2032
- Figure 68: Middle East & Africa Construction Repair and Rehabilitation Chemicals Market Volume (K Tons), by Country 2024 & 2032
- Figure 69: Middle East & Africa Construction Repair and Rehabilitation Chemicals Market Revenue Share (%), by Country 2024 & 2032
- Figure 70: Middle East & Africa Construction Repair and Rehabilitation Chemicals Market Volume Share (%), by Country 2024 & 2032
- Figure 71: Asia Pacific Construction Repair and Rehabilitation Chemicals Market Revenue (Million), by End Use Sector 2024 & 2032
- Figure 72: Asia Pacific Construction Repair and Rehabilitation Chemicals Market Volume (K Tons), by End Use Sector 2024 & 2032
- Figure 73: Asia Pacific Construction Repair and Rehabilitation Chemicals Market Revenue Share (%), by End Use Sector 2024 & 2032
- Figure 74: Asia Pacific Construction Repair and Rehabilitation Chemicals Market Volume Share (%), by End Use Sector 2024 & 2032
- Figure 75: Asia Pacific Construction Repair and Rehabilitation Chemicals Market Revenue (Million), by Sub Product 2024 & 2032
- Figure 76: Asia Pacific Construction Repair and Rehabilitation Chemicals Market Volume (K Tons), by Sub Product 2024 & 2032
- Figure 77: Asia Pacific Construction Repair and Rehabilitation Chemicals Market Revenue Share (%), by Sub Product 2024 & 2032
- Figure 78: Asia Pacific Construction Repair and Rehabilitation Chemicals Market Volume Share (%), by Sub Product 2024 & 2032
- Figure 79: Asia Pacific Construction Repair and Rehabilitation Chemicals Market Revenue (Million), by Country 2024 & 2032
- Figure 80: Asia Pacific Construction Repair and Rehabilitation Chemicals Market Volume (K Tons), by Country 2024 & 2032
- Figure 81: Asia Pacific Construction Repair and Rehabilitation Chemicals Market Revenue Share (%), by Country 2024 & 2032
- Figure 82: Asia Pacific Construction Repair and Rehabilitation Chemicals Market Volume Share (%), by Country 2024 & 2032
List of Tables
- Table 1: Global Construction Repair and Rehabilitation Chemicals Market Revenue Million Forecast, by Region 2019 & 2032
- Table 2: Global Construction Repair and Rehabilitation Chemicals Market Volume K Tons Forecast, by Region 2019 & 2032
- Table 3: Global Construction Repair and Rehabilitation Chemicals Market Revenue Million Forecast, by End Use Sector 2019 & 2032
- Table 4: Global Construction Repair and Rehabilitation Chemicals Market Volume K Tons Forecast, by End Use Sector 2019 & 2032
- Table 5: Global Construction Repair and Rehabilitation Chemicals Market Revenue Million Forecast, by Sub Product 2019 & 2032
- Table 6: Global Construction Repair and Rehabilitation Chemicals Market Volume K Tons Forecast, by Sub Product 2019 & 2032
- Table 7: Global Construction Repair and Rehabilitation Chemicals Market Revenue Million Forecast, by Region 2019 & 2032
- Table 8: Global Construction Repair and Rehabilitation Chemicals Market Volume K Tons Forecast, by Region 2019 & 2032
- Table 9: Global Construction Repair and Rehabilitation Chemicals Market Revenue Million Forecast, by Country 2019 & 2032
- Table 10: Global Construction Repair and Rehabilitation Chemicals Market Volume K Tons Forecast, by Country 2019 & 2032
- Table 11: United States Construction Repair and Rehabilitation Chemicals Market Revenue (Million) Forecast, by Application 2019 & 2032
- Table 12: United States Construction Repair and Rehabilitation Chemicals Market Volume (K Tons) Forecast, by Application 2019 & 2032
- Table 13: Canada Construction Repair and Rehabilitation Chemicals Market Revenue (Million) Forecast, by Application 2019 & 2032
- Table 14: Canada Construction Repair and Rehabilitation Chemicals Market Volume (K Tons) Forecast, by Application 2019 & 2032
- Table 15: Mexico Construction Repair and Rehabilitation Chemicals Market Revenue (Million) Forecast, by Application 2019 & 2032
- Table 16: Mexico Construction Repair and Rehabilitation Chemicals Market Volume (K Tons) Forecast, by Application 2019 & 2032
- Table 17: Global Construction Repair and Rehabilitation Chemicals Market Revenue Million Forecast, by Country 2019 & 2032
- Table 18: Global Construction Repair and Rehabilitation Chemicals Market Volume K Tons Forecast, by Country 2019 & 2032
- Table 19: Germany Construction Repair and Rehabilitation Chemicals Market Revenue (Million) Forecast, by Application 2019 & 2032
- Table 20: Germany Construction Repair and Rehabilitation Chemicals Market Volume (K Tons) Forecast, by Application 2019 & 2032
- Table 21: France Construction Repair and Rehabilitation Chemicals Market Revenue (Million) Forecast, by Application 2019 & 2032
- Table 22: France Construction Repair and Rehabilitation Chemicals Market Volume (K Tons) Forecast, by Application 2019 & 2032
- Table 23: Italy Construction Repair and Rehabilitation Chemicals Market Revenue (Million) Forecast, by Application 2019 & 2032
- Table 24: Italy Construction Repair and Rehabilitation Chemicals Market Volume (K Tons) Forecast, by Application 2019 & 2032
- Table 25: United Kingdom Construction Repair and Rehabilitation Chemicals Market Revenue (Million) Forecast, by Application 2019 & 2032
- Table 26: United Kingdom Construction Repair and Rehabilitation Chemicals Market Volume (K Tons) Forecast, by Application 2019 & 2032
- Table 27: Netherlands Construction Repair and Rehabilitation Chemicals Market Revenue (Million) Forecast, by Application 2019 & 2032
- Table 28: Netherlands Construction Repair and Rehabilitation Chemicals Market Volume (K Tons) Forecast, by Application 2019 & 2032
- Table 29: Rest of Europe Construction Repair and Rehabilitation Chemicals Market Revenue (Million) Forecast, by Application 2019 & 2032
- Table 30: Rest of Europe Construction Repair and Rehabilitation Chemicals Market Volume (K Tons) Forecast, by Application 2019 & 2032
- Table 31: Global Construction Repair and Rehabilitation Chemicals Market Revenue Million Forecast, by Country 2019 & 2032
- Table 32: Global Construction Repair and Rehabilitation Chemicals Market Volume K Tons Forecast, by Country 2019 & 2032
- Table 33: China Construction Repair and Rehabilitation Chemicals Market Revenue (Million) Forecast, by Application 2019 & 2032
- Table 34: China Construction Repair and Rehabilitation Chemicals Market Volume (K Tons) Forecast, by Application 2019 & 2032
- Table 35: Japan Construction Repair and Rehabilitation Chemicals Market Revenue (Million) Forecast, by Application 2019 & 2032
- Table 36: Japan Construction Repair and Rehabilitation Chemicals Market Volume (K Tons) Forecast, by Application 2019 & 2032
- Table 37: India Construction Repair and Rehabilitation Chemicals Market Revenue (Million) Forecast, by Application 2019 & 2032
- Table 38: India Construction Repair and Rehabilitation Chemicals Market Volume (K Tons) Forecast, by Application 2019 & 2032
- Table 39: South Korea Construction Repair and Rehabilitation Chemicals Market Revenue (Million) Forecast, by Application 2019 & 2032
- Table 40: South Korea Construction Repair and Rehabilitation Chemicals Market Volume (K Tons) Forecast, by Application 2019 & 2032
- Table 41: Taiwan Construction Repair and Rehabilitation Chemicals Market Revenue (Million) Forecast, by Application 2019 & 2032
- Table 42: Taiwan Construction Repair and Rehabilitation Chemicals Market Volume (K Tons) Forecast, by Application 2019 & 2032
- Table 43: Australia Construction Repair and Rehabilitation Chemicals Market Revenue (Million) Forecast, by Application 2019 & 2032
- Table 44: Australia Construction Repair and Rehabilitation Chemicals Market Volume (K Tons) Forecast, by Application 2019 & 2032
- Table 45: Rest of Asia-Pacific Construction Repair and Rehabilitation Chemicals Market Revenue (Million) Forecast, by Application 2019 & 2032
- Table 46: Rest of Asia-Pacific Construction Repair and Rehabilitation Chemicals Market Volume (K Tons) Forecast, by Application 2019 & 2032
- Table 47: Global Construction Repair and Rehabilitation Chemicals Market Revenue Million Forecast, by Country 2019 & 2032
- Table 48: Global Construction Repair and Rehabilitation Chemicals Market Volume K Tons Forecast, by Country 2019 & 2032
- Table 49: Brazil Construction Repair and Rehabilitation Chemicals Market Revenue (Million) Forecast, by Application 2019 & 2032
- Table 50: Brazil Construction Repair and Rehabilitation Chemicals Market Volume (K Tons) Forecast, by Application 2019 & 2032
- Table 51: Argentina Construction Repair and Rehabilitation Chemicals Market Revenue (Million) Forecast, by Application 2019 & 2032
- Table 52: Argentina Construction Repair and Rehabilitation Chemicals Market Volume (K Tons) Forecast, by Application 2019 & 2032
- Table 53: Rest of South America Construction Repair and Rehabilitation Chemicals Market Revenue (Million) Forecast, by Application 2019 & 2032
- Table 54: Rest of South America Construction Repair and Rehabilitation Chemicals Market Volume (K Tons) Forecast, by Application 2019 & 2032
- Table 55: Global Construction Repair and Rehabilitation Chemicals Market Revenue Million Forecast, by Country 2019 & 2032
- Table 56: Global Construction Repair and Rehabilitation Chemicals Market Volume K Tons Forecast, by Country 2019 & 2032
- Table 57: Middle East Construction Repair and Rehabilitation Chemicals Market Revenue (Million) Forecast, by Application 2019 & 2032
- Table 58: Middle East Construction Repair and Rehabilitation Chemicals Market Volume (K Tons) Forecast, by Application 2019 & 2032
- Table 59: Africa Construction Repair and Rehabilitation Chemicals Market Revenue (Million) Forecast, by Application 2019 & 2032
- Table 60: Africa Construction Repair and Rehabilitation Chemicals Market Volume (K Tons) Forecast, by Application 2019 & 2032
- Table 61: Global Construction Repair and Rehabilitation Chemicals Market Revenue Million Forecast, by End Use Sector 2019 & 2032
- Table 62: Global Construction Repair and Rehabilitation Chemicals Market Volume K Tons Forecast, by End Use Sector 2019 & 2032
- Table 63: Global Construction Repair and Rehabilitation Chemicals Market Revenue Million Forecast, by Sub Product 2019 & 2032
- Table 64: Global Construction Repair and Rehabilitation Chemicals Market Volume K Tons Forecast, by Sub Product 2019 & 2032
- Table 65: Global Construction Repair and Rehabilitation Chemicals Market Revenue Million Forecast, by Country 2019 & 2032
- Table 66: Global Construction Repair and Rehabilitation Chemicals Market Volume K Tons Forecast, by Country 2019 & 2032
- Table 67: United States Construction Repair and Rehabilitation Chemicals Market Revenue (Million) Forecast, by Application 2019 & 2032
- Table 68: United States Construction Repair and Rehabilitation Chemicals Market Volume (K Tons) Forecast, by Application 2019 & 2032
- Table 69: Canada Construction Repair and Rehabilitation Chemicals Market Revenue (Million) Forecast, by Application 2019 & 2032
- Table 70: Canada Construction Repair and Rehabilitation Chemicals Market Volume (K Tons) Forecast, by Application 2019 & 2032
- Table 71: Mexico Construction Repair and Rehabilitation Chemicals Market Revenue (Million) Forecast, by Application 2019 & 2032
- Table 72: Mexico Construction Repair and Rehabilitation Chemicals Market Volume (K Tons) Forecast, by Application 2019 & 2032
- Table 73: Global Construction Repair and Rehabilitation Chemicals Market Revenue Million Forecast, by End Use Sector 2019 & 2032
- Table 74: Global Construction Repair and Rehabilitation Chemicals Market Volume K Tons Forecast, by End Use Sector 2019 & 2032
- Table 75: Global Construction Repair and Rehabilitation Chemicals Market Revenue Million Forecast, by Sub Product 2019 & 2032
- Table 76: Global Construction Repair and Rehabilitation Chemicals Market Volume K Tons Forecast, by Sub Product 2019 & 2032
- Table 77: Global Construction Repair and Rehabilitation Chemicals Market Revenue Million Forecast, by Country 2019 & 2032
- Table 78: Global Construction Repair and Rehabilitation Chemicals Market Volume K Tons Forecast, by Country 2019 & 2032
- Table 79: Brazil Construction Repair and Rehabilitation Chemicals Market Revenue (Million) Forecast, by Application 2019 & 2032
- Table 80: Brazil Construction Repair and Rehabilitation Chemicals Market Volume (K Tons) Forecast, by Application 2019 & 2032
- Table 81: Argentina Construction Repair and Rehabilitation Chemicals Market Revenue (Million) Forecast, by Application 2019 & 2032
- Table 82: Argentina Construction Repair and Rehabilitation Chemicals Market Volume (K Tons) Forecast, by Application 2019 & 2032
- Table 83: Rest of South America Construction Repair and Rehabilitation Chemicals Market Revenue (Million) Forecast, by Application 2019 & 2032
- Table 84: Rest of South America Construction Repair and Rehabilitation Chemicals Market Volume (K Tons) Forecast, by Application 2019 & 2032
- Table 85: Global Construction Repair and Rehabilitation Chemicals Market Revenue Million Forecast, by End Use Sector 2019 & 2032
- Table 86: Global Construction Repair and Rehabilitation Chemicals Market Volume K Tons Forecast, by End Use Sector 2019 & 2032
- Table 87: Global Construction Repair and Rehabilitation Chemicals Market Revenue Million Forecast, by Sub Product 2019 & 2032
- Table 88: Global Construction Repair and Rehabilitation Chemicals Market Volume K Tons Forecast, by Sub Product 2019 & 2032
- Table 89: Global Construction Repair and Rehabilitation Chemicals Market Revenue Million Forecast, by Country 2019 & 2032
- Table 90: Global Construction Repair and Rehabilitation Chemicals Market Volume K Tons Forecast, by Country 2019 & 2032
- Table 91: United Kingdom Construction Repair and Rehabilitation Chemicals Market Revenue (Million) Forecast, by Application 2019 & 2032
- Table 92: United Kingdom Construction Repair and Rehabilitation Chemicals Market Volume (K Tons) Forecast, by Application 2019 & 2032
- Table 93: Germany Construction Repair and Rehabilitation Chemicals Market Revenue (Million) Forecast, by Application 2019 & 2032
- Table 94: Germany Construction Repair and Rehabilitation Chemicals Market Volume (K Tons) Forecast, by Application 2019 & 2032
- Table 95: France Construction Repair and Rehabilitation Chemicals Market Revenue (Million) Forecast, by Application 2019 & 2032
- Table 96: France Construction Repair and Rehabilitation Chemicals Market Volume (K Tons) Forecast, by Application 2019 & 2032
- Table 97: Italy Construction Repair and Rehabilitation Chemicals Market Revenue (Million) Forecast, by Application 2019 & 2032
- Table 98: Italy Construction Repair and Rehabilitation Chemicals Market Volume (K Tons) Forecast, by Application 2019 & 2032
- Table 99: Spain Construction Repair and Rehabilitation Chemicals Market Revenue (Million) Forecast, by Application 2019 & 2032
- Table 100: Spain Construction Repair and Rehabilitation Chemicals Market Volume (K Tons) Forecast, by Application 2019 & 2032
- Table 101: Russia Construction Repair and Rehabilitation Chemicals Market Revenue (Million) Forecast, by Application 2019 & 2032
- Table 102: Russia Construction Repair and Rehabilitation Chemicals Market Volume (K Tons) Forecast, by Application 2019 & 2032
- Table 103: Benelux Construction Repair and Rehabilitation Chemicals Market Revenue (Million) Forecast, by Application 2019 & 2032
- Table 104: Benelux Construction Repair and Rehabilitation Chemicals Market Volume (K Tons) Forecast, by Application 2019 & 2032
- Table 105: Nordics Construction Repair and Rehabilitation Chemicals Market Revenue (Million) Forecast, by Application 2019 & 2032
- Table 106: Nordics Construction Repair and Rehabilitation Chemicals Market Volume (K Tons) Forecast, by Application 2019 & 2032
- Table 107: Rest of Europe Construction Repair and Rehabilitation Chemicals Market Revenue (Million) Forecast, by Application 2019 & 2032
- Table 108: Rest of Europe Construction Repair and Rehabilitation Chemicals Market Volume (K Tons) Forecast, by Application 2019 & 2032
- Table 109: Global Construction Repair and Rehabilitation Chemicals Market Revenue Million Forecast, by End Use Sector 2019 & 2032
- Table 110: Global Construction Repair and Rehabilitation Chemicals Market Volume K Tons Forecast, by End Use Sector 2019 & 2032
- Table 111: Global Construction Repair and Rehabilitation Chemicals Market Revenue Million Forecast, by Sub Product 2019 & 2032
- Table 112: Global Construction Repair and Rehabilitation Chemicals Market Volume K Tons Forecast, by Sub Product 2019 & 2032
- Table 113: Global Construction Repair and Rehabilitation Chemicals Market Revenue Million Forecast, by Country 2019 & 2032
- Table 114: Global Construction Repair and Rehabilitation Chemicals Market Volume K Tons Forecast, by Country 2019 & 2032
- Table 115: Turkey Construction Repair and Rehabilitation Chemicals Market Revenue (Million) Forecast, by Application 2019 & 2032
- Table 116: Turkey Construction Repair and Rehabilitation Chemicals Market Volume (K Tons) Forecast, by Application 2019 & 2032
- Table 117: Israel Construction Repair and Rehabilitation Chemicals Market Revenue (Million) Forecast, by Application 2019 & 2032
- Table 118: Israel Construction Repair and Rehabilitation Chemicals Market Volume (K Tons) Forecast, by Application 2019 & 2032
- Table 119: GCC Construction Repair and Rehabilitation Chemicals Market Revenue (Million) Forecast, by Application 2019 & 2032
- Table 120: GCC Construction Repair and Rehabilitation Chemicals Market Volume (K Tons) Forecast, by Application 2019 & 2032
- Table 121: North Africa Construction Repair and Rehabilitation Chemicals Market Revenue (Million) Forecast, by Application 2019 & 2032
- Table 122: North Africa Construction Repair and Rehabilitation Chemicals Market Volume (K Tons) Forecast, by Application 2019 & 2032
- Table 123: South Africa Construction Repair and Rehabilitation Chemicals Market Revenue (Million) Forecast, by Application 2019 & 2032
- Table 124: South Africa Construction Repair and Rehabilitation Chemicals Market Volume (K Tons) Forecast, by Application 2019 & 2032
- Table 125: Rest of Middle East & Africa Construction Repair and Rehabilitation Chemicals Market Revenue (Million) Forecast, by Application 2019 & 2032
- Table 126: Rest of Middle East & Africa Construction Repair and Rehabilitation Chemicals Market Volume (K Tons) Forecast, by Application 2019 & 2032
- Table 127: Global Construction Repair and Rehabilitation Chemicals Market Revenue Million Forecast, by End Use Sector 2019 & 2032
- Table 128: Global Construction Repair and Rehabilitation Chemicals Market Volume K Tons Forecast, by End Use Sector 2019 & 2032
- Table 129: Global Construction Repair and Rehabilitation Chemicals Market Revenue Million Forecast, by Sub Product 2019 & 2032
- Table 130: Global Construction Repair and Rehabilitation Chemicals Market Volume K Tons Forecast, by Sub Product 2019 & 2032
- Table 131: Global Construction Repair and Rehabilitation Chemicals Market Revenue Million Forecast, by Country 2019 & 2032
- Table 132: Global Construction Repair and Rehabilitation Chemicals Market Volume K Tons Forecast, by Country 2019 & 2032
- Table 133: China Construction Repair and Rehabilitation Chemicals Market Revenue (Million) Forecast, by Application 2019 & 2032
- Table 134: China Construction Repair and Rehabilitation Chemicals Market Volume (K Tons) Forecast, by Application 2019 & 2032
- Table 135: India Construction Repair and Rehabilitation Chemicals Market Revenue (Million) Forecast, by Application 2019 & 2032
- Table 136: India Construction Repair and Rehabilitation Chemicals Market Volume (K Tons) Forecast, by Application 2019 & 2032
- Table 137: Japan Construction Repair and Rehabilitation Chemicals Market Revenue (Million) Forecast, by Application 2019 & 2032
- Table 138: Japan Construction Repair and Rehabilitation Chemicals Market Volume (K Tons) Forecast, by Application 2019 & 2032
- Table 139: South Korea Construction Repair and Rehabilitation Chemicals Market Revenue (Million) Forecast, by Application 2019 & 2032
- Table 140: South Korea Construction Repair and Rehabilitation Chemicals Market Volume (K Tons) Forecast, by Application 2019 & 2032
- Table 141: ASEAN Construction Repair and Rehabilitation Chemicals Market Revenue (Million) Forecast, by Application 2019 & 2032
- Table 142: ASEAN Construction Repair and Rehabilitation Chemicals Market Volume (K Tons) Forecast, by Application 2019 & 2032
- Table 143: Oceania Construction Repair and Rehabilitation Chemicals Market Revenue (Million) Forecast, by Application 2019 & 2032
- Table 144: Oceania Construction Repair and Rehabilitation Chemicals Market Volume (K Tons) Forecast, by Application 2019 & 2032
- Table 145: Rest of Asia Pacific Construction Repair and Rehabilitation Chemicals Market Revenue (Million) Forecast, by Application 2019 & 2032
- Table 146: Rest of Asia Pacific Construction Repair and Rehabilitation Chemicals Market Volume (K Tons) Forecast, by Application 2019 & 2032
Frequently Asked Questions
1. What is the projected Compound Annual Growth Rate (CAGR) of the Construction Repair and Rehabilitation Chemicals Market?
The projected CAGR is approximately 6.6%.
2. Which companies are prominent players in the Construction Repair and Rehabilitation Chemicals Market?
Key companies in the market include Remmers Gruppe AG, Saint-Gobain, RPM International Inc, MBCC Group, Simpson Strong-Tie Company Inc, Fosroc Inc, Ardex Group, MAPEI S p A, Sika AG, MC-Bauchemie.
3. What are the main segments of the Construction Repair and Rehabilitation Chemicals Market?
The market segments include End Use Sector, Sub Product.
4. Can you provide details about the market size?
The market size is estimated to be USD XX Million as of 2022.
5. What are some drivers contributing to market growth?
; Banning/ Limiting Use of Plastics used in packaging applications.
6. What are the notable trends driving market growth?
OTHER KEY INDUSTRY TRENDS COVERED IN THE REPORT.
7. Are there any restraints impacting market growth?
; Harmful Amines in Dyes; Paperless Green Initiatives.
8. Can you provide examples of recent developments in the market?
May 2023: Sika, a global leader in construction chemicals, acquired the MBCC Group, including its waterproofing solutions, anchors & grouts, flooring resins, repair & rehabilitation chemicals, and other businesses, with the exception of its concrete admixture operations in Europe, North America, Australia, and New Zealand.December 2022: Sika AG expanded its production capabilities in China with the establishment of a new manufacturing facility in Chongqing, located in the southwestern region of the country. This facility will focus on producing liquid waterproofing membranes and mortars.June 2022: To meet the growing demand for construction products like concrete admixtures, anchors & grouts, dry-mix mortars, and repair & rehabilitation chemicals, MAPEI commissioned the construction of a new manufacturing facility in Houston, Texas.
9. What pricing options are available for accessing the report?
Pricing options include single-user, multi-user, and enterprise licenses priced at USD 3800, USD 4500, and USD 5800 respectively.
10. Is the market size provided in terms of value or volume?
The market size is provided in terms of value, measured in Million and volume, measured in K Tons.
11. Are there any specific market keywords associated with the report?
Yes, the market keyword associated with the report is "Construction Repair and Rehabilitation Chemicals Market," which aids in identifying and referencing the specific market segment covered.
12. How do I determine which pricing option suits my needs best?
The pricing options vary based on user requirements and access needs. Individual users may opt for single-user licenses, while businesses requiring broader access may choose multi-user or enterprise licenses for cost-effective access to the report.
13. Are there any additional resources or data provided in the Construction Repair and Rehabilitation Chemicals Market report?
While the report offers comprehensive insights, it's advisable to review the specific contents or supplementary materials provided to ascertain if additional resources or data are available.
14. How can I stay updated on further developments or reports in the Construction Repair and Rehabilitation Chemicals Market?
To stay informed about further developments, trends, and reports in the Construction Repair and Rehabilitation Chemicals Market, consider subscribing to industry newsletters, following relevant companies and organizations, or regularly checking reputable industry news sources and publications.
Methodology
Step 1 - Identification of Relevant Samples Size from Population Database


Step 2 - Approaches for Defining Global Market Size (Value, Volume* & Price*)

Note*: In applicable scenarios
Step 3 - Data Sources
Primary Research
- Web Analytics
- Survey Reports
- Research Institute
- Latest Research Reports
- Opinion Leaders
Secondary Research
- Annual Reports
- White Paper
- Latest Press Release
- Industry Association
- Paid Database
- Investor Presentations

Step 4 - Data Triangulation
Involves using different sources of information in order to increase the validity of a study
These sources are likely to be stakeholders in a program - participants, other researchers, program staff, other community members, and so on.
Then we put all data in single framework & apply various statistical tools to find out the dynamic on the market.
During the analysis stage, feedback from the stakeholder groups would be compared to determine areas of agreement as well as areas of divergence


