

Key Insights
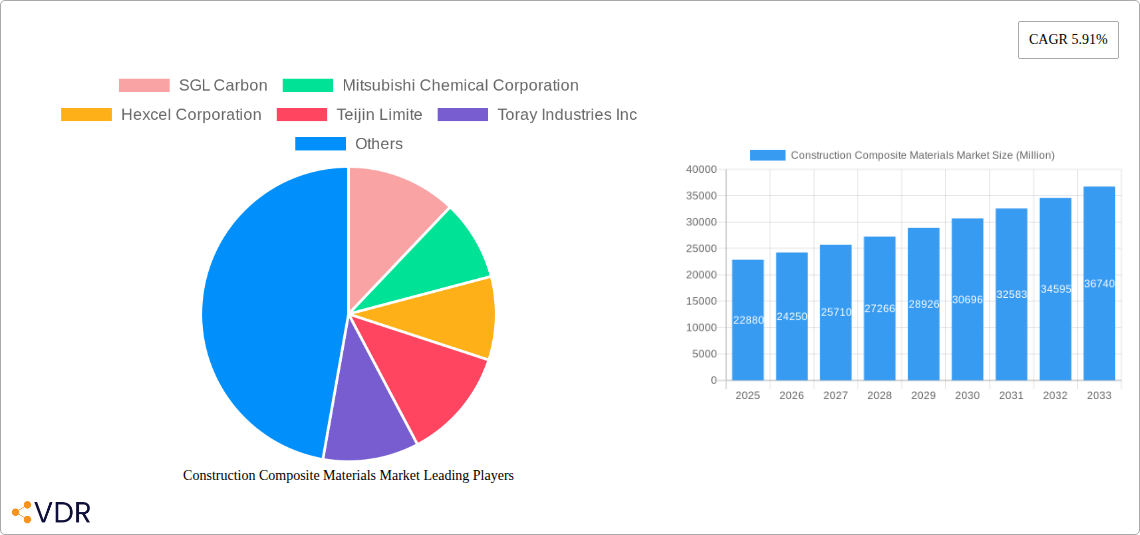
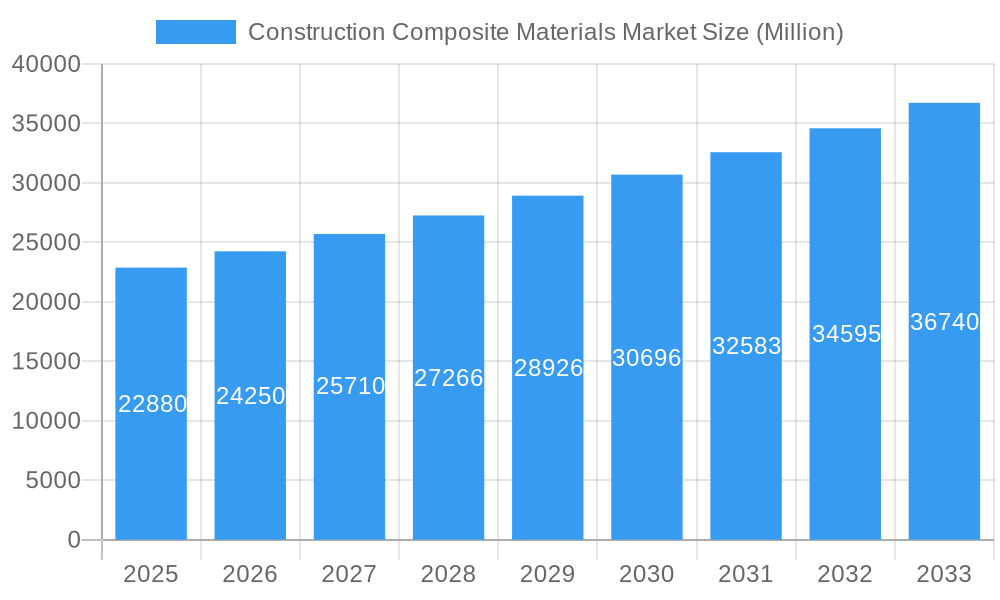
The global construction composite materials market, valued at $22.88 billion in 2025, is projected to experience robust growth, driven by the increasing demand for lightweight, high-strength, and durable building materials. This growth is fueled by several key factors. Firstly, the construction industry's ongoing push for sustainable and eco-friendly practices is boosting the adoption of composite materials, particularly those incorporating recycled or renewable components like natural fibers. Secondly, advancements in composite material technology are leading to improved performance characteristics, including enhanced fire resistance, weatherability, and impact strength, making them increasingly attractive for diverse applications. Furthermore, the rising infrastructure development globally, especially in emerging economies of Asia-Pacific and the Middle East, is significantly contributing to market expansion. The segment encompassing fiberglass-reinforced polymers (FRP) currently holds a dominant market share due to their cost-effectiveness and established applications. However, carbon fiber composites are gaining traction, albeit at a slower rate, due to their superior strength-to-weight ratio, primarily in high-performance construction projects. The market is segmented by resin type (polyester, vinyl ester, epoxy, etc.), fiber type (glass, carbon, natural), and end-use sector (industrial, commercial, housing, civil). While challenges remain, such as the relatively higher cost of some composite materials compared to traditional materials and concerns surrounding their recyclability, ongoing innovation and technological breakthroughs are expected to mitigate these factors in the long term.
Construction Composite Materials Market Market Size (In Billion)
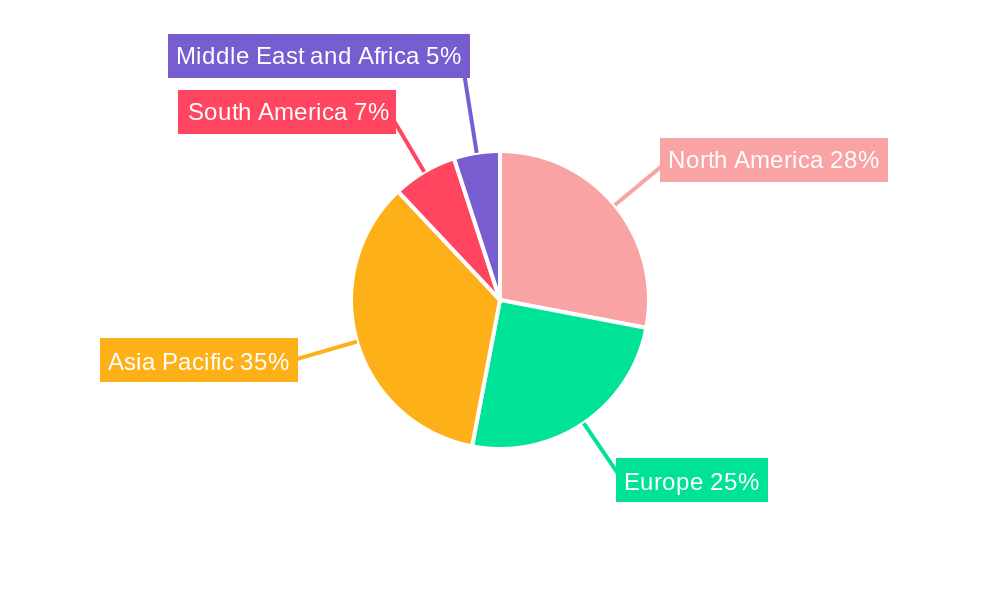
The market is geographically diverse, with Asia-Pacific exhibiting significant growth potential due to rapid urbanization and infrastructure development. North America and Europe also hold substantial market shares driven by robust construction activities and technological advancements. The competitive landscape features both large multinational corporations and specialized manufacturers, indicating a dynamic market with continuous innovation and competitive pricing. The projected Compound Annual Growth Rate (CAGR) of 5.91% from 2025 to 2033 suggests a substantial expansion of the market over the forecast period, with considerable opportunities for market participants specializing in advanced composite materials and innovative applications. Specific regional growth may vary based on factors such as government regulations, economic conditions, and the availability of skilled labor. Continuous monitoring of these factors will be crucial for strategic market players.
Construction Composite Materials Market Company Market Share
Construction Composite Materials Market: A Comprehensive Report (2019-2033)
This in-depth report provides a comprehensive analysis of the Construction Composite Materials market, encompassing market dynamics, growth trends, regional dominance, product landscape, key players, and future outlook. The report covers the period from 2019 to 2033, with 2025 serving as the base year and estimated year. This analysis delves into the parent market of construction materials and the child market of composite materials specifically used in construction. The market size is valued in Million units throughout.
Construction Composite Materials Market Dynamics & Structure
The Construction Composite Materials market is characterized by moderate concentration, with key players such as SGL Carbon, Mitsubishi Chemical Corporation, and Owens Corning holding significant market share (estimated at xx% collectively in 2025). Technological innovation, particularly in resin and fiber types, is a major driver, alongside stringent environmental regulations pushing for sustainable building materials. Competitive substitutes include traditional materials like steel and concrete, but composite materials offer advantages in terms of lightweight, strength, and durability. The end-user demographic is diverse, encompassing industrial, commercial, housing, and civil sectors. M&A activity is noticeable, with recent deals reflecting consolidation and expansion efforts within the market. For example, the number of M&A deals in the sector reached xx in 2024.
- Market Concentration: Moderately concentrated, with top players holding xx% market share (2025).
- Technological Innovation: Focus on lightweight, high-strength materials, and sustainable options.
- Regulatory Framework: Increasing emphasis on sustainability and building codes influence material choices.
- Competitive Substitutes: Traditional materials (steel, concrete) pose competition.
- End-User Demographics: Industrial, commercial, housing, and civil sectors are key end-users.
- M&A Trends: Consolidation and expansion driving recent acquisition activity (xx deals in 2024).
Construction Composite Materials Market Growth Trends & Insights
The Construction Composite Materials market exhibits a steady growth trajectory, driven by increasing demand for lightweight, high-strength, and durable materials in construction projects. The market size is estimated at xx million units in 2025, registering a CAGR of xx% during the forecast period (2025-2033). This growth is fueled by several factors, including robust infrastructure development across various regions, rising adoption of sustainable building practices, and technological advancements leading to improved composite material properties. The market penetration rate for composite materials in the construction sector is projected to reach xx% by 2033, driven primarily by increased awareness of the benefits of composite materials among architects, engineers, and contractors. Specific consumer behavior shifts towards eco-friendly and cost-effective materials further enhance this positive growth.
Dominant Regions, Countries, or Segments in Construction Composite Materials Market
North America currently holds the largest market share, driven by strong infrastructure investment and a robust housing sector. Within material types, Glass Fibers dominate the Fiber Type segment due to their cost-effectiveness and versatility. Polyester Resin leads in Resin Type, owing to its wide applications and established manufacturing infrastructure. The industrial and civil end-use sectors are significant contributors to market growth, fuelled by large-scale projects and increasing infrastructure spending. The growth of the Asia-Pacific region is noteworthy, attributed to rapid urbanization and expanding construction activities in developing economies.
- Key Drivers:
- Strong infrastructure development in North America and Asia-Pacific.
- Increasing adoption of sustainable building practices.
- Rising demand for high-performance materials in industrial and civil construction.
- Dominant Segments:
- Resin Type: Polyester Resin
- Fiber Type: Glass Fibers
- End-use Sector: Industrial and Civil
Construction Composite Materials Market Product Landscape
The Construction Composite Materials market showcases a diverse range of products with varying properties tailored to specific applications. Innovations center around enhancing strength-to-weight ratios, improving durability, and creating fire-resistant and sustainable options. Technological advancements focus on optimizing manufacturing processes to reduce costs and increase efficiency. Unique selling propositions often include enhanced longevity, reduced maintenance requirements, and improved environmental impact compared to traditional construction materials.
Key Drivers, Barriers & Challenges in Construction Composite Materials Market
Key Drivers: The growing demand for lightweight and high-strength materials in construction, coupled with the increasing focus on sustainable building practices, is driving the market. Technological advancements resulting in improved material properties and cost reductions also contribute significantly. Favorable government policies and regulations supporting green building further stimulate growth.
Key Challenges: High initial costs compared to traditional materials, potential supply chain disruptions, and the need for specialized installation expertise represent significant hurdles. Regulatory hurdles concerning material testing and approval processes can also hinder wider adoption. Furthermore, price fluctuations in raw materials pose a threat to profitability.
Emerging Opportunities in Construction Composite Materials Market
Untapped markets in developing economies present significant growth potential. The development of innovative applications, such as prefabricated composite structures and self-healing materials, is creating new opportunities. Evolving consumer preferences towards sustainable and energy-efficient buildings are also driving demand for eco-friendly composite materials.
Growth Accelerators in the Construction Composite Materials Market Industry
Technological breakthroughs in resin and fiber technology, reducing manufacturing costs and enhancing material properties, are key growth catalysts. Strategic partnerships between material manufacturers and construction companies are facilitating wider adoption. Expansion into new geographical markets, particularly in developing economies with rapid urbanization, is a major growth driver.
Key Players Shaping the Construction Composite Materials Market Market
Notable Milestones in Construction Composite Materials Market Sector
- June 2022: Owens Corning acquired WearDeck, strengthening its position in composite decking.
- June 2022: Owens Corning partnered with Pultron Composites, enhancing its fiberglass market presence.
In-Depth Construction Composite Materials Market Market Outlook
The Construction Composite Materials market is poised for robust growth driven by continuous technological advancements, sustainable building trends, and expanding infrastructure development globally. Strategic partnerships, market expansion into emerging economies, and innovation in product applications will be key to unlocking the market's significant future potential. The forecast period anticipates significant growth in both market size and penetration rates, making this sector an attractive investment opportunity.
Construction Composite Materials Market Segmentation
-
1. Resin Type
- 1.1. Polyester Resin
- 1.2. Vinyl Ester
- 1.3. Polyethylene
- 1.4. Polypropylene
- 1.5. Epoxy Resin
- 1.6. Other Resin Types
-
2. Fiber Type
- 2.1. Carbon Fibers
- 2.2. Glass Fibers
- 2.3. Natural Fibers
- 2.4. Other Fiber Types
-
3. End-use Sector
- 3.1. Industrial
- 3.2. Commercial
- 3.3. Housing
- 3.4. Civil
Construction Composite Materials Market Segmentation By Geography
-
1. Asia Pacific
- 1.1. China
- 1.2. India
- 1.3. Japan
- 1.4. South Korea
- 1.5. ASEAN Countries
- 1.6. Rest of Asia Pacific
-
2. North America
- 2.1. United States
- 2.2. Canada
- 2.3. Mexico
-
3. Europe
- 3.1. Germany
- 3.2. United Kingdom
- 3.3. Italy
- 3.4. France
- 3.5. Spain
- 3.6. Rest of Europe
-
4. South America
- 4.1. Brazil
- 4.2. Argentina
- 4.3. Rest of South America
-
5. Middle East and Africa
- 5.1. Saudi Arabia
- 5.2. South Africa
- 5.3. Rest of Middle East and Africa
Construction Composite Materials Market Regional Market Share
Geographic Coverage of Construction Composite Materials Market
Construction Composite Materials Market REPORT HIGHLIGHTS
| Aspects | Details |
|---|---|
| Study Period | 2020-2034 |
| Base Year | 2025 |
| Estimated Year | 2026 |
| Forecast Period | 2026-2034 |
| Historical Period | 2020-2025 |
| Growth Rate | CAGR of 5.91% from 2020-2034 |
| Segmentation |
|
Table of Contents
- 1. Introduction
- 1.1. Research Scope
- 1.2. Market Segmentation
- 1.3. Research Objective
- 1.4. Definitions and Assumptions
- 2. Executive Summary
- 2.1. Market Snapshot
- 3. Market Dynamics
- 3.1. Market Drivers
- 3.2. Market Restrains
- 3.3. Market Trends
- 3.4. Market Opportunities
- 4. Market Factor Analysis
- 4.1. Porters Five Forces
- 4.1.1. Bargaining Power of Suppliers
- 4.1.2. Bargaining Power of Buyers
- 4.1.3. Threat of New Entrants
- 4.1.4. Threat of Substitutes
- 4.1.5. Competitive Rivalry
- 4.2. PESTEL analysis
- 4.3. BCG Analysis
- 4.3.1. Stars (High Growth, High Market Share)
- 4.3.2. Cash Cows (Low Growth, High Market Share)
- 4.3.3. Question Mark (High Growth, Low Market Share)
- 4.3.4. Dogs (Low Growth, Low Market Share)
- 4.4. Ansoff Matrix Analysis
- 4.5. Supply Chain Analysis
- 4.6. Regulatory Landscape
- 4.7. Current Market Potential and Opportunity Assessment (TAM–SAM–SOM Framework)
- 4.8. VDR Analyst Note
- 4.1. Porters Five Forces
- 5. Market Analysis, Insights and Forecast 2021-2033
- 5.1. Market Analysis, Insights and Forecast - by Resin Type
- 5.1.1. Polyester Resin
- 5.1.2. Vinyl Ester
- 5.1.3. Polyethylene
- 5.1.4. Polypropylene
- 5.1.5. Epoxy Resin
- 5.1.6. Other Resin Types
- 5.2. Market Analysis, Insights and Forecast - by Fiber Type
- 5.2.1. Carbon Fibers
- 5.2.2. Glass Fibers
- 5.2.3. Natural Fibers
- 5.2.4. Other Fiber Types
- 5.3. Market Analysis, Insights and Forecast - by End-use Sector
- 5.3.1. Industrial
- 5.3.2. Commercial
- 5.3.3. Housing
- 5.3.4. Civil
- 5.4. Market Analysis, Insights and Forecast - by Region
- 5.4.1. Asia Pacific
- 5.4.2. North America
- 5.4.3. Europe
- 5.4.4. South America
- 5.4.5. Middle East and Africa
- 5.1. Market Analysis, Insights and Forecast - by Resin Type
- 6. Global Construction Composite Materials Market Analysis, Insights and Forecast, 2021-2033
- 6.1. Market Analysis, Insights and Forecast - by Resin Type
- 6.1.1. Polyester Resin
- 6.1.2. Vinyl Ester
- 6.1.3. Polyethylene
- 6.1.4. Polypropylene
- 6.1.5. Epoxy Resin
- 6.1.6. Other Resin Types
- 6.2. Market Analysis, Insights and Forecast - by Fiber Type
- 6.2.1. Carbon Fibers
- 6.2.2. Glass Fibers
- 6.2.3. Natural Fibers
- 6.2.4. Other Fiber Types
- 6.3. Market Analysis, Insights and Forecast - by End-use Sector
- 6.3.1. Industrial
- 6.3.2. Commercial
- 6.3.3. Housing
- 6.3.4. Civil
- 6.1. Market Analysis, Insights and Forecast - by Resin Type
- 7. Asia Pacific Construction Composite Materials Market Analysis, Insights and Forecast, 2021-2033
- 7.1. Market Analysis, Insights and Forecast - by Resin Type
- 7.1.1. Polyester Resin
- 7.1.2. Vinyl Ester
- 7.1.3. Polyethylene
- 7.1.4. Polypropylene
- 7.1.5. Epoxy Resin
- 7.1.6. Other Resin Types
- 7.2. Market Analysis, Insights and Forecast - by Fiber Type
- 7.2.1. Carbon Fibers
- 7.2.2. Glass Fibers
- 7.2.3. Natural Fibers
- 7.2.4. Other Fiber Types
- 7.3. Market Analysis, Insights and Forecast - by End-use Sector
- 7.3.1. Industrial
- 7.3.2. Commercial
- 7.3.3. Housing
- 7.3.4. Civil
- 7.1. Market Analysis, Insights and Forecast - by Resin Type
- 8. North America Construction Composite Materials Market Analysis, Insights and Forecast, 2021-2033
- 8.1. Market Analysis, Insights and Forecast - by Resin Type
- 8.1.1. Polyester Resin
- 8.1.2. Vinyl Ester
- 8.1.3. Polyethylene
- 8.1.4. Polypropylene
- 8.1.5. Epoxy Resin
- 8.1.6. Other Resin Types
- 8.2. Market Analysis, Insights and Forecast - by Fiber Type
- 8.2.1. Carbon Fibers
- 8.2.2. Glass Fibers
- 8.2.3. Natural Fibers
- 8.2.4. Other Fiber Types
- 8.3. Market Analysis, Insights and Forecast - by End-use Sector
- 8.3.1. Industrial
- 8.3.2. Commercial
- 8.3.3. Housing
- 8.3.4. Civil
- 8.1. Market Analysis, Insights and Forecast - by Resin Type
- 9. Europe Construction Composite Materials Market Analysis, Insights and Forecast, 2021-2033
- 9.1. Market Analysis, Insights and Forecast - by Resin Type
- 9.1.1. Polyester Resin
- 9.1.2. Vinyl Ester
- 9.1.3. Polyethylene
- 9.1.4. Polypropylene
- 9.1.5. Epoxy Resin
- 9.1.6. Other Resin Types
- 9.2. Market Analysis, Insights and Forecast - by Fiber Type
- 9.2.1. Carbon Fibers
- 9.2.2. Glass Fibers
- 9.2.3. Natural Fibers
- 9.2.4. Other Fiber Types
- 9.3. Market Analysis, Insights and Forecast - by End-use Sector
- 9.3.1. Industrial
- 9.3.2. Commercial
- 9.3.3. Housing
- 9.3.4. Civil
- 9.1. Market Analysis, Insights and Forecast - by Resin Type
- 10. South America Construction Composite Materials Market Analysis, Insights and Forecast, 2021-2033
- 10.1. Market Analysis, Insights and Forecast - by Resin Type
- 10.1.1. Polyester Resin
- 10.1.2. Vinyl Ester
- 10.1.3. Polyethylene
- 10.1.4. Polypropylene
- 10.1.5. Epoxy Resin
- 10.1.6. Other Resin Types
- 10.2. Market Analysis, Insights and Forecast - by Fiber Type
- 10.2.1. Carbon Fibers
- 10.2.2. Glass Fibers
- 10.2.3. Natural Fibers
- 10.2.4. Other Fiber Types
- 10.3. Market Analysis, Insights and Forecast - by End-use Sector
- 10.3.1. Industrial
- 10.3.2. Commercial
- 10.3.3. Housing
- 10.3.4. Civil
- 10.1. Market Analysis, Insights and Forecast - by Resin Type
- 11. Middle East and Africa Construction Composite Materials Market Analysis, Insights and Forecast, 2021-2033
- 11.1. Market Analysis, Insights and Forecast - by Resin Type
- 11.1.1. Polyester Resin
- 11.1.2. Vinyl Ester
- 11.1.3. Polyethylene
- 11.1.4. Polypropylene
- 11.1.5. Epoxy Resin
- 11.1.6. Other Resin Types
- 11.2. Market Analysis, Insights and Forecast - by Fiber Type
- 11.2.1. Carbon Fibers
- 11.2.2. Glass Fibers
- 11.2.3. Natural Fibers
- 11.2.4. Other Fiber Types
- 11.3. Market Analysis, Insights and Forecast - by End-use Sector
- 11.3.1. Industrial
- 11.3.2. Commercial
- 11.3.3. Housing
- 11.3.4. Civil
- 11.1. Market Analysis, Insights and Forecast - by Resin Type
- 12. Competitive Analysis
- 12.1. Company Profiles
- 12.1.1 SGL Carbon
- 12.1.1.1. Company Overview
- 12.1.1.2. Products
- 12.1.1.3. Company Financials
- 12.1.1.4. SWOT Analysis
- 12.1.2 Mitsubishi Chemical Corporation
- 12.1.2.1. Company Overview
- 12.1.2.2. Products
- 12.1.2.3. Company Financials
- 12.1.2.4. SWOT Analysis
- 12.1.3 Hexcel Corporation
- 12.1.3.1. Company Overview
- 12.1.3.2. Products
- 12.1.3.3. Company Financials
- 12.1.3.4. SWOT Analysis
- 12.1.4 Teijin Limite
- 12.1.4.1. Company Overview
- 12.1.4.2. Products
- 12.1.4.3. Company Financials
- 12.1.4.4. SWOT Analysis
- 12.1.5 Toray Industries Inc
- 12.1.5.1. Company Overview
- 12.1.5.2. Products
- 12.1.5.3. Company Financials
- 12.1.5.4. SWOT Analysis
- 12.1.6 Gurit
- 12.1.6.1. Company Overview
- 12.1.6.2. Products
- 12.1.6.3. Company Financials
- 12.1.6.4. SWOT Analysis
- 12.1.7 Exel Composites
- 12.1.7.1. Company Overview
- 12.1.7.2. Products
- 12.1.7.3. Company Financials
- 12.1.7.4. SWOT Analysis
- 12.1.8 Nippon Electric Glass Co Ltd
- 12.1.8.1. Company Overview
- 12.1.8.2. Products
- 12.1.8.3. Company Financials
- 12.1.8.4. SWOT Analysis
- 12.1.9 Kordsa Teknik Tekstil AS
- 12.1.9.1. Company Overview
- 12.1.9.2. Products
- 12.1.9.3. Company Financials
- 12.1.9.4. SWOT Analysis
- 12.1.10 Owens Corning
- 12.1.10.1. Company Overview
- 12.1.10.2. Products
- 12.1.10.3. Company Financials
- 12.1.10.4. SWOT Analysis
- 12.1.11 Aegion Corporation
- 12.1.11.1. Company Overview
- 12.1.11.2. Products
- 12.1.11.3. Company Financials
- 12.1.11.4. SWOT Analysis
- 12.1.1 SGL Carbon
- 12.2. Market Entropy
- 12.2.1 Company's Key Areas Served
- 12.2.2 Recent Developments
- 12.3. Company Market Share Analysis 2025
- 12.3.1 Top 5 Companies Market Share Analysis
- 12.3.2 Top 3 Companies Market Share Analysis
- 12.4. List of Potential Customers
- 13. Research Methodology
List of Figures
- Figure 1: Global Construction Composite Materials Market Revenue Breakdown (Million, %) by Region 2025 & 2033
- Figure 2: Global Construction Composite Materials Market Volume Breakdown (Kiloton, %) by Region 2025 & 2033
- Figure 3: Asia Pacific Construction Composite Materials Market Revenue (Million), by Resin Type 2025 & 2033
- Figure 4: Asia Pacific Construction Composite Materials Market Volume (Kiloton), by Resin Type 2025 & 2033
- Figure 5: Asia Pacific Construction Composite Materials Market Revenue Share (%), by Resin Type 2025 & 2033
- Figure 6: Asia Pacific Construction Composite Materials Market Volume Share (%), by Resin Type 2025 & 2033
- Figure 7: Asia Pacific Construction Composite Materials Market Revenue (Million), by Fiber Type 2025 & 2033
- Figure 8: Asia Pacific Construction Composite Materials Market Volume (Kiloton), by Fiber Type 2025 & 2033
- Figure 9: Asia Pacific Construction Composite Materials Market Revenue Share (%), by Fiber Type 2025 & 2033
- Figure 10: Asia Pacific Construction Composite Materials Market Volume Share (%), by Fiber Type 2025 & 2033
- Figure 11: Asia Pacific Construction Composite Materials Market Revenue (Million), by End-use Sector 2025 & 2033
- Figure 12: Asia Pacific Construction Composite Materials Market Volume (Kiloton), by End-use Sector 2025 & 2033
- Figure 13: Asia Pacific Construction Composite Materials Market Revenue Share (%), by End-use Sector 2025 & 2033
- Figure 14: Asia Pacific Construction Composite Materials Market Volume Share (%), by End-use Sector 2025 & 2033
- Figure 15: Asia Pacific Construction Composite Materials Market Revenue (Million), by Country 2025 & 2033
- Figure 16: Asia Pacific Construction Composite Materials Market Volume (Kiloton), by Country 2025 & 2033
- Figure 17: Asia Pacific Construction Composite Materials Market Revenue Share (%), by Country 2025 & 2033
- Figure 18: Asia Pacific Construction Composite Materials Market Volume Share (%), by Country 2025 & 2033
- Figure 19: North America Construction Composite Materials Market Revenue (Million), by Resin Type 2025 & 2033
- Figure 20: North America Construction Composite Materials Market Volume (Kiloton), by Resin Type 2025 & 2033
- Figure 21: North America Construction Composite Materials Market Revenue Share (%), by Resin Type 2025 & 2033
- Figure 22: North America Construction Composite Materials Market Volume Share (%), by Resin Type 2025 & 2033
- Figure 23: North America Construction Composite Materials Market Revenue (Million), by Fiber Type 2025 & 2033
- Figure 24: North America Construction Composite Materials Market Volume (Kiloton), by Fiber Type 2025 & 2033
- Figure 25: North America Construction Composite Materials Market Revenue Share (%), by Fiber Type 2025 & 2033
- Figure 26: North America Construction Composite Materials Market Volume Share (%), by Fiber Type 2025 & 2033
- Figure 27: North America Construction Composite Materials Market Revenue (Million), by End-use Sector 2025 & 2033
- Figure 28: North America Construction Composite Materials Market Volume (Kiloton), by End-use Sector 2025 & 2033
- Figure 29: North America Construction Composite Materials Market Revenue Share (%), by End-use Sector 2025 & 2033
- Figure 30: North America Construction Composite Materials Market Volume Share (%), by End-use Sector 2025 & 2033
- Figure 31: North America Construction Composite Materials Market Revenue (Million), by Country 2025 & 2033
- Figure 32: North America Construction Composite Materials Market Volume (Kiloton), by Country 2025 & 2033
- Figure 33: North America Construction Composite Materials Market Revenue Share (%), by Country 2025 & 2033
- Figure 34: North America Construction Composite Materials Market Volume Share (%), by Country 2025 & 2033
- Figure 35: Europe Construction Composite Materials Market Revenue (Million), by Resin Type 2025 & 2033
- Figure 36: Europe Construction Composite Materials Market Volume (Kiloton), by Resin Type 2025 & 2033
- Figure 37: Europe Construction Composite Materials Market Revenue Share (%), by Resin Type 2025 & 2033
- Figure 38: Europe Construction Composite Materials Market Volume Share (%), by Resin Type 2025 & 2033
- Figure 39: Europe Construction Composite Materials Market Revenue (Million), by Fiber Type 2025 & 2033
- Figure 40: Europe Construction Composite Materials Market Volume (Kiloton), by Fiber Type 2025 & 2033
- Figure 41: Europe Construction Composite Materials Market Revenue Share (%), by Fiber Type 2025 & 2033
- Figure 42: Europe Construction Composite Materials Market Volume Share (%), by Fiber Type 2025 & 2033
- Figure 43: Europe Construction Composite Materials Market Revenue (Million), by End-use Sector 2025 & 2033
- Figure 44: Europe Construction Composite Materials Market Volume (Kiloton), by End-use Sector 2025 & 2033
- Figure 45: Europe Construction Composite Materials Market Revenue Share (%), by End-use Sector 2025 & 2033
- Figure 46: Europe Construction Composite Materials Market Volume Share (%), by End-use Sector 2025 & 2033
- Figure 47: Europe Construction Composite Materials Market Revenue (Million), by Country 2025 & 2033
- Figure 48: Europe Construction Composite Materials Market Volume (Kiloton), by Country 2025 & 2033
- Figure 49: Europe Construction Composite Materials Market Revenue Share (%), by Country 2025 & 2033
- Figure 50: Europe Construction Composite Materials Market Volume Share (%), by Country 2025 & 2033
- Figure 51: South America Construction Composite Materials Market Revenue (Million), by Resin Type 2025 & 2033
- Figure 52: South America Construction Composite Materials Market Volume (Kiloton), by Resin Type 2025 & 2033
- Figure 53: South America Construction Composite Materials Market Revenue Share (%), by Resin Type 2025 & 2033
- Figure 54: South America Construction Composite Materials Market Volume Share (%), by Resin Type 2025 & 2033
- Figure 55: South America Construction Composite Materials Market Revenue (Million), by Fiber Type 2025 & 2033
- Figure 56: South America Construction Composite Materials Market Volume (Kiloton), by Fiber Type 2025 & 2033
- Figure 57: South America Construction Composite Materials Market Revenue Share (%), by Fiber Type 2025 & 2033
- Figure 58: South America Construction Composite Materials Market Volume Share (%), by Fiber Type 2025 & 2033
- Figure 59: South America Construction Composite Materials Market Revenue (Million), by End-use Sector 2025 & 2033
- Figure 60: South America Construction Composite Materials Market Volume (Kiloton), by End-use Sector 2025 & 2033
- Figure 61: South America Construction Composite Materials Market Revenue Share (%), by End-use Sector 2025 & 2033
- Figure 62: South America Construction Composite Materials Market Volume Share (%), by End-use Sector 2025 & 2033
- Figure 63: South America Construction Composite Materials Market Revenue (Million), by Country 2025 & 2033
- Figure 64: South America Construction Composite Materials Market Volume (Kiloton), by Country 2025 & 2033
- Figure 65: South America Construction Composite Materials Market Revenue Share (%), by Country 2025 & 2033
- Figure 66: South America Construction Composite Materials Market Volume Share (%), by Country 2025 & 2033
- Figure 67: Middle East and Africa Construction Composite Materials Market Revenue (Million), by Resin Type 2025 & 2033
- Figure 68: Middle East and Africa Construction Composite Materials Market Volume (Kiloton), by Resin Type 2025 & 2033
- Figure 69: Middle East and Africa Construction Composite Materials Market Revenue Share (%), by Resin Type 2025 & 2033
- Figure 70: Middle East and Africa Construction Composite Materials Market Volume Share (%), by Resin Type 2025 & 2033
- Figure 71: Middle East and Africa Construction Composite Materials Market Revenue (Million), by Fiber Type 2025 & 2033
- Figure 72: Middle East and Africa Construction Composite Materials Market Volume (Kiloton), by Fiber Type 2025 & 2033
- Figure 73: Middle East and Africa Construction Composite Materials Market Revenue Share (%), by Fiber Type 2025 & 2033
- Figure 74: Middle East and Africa Construction Composite Materials Market Volume Share (%), by Fiber Type 2025 & 2033
- Figure 75: Middle East and Africa Construction Composite Materials Market Revenue (Million), by End-use Sector 2025 & 2033
- Figure 76: Middle East and Africa Construction Composite Materials Market Volume (Kiloton), by End-use Sector 2025 & 2033
- Figure 77: Middle East and Africa Construction Composite Materials Market Revenue Share (%), by End-use Sector 2025 & 2033
- Figure 78: Middle East and Africa Construction Composite Materials Market Volume Share (%), by End-use Sector 2025 & 2033
- Figure 79: Middle East and Africa Construction Composite Materials Market Revenue (Million), by Country 2025 & 2033
- Figure 80: Middle East and Africa Construction Composite Materials Market Volume (Kiloton), by Country 2025 & 2033
- Figure 81: Middle East and Africa Construction Composite Materials Market Revenue Share (%), by Country 2025 & 2033
- Figure 82: Middle East and Africa Construction Composite Materials Market Volume Share (%), by Country 2025 & 2033
List of Tables
- Table 1: Global Construction Composite Materials Market Revenue Million Forecast, by Resin Type 2020 & 2033
- Table 2: Global Construction Composite Materials Market Volume Kiloton Forecast, by Resin Type 2020 & 2033
- Table 3: Global Construction Composite Materials Market Revenue Million Forecast, by Fiber Type 2020 & 2033
- Table 4: Global Construction Composite Materials Market Volume Kiloton Forecast, by Fiber Type 2020 & 2033
- Table 5: Global Construction Composite Materials Market Revenue Million Forecast, by End-use Sector 2020 & 2033
- Table 6: Global Construction Composite Materials Market Volume Kiloton Forecast, by End-use Sector 2020 & 2033
- Table 7: Global Construction Composite Materials Market Revenue Million Forecast, by Region 2020 & 2033
- Table 8: Global Construction Composite Materials Market Volume Kiloton Forecast, by Region 2020 & 2033
- Table 9: Global Construction Composite Materials Market Revenue Million Forecast, by Resin Type 2020 & 2033
- Table 10: Global Construction Composite Materials Market Volume Kiloton Forecast, by Resin Type 2020 & 2033
- Table 11: Global Construction Composite Materials Market Revenue Million Forecast, by Fiber Type 2020 & 2033
- Table 12: Global Construction Composite Materials Market Volume Kiloton Forecast, by Fiber Type 2020 & 2033
- Table 13: Global Construction Composite Materials Market Revenue Million Forecast, by End-use Sector 2020 & 2033
- Table 14: Global Construction Composite Materials Market Volume Kiloton Forecast, by End-use Sector 2020 & 2033
- Table 15: Global Construction Composite Materials Market Revenue Million Forecast, by Country 2020 & 2033
- Table 16: Global Construction Composite Materials Market Volume Kiloton Forecast, by Country 2020 & 2033
- Table 17: China Construction Composite Materials Market Revenue (Million) Forecast, by Application 2020 & 2033
- Table 18: China Construction Composite Materials Market Volume (Kiloton) Forecast, by Application 2020 & 2033
- Table 19: India Construction Composite Materials Market Revenue (Million) Forecast, by Application 2020 & 2033
- Table 20: India Construction Composite Materials Market Volume (Kiloton) Forecast, by Application 2020 & 2033
- Table 21: Japan Construction Composite Materials Market Revenue (Million) Forecast, by Application 2020 & 2033
- Table 22: Japan Construction Composite Materials Market Volume (Kiloton) Forecast, by Application 2020 & 2033
- Table 23: South Korea Construction Composite Materials Market Revenue (Million) Forecast, by Application 2020 & 2033
- Table 24: South Korea Construction Composite Materials Market Volume (Kiloton) Forecast, by Application 2020 & 2033
- Table 25: ASEAN Countries Construction Composite Materials Market Revenue (Million) Forecast, by Application 2020 & 2033
- Table 26: ASEAN Countries Construction Composite Materials Market Volume (Kiloton) Forecast, by Application 2020 & 2033
- Table 27: Rest of Asia Pacific Construction Composite Materials Market Revenue (Million) Forecast, by Application 2020 & 2033
- Table 28: Rest of Asia Pacific Construction Composite Materials Market Volume (Kiloton) Forecast, by Application 2020 & 2033
- Table 29: Global Construction Composite Materials Market Revenue Million Forecast, by Resin Type 2020 & 2033
- Table 30: Global Construction Composite Materials Market Volume Kiloton Forecast, by Resin Type 2020 & 2033
- Table 31: Global Construction Composite Materials Market Revenue Million Forecast, by Fiber Type 2020 & 2033
- Table 32: Global Construction Composite Materials Market Volume Kiloton Forecast, by Fiber Type 2020 & 2033
- Table 33: Global Construction Composite Materials Market Revenue Million Forecast, by End-use Sector 2020 & 2033
- Table 34: Global Construction Composite Materials Market Volume Kiloton Forecast, by End-use Sector 2020 & 2033
- Table 35: Global Construction Composite Materials Market Revenue Million Forecast, by Country 2020 & 2033
- Table 36: Global Construction Composite Materials Market Volume Kiloton Forecast, by Country 2020 & 2033
- Table 37: United States Construction Composite Materials Market Revenue (Million) Forecast, by Application 2020 & 2033
- Table 38: United States Construction Composite Materials Market Volume (Kiloton) Forecast, by Application 2020 & 2033
- Table 39: Canada Construction Composite Materials Market Revenue (Million) Forecast, by Application 2020 & 2033
- Table 40: Canada Construction Composite Materials Market Volume (Kiloton) Forecast, by Application 2020 & 2033
- Table 41: Mexico Construction Composite Materials Market Revenue (Million) Forecast, by Application 2020 & 2033
- Table 42: Mexico Construction Composite Materials Market Volume (Kiloton) Forecast, by Application 2020 & 2033
- Table 43: Global Construction Composite Materials Market Revenue Million Forecast, by Resin Type 2020 & 2033
- Table 44: Global Construction Composite Materials Market Volume Kiloton Forecast, by Resin Type 2020 & 2033
- Table 45: Global Construction Composite Materials Market Revenue Million Forecast, by Fiber Type 2020 & 2033
- Table 46: Global Construction Composite Materials Market Volume Kiloton Forecast, by Fiber Type 2020 & 2033
- Table 47: Global Construction Composite Materials Market Revenue Million Forecast, by End-use Sector 2020 & 2033
- Table 48: Global Construction Composite Materials Market Volume Kiloton Forecast, by End-use Sector 2020 & 2033
- Table 49: Global Construction Composite Materials Market Revenue Million Forecast, by Country 2020 & 2033
- Table 50: Global Construction Composite Materials Market Volume Kiloton Forecast, by Country 2020 & 2033
- Table 51: Germany Construction Composite Materials Market Revenue (Million) Forecast, by Application 2020 & 2033
- Table 52: Germany Construction Composite Materials Market Volume (Kiloton) Forecast, by Application 2020 & 2033
- Table 53: United Kingdom Construction Composite Materials Market Revenue (Million) Forecast, by Application 2020 & 2033
- Table 54: United Kingdom Construction Composite Materials Market Volume (Kiloton) Forecast, by Application 2020 & 2033
- Table 55: Italy Construction Composite Materials Market Revenue (Million) Forecast, by Application 2020 & 2033
- Table 56: Italy Construction Composite Materials Market Volume (Kiloton) Forecast, by Application 2020 & 2033
- Table 57: France Construction Composite Materials Market Revenue (Million) Forecast, by Application 2020 & 2033
- Table 58: France Construction Composite Materials Market Volume (Kiloton) Forecast, by Application 2020 & 2033
- Table 59: Spain Construction Composite Materials Market Revenue (Million) Forecast, by Application 2020 & 2033
- Table 60: Spain Construction Composite Materials Market Volume (Kiloton) Forecast, by Application 2020 & 2033
- Table 61: Rest of Europe Construction Composite Materials Market Revenue (Million) Forecast, by Application 2020 & 2033
- Table 62: Rest of Europe Construction Composite Materials Market Volume (Kiloton) Forecast, by Application 2020 & 2033
- Table 63: Global Construction Composite Materials Market Revenue Million Forecast, by Resin Type 2020 & 2033
- Table 64: Global Construction Composite Materials Market Volume Kiloton Forecast, by Resin Type 2020 & 2033
- Table 65: Global Construction Composite Materials Market Revenue Million Forecast, by Fiber Type 2020 & 2033
- Table 66: Global Construction Composite Materials Market Volume Kiloton Forecast, by Fiber Type 2020 & 2033
- Table 67: Global Construction Composite Materials Market Revenue Million Forecast, by End-use Sector 2020 & 2033
- Table 68: Global Construction Composite Materials Market Volume Kiloton Forecast, by End-use Sector 2020 & 2033
- Table 69: Global Construction Composite Materials Market Revenue Million Forecast, by Country 2020 & 2033
- Table 70: Global Construction Composite Materials Market Volume Kiloton Forecast, by Country 2020 & 2033
- Table 71: Brazil Construction Composite Materials Market Revenue (Million) Forecast, by Application 2020 & 2033
- Table 72: Brazil Construction Composite Materials Market Volume (Kiloton) Forecast, by Application 2020 & 2033
- Table 73: Argentina Construction Composite Materials Market Revenue (Million) Forecast, by Application 2020 & 2033
- Table 74: Argentina Construction Composite Materials Market Volume (Kiloton) Forecast, by Application 2020 & 2033
- Table 75: Rest of South America Construction Composite Materials Market Revenue (Million) Forecast, by Application 2020 & 2033
- Table 76: Rest of South America Construction Composite Materials Market Volume (Kiloton) Forecast, by Application 2020 & 2033
- Table 77: Global Construction Composite Materials Market Revenue Million Forecast, by Resin Type 2020 & 2033
- Table 78: Global Construction Composite Materials Market Volume Kiloton Forecast, by Resin Type 2020 & 2033
- Table 79: Global Construction Composite Materials Market Revenue Million Forecast, by Fiber Type 2020 & 2033
- Table 80: Global Construction Composite Materials Market Volume Kiloton Forecast, by Fiber Type 2020 & 2033
- Table 81: Global Construction Composite Materials Market Revenue Million Forecast, by End-use Sector 2020 & 2033
- Table 82: Global Construction Composite Materials Market Volume Kiloton Forecast, by End-use Sector 2020 & 2033
- Table 83: Global Construction Composite Materials Market Revenue Million Forecast, by Country 2020 & 2033
- Table 84: Global Construction Composite Materials Market Volume Kiloton Forecast, by Country 2020 & 2033
- Table 85: Saudi Arabia Construction Composite Materials Market Revenue (Million) Forecast, by Application 2020 & 2033
- Table 86: Saudi Arabia Construction Composite Materials Market Volume (Kiloton) Forecast, by Application 2020 & 2033
- Table 87: South Africa Construction Composite Materials Market Revenue (Million) Forecast, by Application 2020 & 2033
- Table 88: South Africa Construction Composite Materials Market Volume (Kiloton) Forecast, by Application 2020 & 2033
- Table 89: Rest of Middle East and Africa Construction Composite Materials Market Revenue (Million) Forecast, by Application 2020 & 2033
- Table 90: Rest of Middle East and Africa Construction Composite Materials Market Volume (Kiloton) Forecast, by Application 2020 & 2033
Frequently Asked Questions
1. What is the projected Compound Annual Growth Rate (CAGR) of the Construction Composite Materials Market?
The projected CAGR is approximately 5.91%.
2. Which companies are prominent players in the Construction Composite Materials Market?
Key companies in the market include SGL Carbon, Mitsubishi Chemical Corporation, Hexcel Corporation, Teijin Limite, Toray Industries Inc, Gurit, Exel Composites, Nippon Electric Glass Co Ltd, Kordsa Teknik Tekstil AS, Owens Corning, Aegion Corporation.
3. What are the main segments of the Construction Composite Materials Market?
The market segments include Resin Type, Fiber Type, End-use Sector.
4. Can you provide details about the market size?
The market size is estimated to be USD 22.88 Million as of 2022.
5. What are some drivers contributing to market growth?
Increasing Use of Composites in Construction Applications; Rehabilitation of Old Concrete Structures.
6. What are the notable trends driving market growth?
Civil Construction Sector to Dominate the Market.
7. Are there any restraints impacting market growth?
High Initial Production and Installation Costs of Composites.
8. Can you provide examples of recent developments in the market?
In June 2022, Owens Corning acquired WearDeck, a composite decking and structural lumber manufacturer, in Florida, USA. This move strengthened the company's position in the construction composite materials market.
9. What pricing options are available for accessing the report?
Pricing options include single-user, multi-user, and enterprise licenses priced at USD 4750, USD 5250, and USD 8750 respectively.
10. Is the market size provided in terms of value or volume?
The market size is provided in terms of value, measured in Million and volume, measured in Kiloton.
11. Are there any specific market keywords associated with the report?
Yes, the market keyword associated with the report is "Construction Composite Materials Market," which aids in identifying and referencing the specific market segment covered.
12. How do I determine which pricing option suits my needs best?
The pricing options vary based on user requirements and access needs. Individual users may opt for single-user licenses, while businesses requiring broader access may choose multi-user or enterprise licenses for cost-effective access to the report.
13. Are there any additional resources or data provided in the Construction Composite Materials Market report?
While the report offers comprehensive insights, it's advisable to review the specific contents or supplementary materials provided to ascertain if additional resources or data are available.
14. How can I stay updated on further developments or reports in the Construction Composite Materials Market?
To stay informed about further developments, trends, and reports in the Construction Composite Materials Market, consider subscribing to industry newsletters, following relevant companies and organizations, or regularly checking reputable industry news sources and publications.
Methodology
Step 1 - Identification of Relevant Samples Size from Population Database


Step 2 - Approaches for Defining Global Market Size (Value, Volume* & Price*)

Note*: In applicable scenarios
Step 3 - Data Sources
Primary Research
- Web Analytics
- Survey Reports
- Research Institute
- Latest Research Reports
- Opinion Leaders
Secondary Research
- Annual Reports
- White Paper
- Latest Press Release
- Industry Association
- Paid Database
- Investor Presentations

Step 4 - Data Triangulation
Involves using different sources of information in order to increase the validity of a study
These sources are likely to be stakeholders in a program - participants, other researchers, program staff, other community members, and so on.
Then we put all data in single framework & apply various statistical tools to find out the dynamic on the market.
During the analysis stage, feedback from the stakeholder groups would be compared to determine areas of agreement as well as areas of divergence